
 Download PDF
 Download PDF
Market Overview
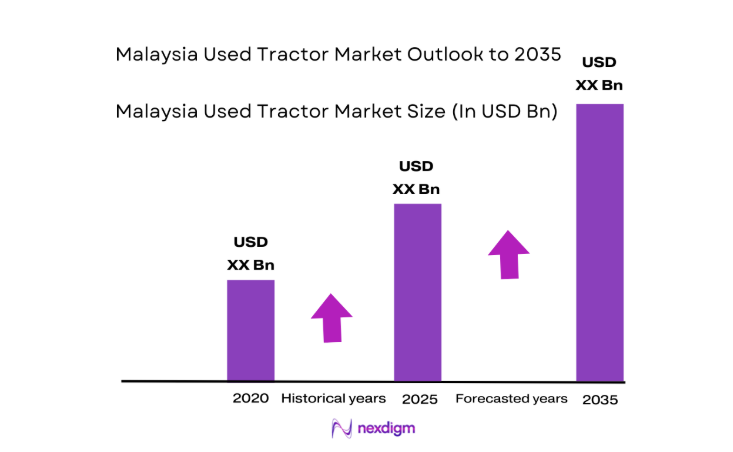
The Malaysia Used Tractor market current size stands at around USD ~ million, reflecting sustained replacement demand across plantation, paddy, and mixed-crop farming systems supported by established dealer networks and refurbishment ecosystems. Transaction values remain masked due to market opacity and fragmented trade structures, while liquidity is influenced by availability cycles from estate fleet renewals and import reconditioning flows. Price dispersion reflects heterogeneous asset age, engine hours, refurbishment depth, and attachment bundles across secondary markets.
Demand concentration is strongest across plantation-dense corridors in Peninsular Malaysia, with secondary clusters in Sabah and Sarawak supported by estate logistics hubs and dealer service footprints. Mechanization intensity is reinforced by estate-led operations, cooperative aggregation in smallholder belts, and port-adjacent refurbishment yards that shorten lead times. Policy emphasis on productivity, localized service ecosystems, and parts availability in regional towns further anchors market activity around infrastructure-rich agrarian nodes.
Market Segmentation
By Tractor Type
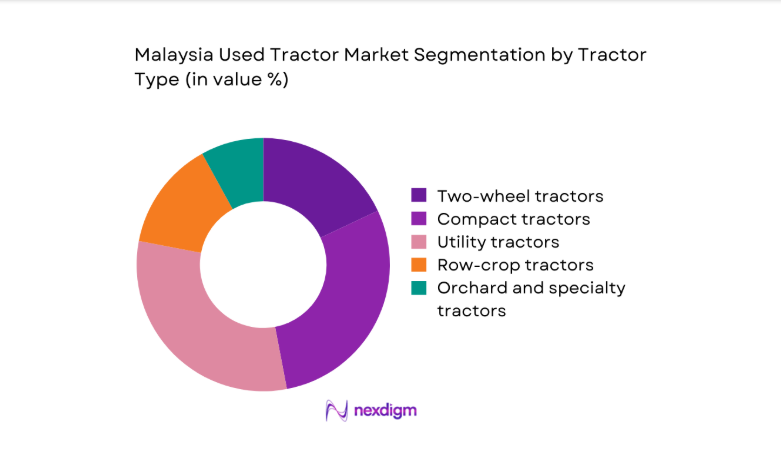
Utility and compact tractors dominate transactions due to their suitability across mixed-crop farms, estate maintenance, and inter-row operations in plantations. Orchard and specialty tractors see steady uptake where terrain constraints and canopy clearance matter, while two-wheel units persist in smaller paddy plots due to maneuverability and affordability in secondary markets. Demand is shaped by refurbishment availability, attachment compatibility, and dealer warranty programs that reduce perceived risk. Import flows of reconditioned Japanese units reinforce mid-range preferences, while local fleet replacements supply heavier categories for estate operations. Channel availability and parts compatibility influence buyer choices across types.
By End Use Application
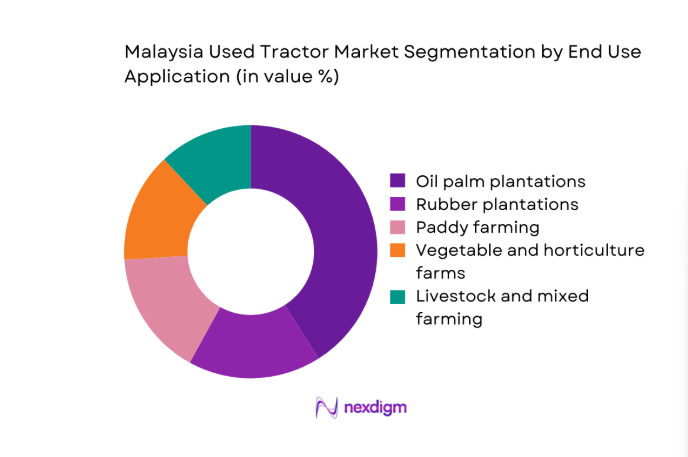
Plantation applications anchor demand due to continuous estate maintenance, replanting cycles, and in-field logistics needs. Paddy farming sustains steady turnover aligned with seasonal operations and cooperative procurement, while vegetable and horticulture users favor compact formats for confined plots. Livestock and mixed farming rely on utility configurations for hauling and material handling, supported by attachment ecosystems. Dealer proximity, service response times, and financing access shape end-user selection. Import reconditioned inventory availability and refurbishment certification programs further guide application-specific preferences across regional clusters with differing terrain and cropping patterns.
Competitive Landscape
The competitive environment is fragmented, with authorized dealers, independent refurbishers, and traders competing on inventory depth, refurbishment quality, warranty coverage, and service reach. Channel strength and regulatory readiness shape buyer trust, while logistics coverage into East Malaysia differentiates scale operators from localized traders.
| Company Name | Establishment Year | Headquarters | Formulation Depth | Distribution Reach | Regulatory Readiness | Service Capability | Channel Strength | Pricing Flexibility |
| Kubota Malaysia | 1976 | Kuala Lumpur | ~ | ~ | ~ | ~ | ~ | ~ |
| Yanmar Malaysia | 1987 | Shah Alam | ~ | ~ | ~ | ~ | ~ | ~ |
| Sime Darby Industrial | 1910 | Kuala Lumpur | ~ | ~ | ~ | ~ | ~ | ~ |
| Tractors Malaysia | 1954 | Petaling Jaya | ~ | ~ | ~ | ~ | ~ | ~ |
| UMW Equipment | 1917 | Kuala Lumpur | ~ | ~ | ~ | ~ | ~ | ~ |

Malaysia Used Tractor Market Analysis
Growth Drivers
Rising mechanization in smallholder and mid-sized farms
Mechanization adoption across smallholder and mid-sized farms intensified as labor constraints persisted and planting calendars tightened. Agricultural labor permits issued in 2024 reached 210000, while mechanization grants supported 4200 equipment accessions through cooperatives. In 2025, estate maintenance schedules expanded across 38 districts, increasing demand for field-ready machinery during peak replanting windows. Port throughput improvements enabled 14 day reductions in inland delivery times to agrarian corridors, lowering downtime risks. Extension services reported 960 field clinics in 2024 promoting equipment maintenance literacy. Irrigated paddy command areas expanded by 1200 hectares in 2025, sustaining utilization cycles. Rural road upgrades totaling 680 kilometers improved service reach.
Cost advantage of used equipment versus new imports
Import substitution dynamics favored used equipment as foreign exchange volatility constrained new machinery procurement. In 2024, customs processing times for reconditioned units averaged 9 days, compared with 21 days for new equipment consignments. Dealer refurbishment throughput increased to 1280 units in 2025, reducing lead times for field deployment. Financing approvals for pre owned machinery rose to 17600 contracts in 2024 as lenders widened asset eligibility. Port clearance efficiency improved across 3 terminals, supporting faster turnaround. Agricultural equipment utilization days increased to 248 days in 2025 across estate maintenance cycles. Technical training sessions for refurbishers reached 540 participants in 2024, improving reliability perceptions among buyers.
Challenges
Inconsistent quality and refurbishment standards across dealers
Quality dispersion remains a barrier due to uneven refurbishment practices and documentation gaps. In 2024, inspection failures recorded by regional transport offices totaled 1840 cases linked to braking and emissions non-compliance. Service bay certification coverage reached only 62 locations nationwide in 2025, limiting standardized reconditioning capacity. Warranty claim incidences averaged 7 claims per 100 units sold during 2024, reflecting variability in overhaul depth. Technician accreditation programs trained 320 mechanics in 2025, insufficient relative to demand. Parts traceability audits covered 410 workshops in 2024, revealing inconsistent sourcing practices. Equipment downtime averaged 6 days per service event in 2025 across rural corridors, disrupting seasonal operations.
Limited availability of spare parts for older models
Parts scarcity constrains uptime for legacy models prevalent in secondary markets. In 2024, backorder cycles for critical components averaged 18 days, extending equipment downtime during peak field windows. Import licensing for components processed through 5 designated ports, creating logistics bottlenecks for interior regions. Dealer inventories covered only 72 percent of fast-moving parts lists in 2025, prompting reliance on parallel imports. Technical bulletins recorded 430 compatibility mismatches in 2024 across engine and hydraulic variants. Local remanufacturing pilots produced 260 component SKUs in 2025, still insufficient to offset shortages. Service networks reported 3 repeat visits per repair cycle for older units, elevating maintenance burdens.
Opportunities
Growth of certified refurbished tractor programs
Certification frameworks can standardize quality and reduce buyer risk. In 2024, pilot certification covered 280 units across 12 dealerships, with inspection protocols aligned to transport compliance checklists. Training programs expanded to 460 technicians in 2025, improving overhaul consistency. Digital service records adopted by 94 outlets in 2024 enhanced traceability and warranty administration. Compliance audits conducted 6 cycles annually improved pass rates across emissions and braking tests. Regional service hubs increased to 24 in 2025, shortening turnaround times for certified units. Cooperative procurement pilots aggregated 210 orders in 2024, improving scale efficiencies for certified inventory deployment across plantation belts.
Digital platforms enabling price transparency and wider reach
Marketplace digitization broadens discovery and reduces search frictions. In 2024, verified listings exceeded 12600 across national platforms, improving inventory visibility across districts. Dealer onboarding programs enrolled 780 sellers by 2025, expanding rural reach. Digital inspection reports uploaded for 4100 units in 2024 standardized condition disclosure. Escrow-enabled transactions processed 9200 orders in 2025, improving payment security. Logistics integrations connected 38 regional carriers in 2024, reducing delivery lead times. Buyer support chat volumes reached 68000 interactions in 2025, accelerating conversion cycles. Analytics dashboards tracked 24 performance indicators, enabling sellers to optimize inventory rotation across seasons.
Future Outlook
The outlook reflects steady formalization of refurbishment standards, expanding digital discovery, and deeper financing penetration across smallholder and estate users. Infrastructure upgrades and service hub expansion should reduce downtime risks. Import processing efficiencies and localized parts remanufacturing will gradually stabilize availability. Regional differentiation will persist, with East Malaysia benefiting from logistics improvements and service network densification.
Major Players
- Kubota Malaysia
- Yanmar Malaysia
- ISEKI & Co., Ltd.
- Mitsubishi Agricultural Machinery
- Mahindra & Mahindra Malaysia
- Sime Darby Industrial
- Tractors Malaysia
- UMW Equipment
- TCIM
- Hup Heng Machinery
- Kian Ho Machinery
- MFM Machinery
- Wah Seng Agricultural Machinery
- Guan Seng Machinery
- Agro Machinery Sdn Bhd
Key Target Audience
- Plantation estate operators
- Smallholder farmer cooperatives
- Independent farm contractors
- Equipment dealers and refurbishers
- Agricultural finance providers
- Importers and logistics operators
- Investments and venture capital firms
- Ministry of Agriculture and Food Security Malaysia
Research Methodology
Step 1: Identification of Key Variables
Demand drivers, equipment age profiles, refurbishment depth, service coverage, and channel accessibility were defined as primary variables. Regional logistics constraints and regulatory compliance factors were mapped to usage patterns. Parts availability and financing access were incorporated as operational constraints shaping adoption.
Step 2: Market Analysis and Construction
Transaction flows were reconstructed across dealer networks, digital platforms, and refurbishment yards. Import clearance processes and service hub density were analyzed to infer utilization continuity. Channel performance indicators were synthesized to model availability cycles across regions.
Step 3: Hypothesis Validation and Expert Consultation
Hypotheses on refurbishment standardization, digital adoption, and financing penetration were validated through consultations with dealers, service managers, logistics coordinators, and cooperative leaders. Compliance practices and service bottlenecks were cross-checked against operational records.
Step 4: Research Synthesis and Final Output
Insights were consolidated into segment narratives, competitive positioning, and operational constraints. Triangulation across channels ensured consistency of findings. Implications for adoption pathways and service ecosystem evolution were articulated for strategic planning.
- Executive Summary
- Research Methodology (Market Definitions and classification of used tractors by age and horsepower, Dealer and auction channel audits across Peninsular Malaysia and East Malaysia, Price tracking of used tractor listings across digital marketplaces and classifieds, Primary interviews with plantation estates and smallholder cooperatives, Import reconditioning yard assessments and refurbishment cost benchmarking, Review of financing schemes and hire-purchase penetration in farm machinery, Regulatory review of AP permits and road transport compliance for used machinery)
- Definition and Scope
- Market evolution
- Usage and care pathways
- Ecosystem structure
- Supply chain and channel structure
- Regulatory environment

- Growth Drivers
Rising mechanization in smallholder and mid-sized farms
Cost advantage of used equipment versus new imports
Expansion of oil palm replanting cycles driving equipment turnover
Availability of Japanese reconditioned tractors with reliable performance
Access to hire-purchase and agro-financing schemes for used machinery
Government incentives for farm productivity and mechanization - Challenges
Inconsistent quality and refurbishment standards across dealers
Limited availability of spare parts for older models
Financing constraints for informal smallholder buyers
Regulatory complexity for import permits and compliance
High logistics and inland transport costs to East Malaysia
Perceived reliability risks of high-hour used equipment - Opportunities
Growth of certified refurbished tractor programs
Digital platforms enabling price transparency and wider reach
Bundled service and maintenance contracts for used equipment
Fleet replacement cycles in large plantations releasing quality stock
Localization of parts remanufacturing and aftermarket services
Partnerships with cooperatives for aggregated procurement - Trends
Shift toward compact and mid-HP tractors for small plots
Rising preference for Japanese-origin used tractors
Dealer-led refurbishment and warranty offerings
Increased online discovery with offline inspection closures
Demand for attachments bundled with tractor sales
Seasonal price volatility aligned with planting cycles - Government Regulations
- SWOT Analysis
- Stakeholder and Ecosystem Analysis
- Porter’s Five Forces Analysis
- Competition Intensity and Ecosystem Mapping
- By Value, 2020–2025
- By Volume, 2020–2025
- By Installed Base, 2020–2025
- By Average Selling Price, 2020–2025
- By Tractor Type (in Value %)
Two-wheel tractors
Compact tractors
Utility tractors
Row-crop tractors
Orchard and specialty tractors - By Power Output (in Value %)
Below 30 HP
30–50 HP
51–75 HP
76–100 HP
Above 100 HP - By End Use Application (in Value %)
Oil palm plantations
Rubber plantations
Paddy farming
Vegetable and horticulture farms
Livestock and mixed farming - By Source of Supply (in Value %)
Domestic fleet replacements
Import of used tractors from Japan
Import of used tractors from China
Import of used tractors from Europe
Corporate and government fleet disposals - By Sales Channel (in Value %)
Authorized used equipment dealers
Independent traders and refurbishers
Online marketplaces and classifieds
Auction houses
Direct farmer-to-farmer sales - By Geography (in Value %)
Central region
Northern region
Southern region
East Coast region
Sabah
Sarawak
- Market structure and competitive positioning
Market share snapshot of major players - Cross Comparison Parameters (price competitiveness, refurbishment quality, warranty coverage, inventory depth, financing partnerships, parts availability, geographic reach, after-sales network)
- SWOT Analysis of Key Players
- Pricing and Commercial Model Benchmarketing
- Detailed Profiles of Major Companies
Kubota Malaysia
Yanmar Malaysia
ISEKI & Co., Ltd.
Mitsubishi Agricultural Machinery
Mahindra & Mahindra Malaysia
Sime Darby Industrial
Tractors Malaysia
UMW Equipment
TCIM (Tan Chong Industrial Machinery)
Hup Heng Machinery
Kian Ho Machinery
MFM Machinery
Syarikat Jentera Pertanian Wah Seng
Guan Seng Machinery
Agro Machinery Sdn Bhd
- Demand and utilization drivers
- Procurement and tender dynamics
- Buying criteria and vendor selection
- Budget allocation and financing preferences
- Implementation barriers and risk factors
- Post-purchase service expectations
- By Value, 2026–2035
- By Volume, 2026–2035
- By Installed Base, 2026–2035
- By Average Selling Price, 2026–2035


 Request a Sample
 Ask for Customization
 Get a Quote
 Enquire Now