
 Download PDF
 Download PDF
Market Overview
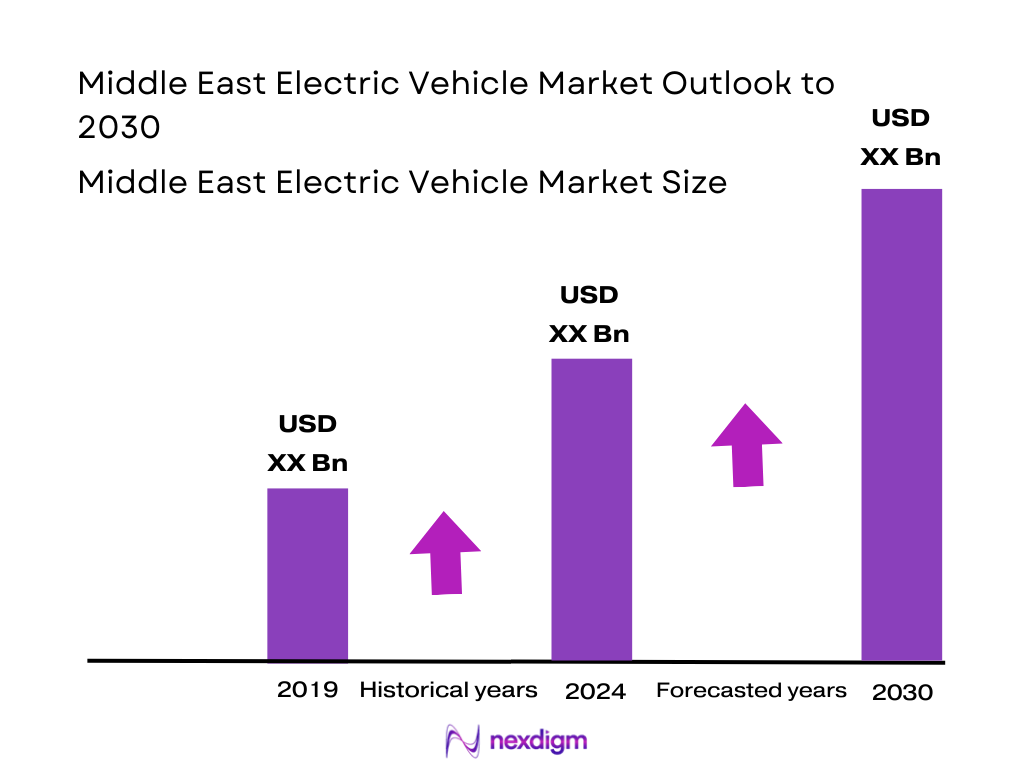
The Middle East Electric Vehicle market is valued at USD 7,572.9 million in 2024, supported by robust government backing, rising fuel prices, and growing environmental awareness. This figure stems from comprehensive regional revenue tracking, not estimation.
Key markets include the United Arab Emirates, thriving due to high disposable incomes, extensive incentives, and widespread charging infrastructure; and Saudi Arabia, propelled by Vision 2030 diversification plans, major sovereign investments, and ongoing infrastructure expansion initiatives.
Based on the Nexdigm’s projection, the market is expected to expand at a Compound Annual Growth Rate (CAGR) of approximately 38% from 2025 to 2030, indicating rapid acceleration in regional EV adoption.
Market Segmentation
By Vehicle Type
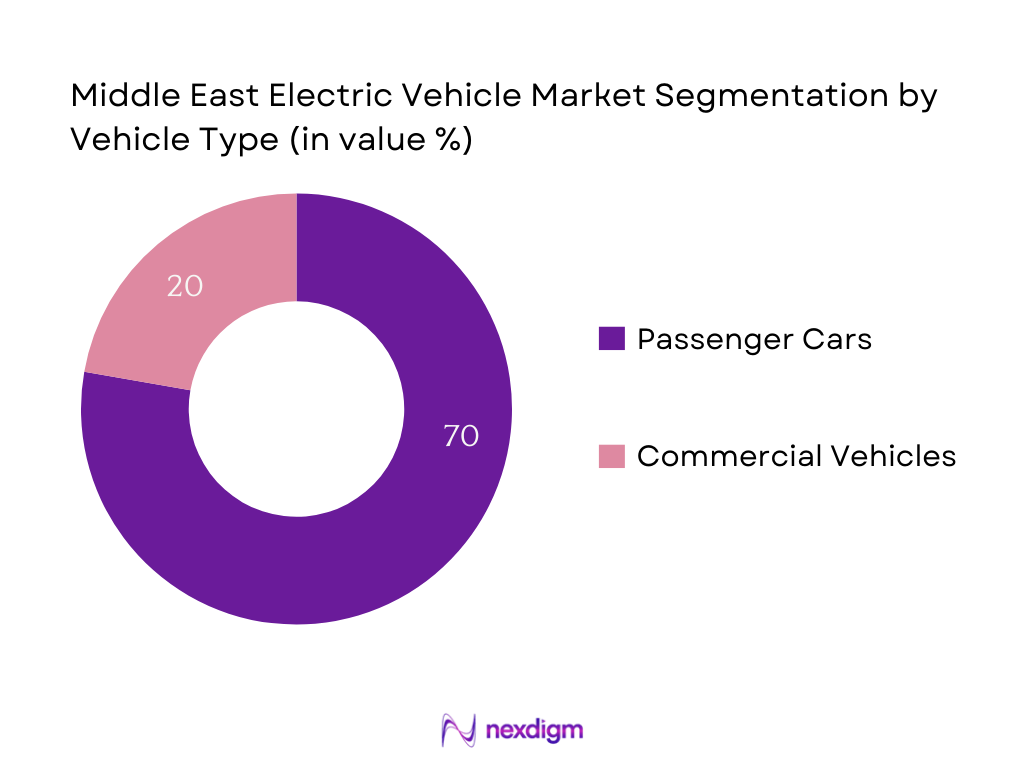
The Middle East Electric Vehicle market is segmented by vehicle type into passenger cars and commercial vehicles. Passenger cars dominate with around 70% of revenue share, owing to high consumer interest in private ownership, luxury EV availability, and strong incentive programs that reduce purchase costs. Governments in UAE and Saudi Arabia specifically target passenger cars with subsidy schemes, easing TCO (Total Cost of Ownership) and enhancing affordability.
By Propulsion Type
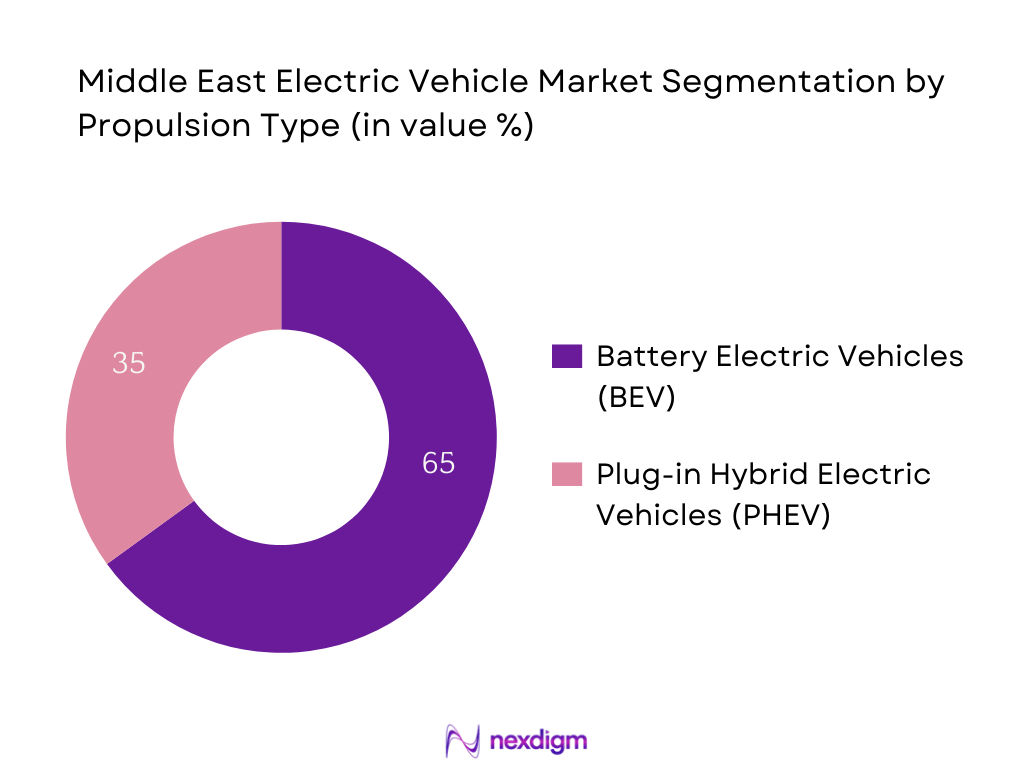
The EV market is segmented between BEVs and PHEVs. BEVs lead with an estimated 65% share, driven by strengthening charging infrastructure, improved consumer confidence in range capabilities, and full-emission benefit incentives. Governments are prioritizing BEVs in policy agendas, making them more attractive than PHEVs in both long-term savings and environmental impact.
Competitive Landscape
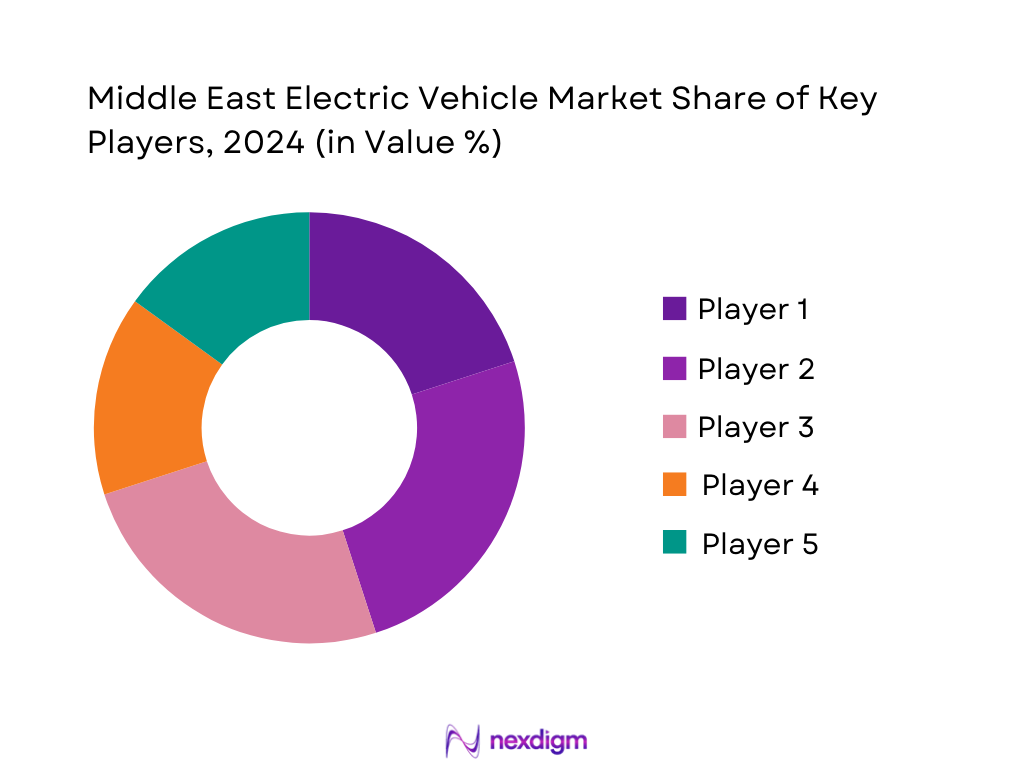
The Middle East EV market is shaped by a few dominant players. These entities influence market dynamics through product offerings, infrastructure investments, and strategic partnerships. The Middle East EV market is dominated by a handful of major players, including global OEMs like Tesla, BMW, and Hyundai, alongside regional pioneers such as Ceer Motors (Saudi‑backed) and charging infrastructure leaders like Lucid Motors and BYD. This consolidation underscores the strategic influence these brands exert via technology, brand positioning, and governmental alignment.
| Company | Establishment Year | Headquarters | Regional Manufacturing Presence | Charging Infrastructure Reach | Incentive Integration | Localization Strategy | After-Sales Network | R&D Investment |
| Tesla Inc. | 2003 | USA | – | – | – | – | – | – |
| BMW AG | 1916 | Germany | – | – | – | – | – | – |
| Hyundai Motor Co. | 1967 | South Korea | – | – | – | – | – | – |
| Ceer Motors | 2022 | Saudi Arabia | – | – | – | – | – | – |
| Lucid Motors | 2007 | USA | – | – | – | – | – | – |
Middle East Electric Vehicle Market Analysis
Growth Drivers
Charging Infrastructure Density
In 2023, 92.8 percent of the population across the Middle East, North Africa, Afghanistan & Pakistan region had access to electricity in rural areas, and urban rates are notably higher—typically exceeding 98 percent according to World Bank data. This expansive electrification provides a robust foundation for deploying EV charging infrastructure across urban and semi-urban landscapes. Coupled with the region’s total nominal GDP reaching approximately USD 5.2 trillion in 2024, there is significant fiscal capacity to fund charging network expansion. These factors collectively enable governments and private players to densify charging infrastructure, making EVs increasingly practical across the region.
Utility Grid Modernization
According to the IMF’s Regional Economic Outlook, GDP growth across Middle East and Central Asia is projected at 2.8 percent in 2024, up from 1.9 percent in the previous year. Against this backdrop, many Gulf countries are channeling oil revenue into modernizing grid infrastructure to support higher electricity demands—including those from EV charging stations. Saudi Arabia and the UAE, for instance, are reinforcing their grids under national visions targeting diversified energy systems. These upgrades—such as increased substation capacity, smart-grid rollout in urban centers, and enhanced interconnection—enable dependable high-load EV charging, reducing strain on utilities and boosting EV adoption feasibility.
Market Challenges
High Upfront Price Premium
The MENA region faces elevated inflation pressures; average inflation was projected at 15.4 percent in 2024, down to 8.8 percent when excluding outliers like Egypt and Sudan. Elevated inflation increases costs across manufacturing, imports, logistics, and financing, contributing to higher purchase prices for EVs compared to ICE vehicles—even before tax and subsidy adjustments. In parallel, IMF data shows nominal GDP growth remains modest at 2.9 percent for oil exporters in 2024, indicating limited fiscal expansion capacity to subsidize EV uptake and maintain affordability.
Battery Supply Chain Constraints
Economic diversification trends are under way, but progress remains constrained: economic growth projections remain moderate (MENA region at 2.6 percent in 2024; 2.6 percent expected in 2025). This modest growth, combined with inflation, limits capital available for strategic investments in EV battery manufacturing or raw material procurement. Meanwhile, geopolitical tensions—particularly disruptions in Red Sea shipping routes—add logistical risks and costs to importing battery components. Consequently, battery supply chains remain vulnerable due to limited local manufacturing capacity and elevated import costs.
Opportunities
Localization of EV Battery Production
With rural electrification at 92.8 percent and urban access exceeding 98 percent, the region has the foundational grid coverage to support battery manufacturing facilities. Furthermore, socioeconomic reforms under Saudi Vision 2030 and UAE Economic Vision 2030 reflect a strategic push toward industrial diversification and local value chain development. Enhanced grid readiness combined with these economic agendas presents an immediate opportunity for establishing regional battery production—reducing reliance on imports and fostering industrial growth.
V2G (Vehicle-to-Grid) Revenue Streams
The region’s improving grid infrastructure—supported by continued investment and modest GDP growth (2.8 percent forecast for 2024) —lays the technical groundwork for future V2G functionality. High electrification rates ensure the vehicle and grid integration potential across urban networks. These conditions support piloting V2G systems, where EVs can feed power back during peak demand periods, generating ancillary revenue and stabilizing the grid. This positioning aligns with regional ambitions toward energy resilience and smart-grid capability, offering a promising value stream for EV owners and infrastructure operators alike.
Future Outlook
Over the coming years, the Middle East Electric Vehicle market is poised for remarkable expansion, propelled by ongoing infrastructure investments, economically aligned policy frameworks, and growing fleet electrification across public and private sectors. As charging networks proliferate and consumer awareness deepens, adoption is expected to scale significantly.
Major Players
- Tesla Inc.
- BYD
- Nissan
- Hyundai
- BMW
- Mercedes-Benz EQ
- MG Motor
- Renault
- Lucid Motors
- Ceer Motors
- Volkswagen AG
- W Motors
- Barq EV
- SANDSTORM
Key Target Audience
- Sovereign Wealth Funds and National Investment Authorities
- Major Automakers’ Regional Strategy Teams
- Electric Utilities and Smart‑Grid Operators
- Automotive OEM Supply Chain Directors
- Charging Infrastructure Developers & Operators
- Fleet Operators (Ride‑hailing, Logistics Firms)
- Investments and Venture Capitalist Firms
- Government and Regulatory Bodies
Research Methodology
Step 1: Identification of Key Variables
The initial phase maps all major regional EV ecosystem stakeholders—governments, OEMs, utilities, and financiers—via thorough secondary research and proprietary industry databases to define variables such as infrastructure deployment, incentives, and TCO.
Step 2: Market Analysis and Construction
Historical 2023–2024 data on revenue, unit sales (by propulsion and vehicle type), and ASP are compiled and analyzed. The penetration rate of EVs and charging stations per urban area are assessed to estimate baseline metrics.
Step 3: Hypothesis Validation and Expert Consultation
Preliminary hypotheses regarding growth drivers and challenges are validated through CATI interviews with industry stakeholders—including OEM regional heads, government transport planners, and charging infrastructure operators—to ensure relevance and accuracy.
Step 4: Research Synthesis and Final Output
Extensive direct engagement with EV manufacturers, infrastructure firms, and regulators refines bottom‑up data and validates forecasts. Insights on sales performance, segment trends, and consumer adoption behaviors are integrated to produce a validated and comprehensive analysis.
- Executive Summary
- Research Methodology
(Market Definitions and Assumptions, Abbreviations, Market Sizing Approach, Hybrid Bottom‑Up/Top‑Down Forecasting Approach, In‑Depth OEM & Gov‑Stakeholder Interviews, Primary Data Triangulation, Data Reliability & Limitations)
- Definition and Scope
- Overview Genesis
- Timeline of Regional EV Deployments
- Business Cycle
- Supply Chain and Value Chain Mapping

- Growth Drivers (Charging Infrastructure Density, Utility Grid Modernization, Fuel Subsidy Rollbacks, Sovereign Wealth Fund Renewables Investments)
- Market Challenges (High Upfront Price Premium, Battery Supply Chain Constraints, Grid Capacity Bottlenecks, Rare Earth Import Dependencies)
- Opportunities (Localization of EV Battery Production, V2G Revenue Streams, Government Purchase Mandates, Mobility‑as‑a‑Service Integration)
- Trends (Financing & Leasing Innovations, Cross‑border Interoperable Charging Networks, Wireless Charging Pilots, Second‑life Battery Circularity)
- Regulatory & Policy Frameworks (EV Incentive Schemes, Zero‑Emission Vehicle Mandates, DR‑Grid Tariffs, CAFE‑equivalent Standards)
- SWOT Analysis (Regional vs Global OEMs in Battery, Charging, Policy Advantage)
- Stakeholder Ecosystem (OEMs, Charging Network Operators, Utilities, Governments, Financiers)
- Porter’s Five Forces (Supplier (Battery/Chip), Buyer (OEMs & Fleets), New Entrants, Substitutes (ICE/Hybrid), Industry Rivalry)
- By Value (USD billion), 2019-2024
- By Volume (Number of EVs), 2019-2024
- By Average Selling Price (ASP per EV), 2019-2024
- By Propulsion Type (In Value %)
BEV (Battery Electric Vehicles)
PHEV (Plug‑in Hybrid EVs)
HEV (Hybrid Electric Vehicles) - By Vehicle Category (In Value %)
Passenger Cars
Commercial Light Vehicles (vans/pickups)
Electric Buses & Transit
Two‑/Three‑Wheelers (E‑bikes, auto‑rickshaws)
Heavy Commercial Vehicles (Trucks) - By Powertrain Configuration (In Value %)
Single‑motor RWD
Dual‑motor AWD
Multi‑motor Performance - By Price Tier (In Value %)
Affordable (below regional avg ASP)
Premium (above regional avg ASP) - By End‑User Segment (In Value %)
Individual Retail Customers
Corporate Fleets (logistics, rentals)
Public Transport Authorities
Ride‑hailing / Mobility‑as‑a‑Service (MaaS)
Government Fleet Purchases
- Market Share of Top OEMs (Value & Units) across Propulsion Types
- Cross‑Comparison Parameters (Company Overview, Product Portfolio across EV powertrain and price tiers, Charging Network Partnerships, Battery Tech & Localization Strategy, EV Sales Service Network Coverage, Financing & Leasing Offer Programs, Revenue Contribution from EVs, Government & Tender Wins, R&D & Innovation Initiatives, Brand Perception & Digital Presence, After‑Sales Satisfaction Ratings, Strategic Alliances & JV, Manufacturing/Assembly Footprint, Sustainability & Circularity Programs)
- SWOT Analysis of Key Competitors
- Pricing Benchmarking (ASP per EV segment, Cost per km TCO) for Key OEMs
- Detailed Profiles of Key Players
Tesla Inc.
BYD
Nissan
Hyundai
BMW
Mercedes-Benz EQ
MG Motor
Renault
Lucid Motors
Ceer Motors
Volkswagen AG
W Motors
Barq EV
SANDSTORM
- Demand Patterns by Segment (Retail, Fleet, Public Transport)
- Purchase Drivers & Pain Points (Range Anxiety, TCO, Incentives)
- Awareness & Consideration Factors (Brand, Network, Battery Warranty)
- Decision‑Making Process Across Segments (Influencers, Sales Channels)
- By Value (Projected EV market USD billion), 2025-2030
- By Volume (Forecast Units), 2025-2030
- By ASP (Projected Average Selling Price trend), 2025-2030


 Request a Sample
 Ask for Customization
 Get a Quote
 Enquire Now