
 Download PDF
 Download PDF
Market Overview
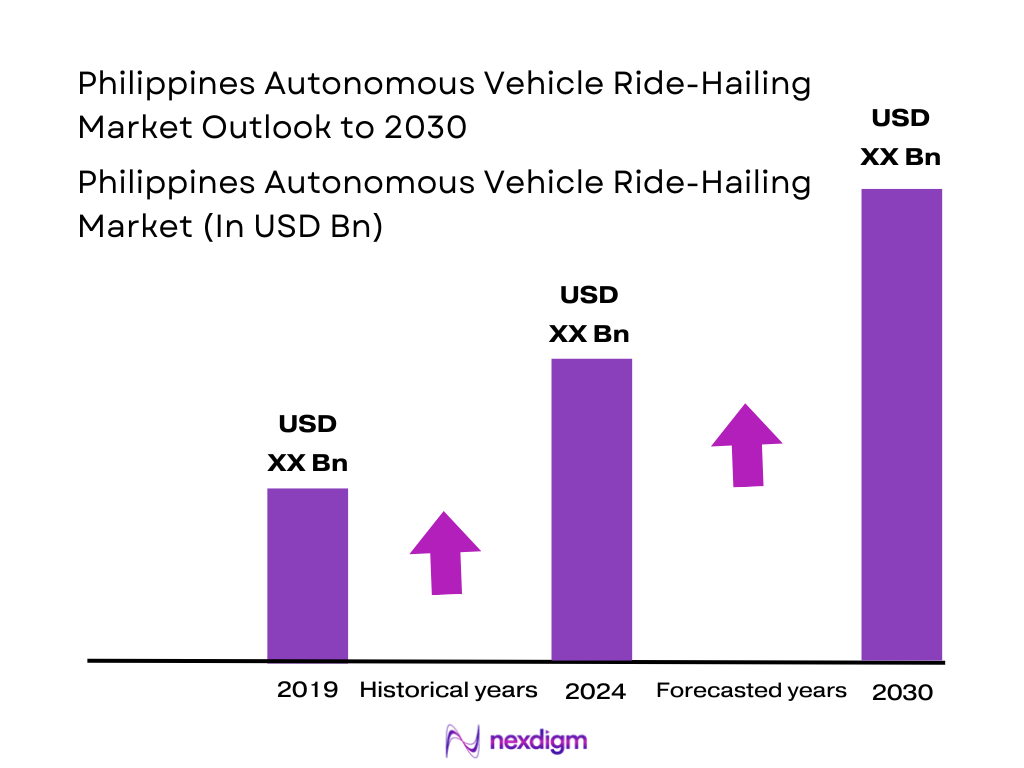
The Philippines autonomous vehicle ride-hailing market is anchored in a rapidly growing app-based mobility ecosystem. The ride-hailing and taxi market is forecast by Nexdigm to generate about USD ~ million in revenue, while indicates a market volume of roughly USD 820 million within the same forecast window, implying earlier-period revenue near USD 670 million for the country. On this base, this report models the Philippines autonomous vehicle ride-hailing market at approximately USD 7 million.
Metro Manila, Cebu, Davao and the Clark–Angeles smart city belt collectively dominate the Philippines autonomous vehicle ride-hailing opportunity. Clark has emerged as the country’s flagship autonomous mobility testbed through the first publicly accessible self-driving bus service using a Smart Mobility Operation Cloud platform, backed by BCDA, NEDO and Japanese technology partners. These locations combine high smartphone penetration, congestion, and progressive local governments favourable for AV pilots.
Market Segmentation
By Service Model
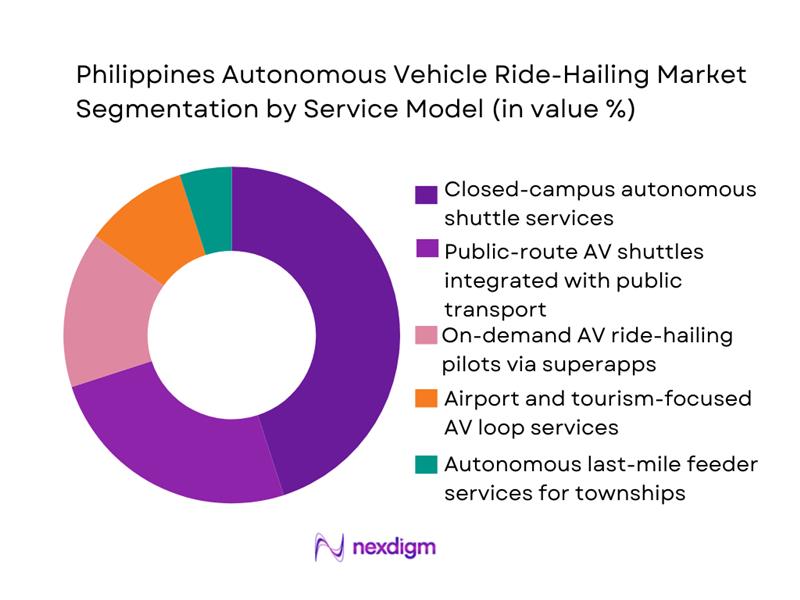
The Philippines autonomous vehicle ride-hailing market is segmented by service model into closed-campus autonomous shuttle services, public-route AV shuttles linked with public transport, on-demand AV ride-hailing pilots via superapps, airport and tourism AV loops, and autonomous last-mile feeder services for townships. Closed-campus autonomous shuttle services currently hold a dominant share because early deployments are concentrated in controlled environments such as the Clark smart city corridor, where self-driving buses run on fixed routes under the Smart Mobility Operation Cloud platform with clear governance frameworks and defined operational design domains. These deployments minimise regulatory risk, simplify safety case preparation and enable predictable ridership from employees, residents and visitors, making them the most commercially mature AV ride-hailing use case in the country.
By Vehicle Type
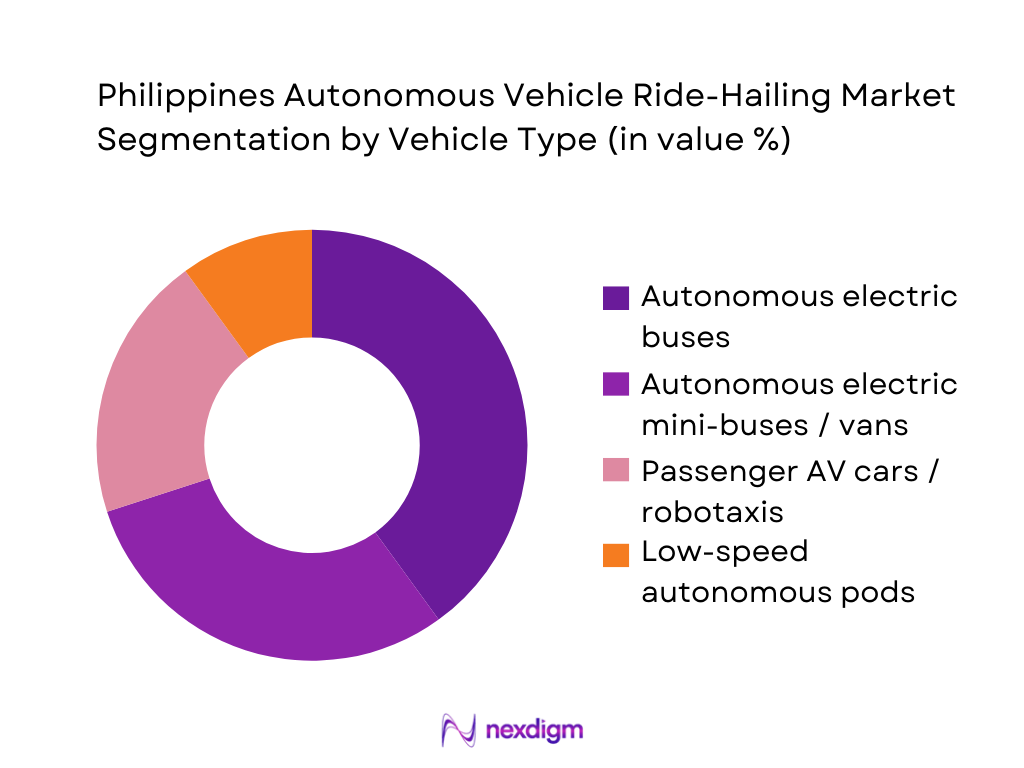
The Philippines autonomous vehicle ride-hailing market is segmented by vehicle type into autonomous electric buses, autonomous electric mini-buses and vans, passenger AV cars and robotaxis, and low-speed autonomous pods. Autonomous electric buses hold the leading share because the country’s first operational AV services are bus-based, focused on moving larger passenger volumes efficiently within the Clark New Clark City corridor under a Japanese–Philippines demonstration project that uses cloud-based fleet control and V2X-capable infrastructure. These vehicles align well with public transport modernisation, support integration into existing smart city plans and benefit from international technology financing, while robotaxis and pods remain in earlier-stage evaluation, thus limiting their current revenue contribution.
Competitive Landscape
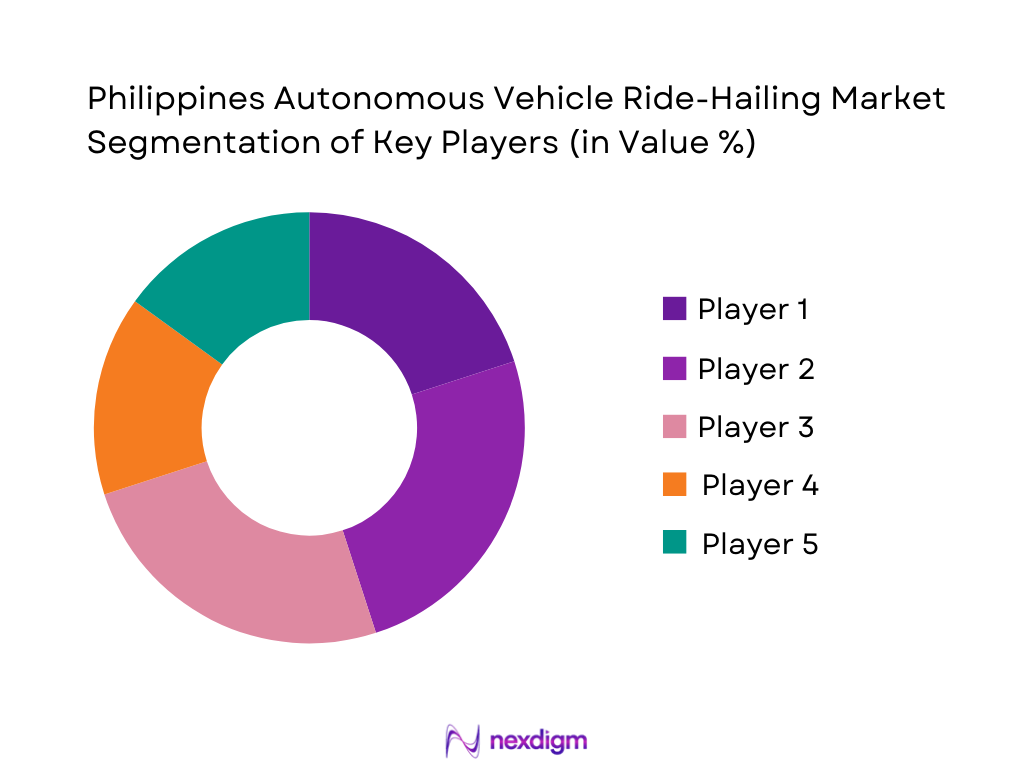
The Philippines autonomous vehicle ride-hailing market is shaped by a small but influential set of players spanning global mobility platforms, AV technology specialists and local public-sector consortia. The broader ride-hailing space is dominated by superapps such as Grab, which is actively partnering with autonomous technology companies across Southeast Asia to explore AV use in shuttles, buses and cars. LinkedIn Grab ADAS & Autonomous Vehicle International In parallel, the Clark autonomous bus project led by BCDA, NEDO and Japanese OEM and systems partners has established the country’s first recurring AV shuttle service, positioning the consortium as a reference operator for future deployments.
| Company / Consortium | Establishment Year | Headquarters | Role in Philippines AV Ride-Hailing Ecosystem | Primary Vehicle Platform | AV Focus Level (L3/L4) | Key Pilot / Focus Area in Philippines | Core Capability in AV Stack | Strategic Partner Linkages in SEA AV Space |
| BCDA–NEDO–Mitsubishi Smart Mobility Consortium | 1980 | Tokyo / Manila / Clark | ~ | ~ | ~ | ~ | ~ | ~ |
| Grab Holdings | 2012 | Singapore | ~ | ~ | ~ | ~ | ~ | ~ |
| Toyota Mobility Foundation / Toyota Motor Philippines (TMF cluster) | 2014 | Tokyo / Santa Rosa | ~ | ~ | ~ | ~ | ~ | ~ |
| WeRide | 2017 | Guangzhou | ~ | ~ | ~ | ~ | ~ | ~ |
| May Mobility | 2017 | Ann Arbor, USA | ~ | ~ | ~ | ~ | ~ | ~ |
Philippines Autonomous Vehicle Ride-Hailing Market Analysis
Growth Drivers
Urban congestion metrics
Metro Manila’s density and traffic pressure make it a natural sandbox for autonomous ride-hailing. The official population count stands at 112,729,484 residents for the Philippines, based on the latest census declaration by the President and PSA. World Bank data shows that 49% of the population now lives in urban areas, intensifying mobility demand. In 2023, Metro Manila alone recorded 85,954 road crashes with 352 fatalities according to MMDA. These figures underline an overburdened road network where average corridor speeds on EDSA and C5 frequently drop to near-gridlock during peak. For autonomous ride-hailing platforms, such congestion creates strong value propositions around optimized routing, platooning in dedicated lanes, and dynamic pooling—particularly in dense business districts like Makati, Bonifacio Global City, and Ortigas, where daily commuter inflows from surrounding regions contribute heavily to traffic volumes.
EV adoption
The Philippines is coupling AV ambitions with aggressive electrification, creating a dual upside for autonomous electric fleets. The Electric Vehicle Industry Development Act (EVIDA) has been reinforced by a zero customs duty on many electric vehicles, cutting import tariffs that previously ranged from 5–30% down to 0 for qualifying models (Reuters / DOF policy). Industry data citing Land Transportation Office (LTO) records shows that two- and three-wheeled EV registrations surged to 43,441 units in one recent year, from just 172 the previous year, while total EV registrations reached 29,715 units in the first seven months of the next year (Philippine News Agency citing LTO/EVAP). World Bank notes the Philippine economy is still expanding at around 5.9% GDP growth, supporting rising household incomes and corporate demand for cleaner fleets. For AV ride-hailing, this combination of policy incentives, fast-growing EV stock, and macroeconomic resilience encourages operators to design autonomous fleets around battery-electric platforms, particularly in urban corridors and airport shuttle routes where load factors are high and emissions-reduction goals are explicit.
Market Challenges
Road complexity
The Philippines’ road environment is highly heterogeneous: narrow barangay streets, tricycle-dominated secondary roads, and mixed-traffic national highways intersect within dense cities. National population has officially reached 112.73 million, while Metro Manila is part of a larger urban agglomeration of around 24.7 million people, making it one of the world’s largest megacities (UN urbanization estimates cited in media). MMDA data shows 85,954 recorded road crash incidents in 2023 in NCR alone, up sharply from 58,447 cases in 2021. For AV ride-hailing, this means algorithms must handle lane-less driving, unmarked intersections, frequent pedestrian encroachment, and very high motorcycle volumes—conditions more complex than those in many Western benchmark cities and requiring country-specific perception and planning models.
Regulatory delays
While the Philippines is actively modernizing transport policy, the regulatory environment for autonomous vehicles is still nascent and fragmented across agencies such as DOTr, LTFRB, LTO, and local governments. World Bank governance indicators highlight challenges: the country’s regulatory quality index score remains below that of several regional peers, with moderate improvements but continued constraints on policy implementation capacity (World Bank Worldwide Governance Indicators). At the same time, World Bank’s latest update projects GDP growth of 5.9%, but underscores the importance of “containing inflation” and improving public investment execution. These macro signals mean that while there is economic headroom for AV pilots, operators must factor in protracted approval cycles for new mobility models, overlapping franchises with existing transport modes, and city-by-city permitting—slowing full-scale deployment of autonomous ride-hailing fleets.
Market Opportunities
Tourism AV mobility
Tourism offers a powerful early-adoption wedge for autonomous ride-hailing in clearly bounded corridors such as airports, resort districts, and island gateways. The Department of Tourism reports over 5.45 million international visitor arrivals in 2023, exceeding the government’s target of 4.8 million, with visitor receipts reaching PHP 482.54 billion. International and domestic tourism flows concentrate around Manila, Cebu, Bohol, Palawan, Boracay, and Clark—locations with airports, defined hotel clusters, and often limited last-mile options. AV ride-hailing fleets can target airport–hotel shuttles, point-to-point transfers within tourism estates, and guided route services in smart tourism zones, leveraging existing demand peaks without displacing essential local public transport.
Smart campuses
Smart campuses—economic zones, IT parks, and large universities—offer highly controllable environments where AV ride-hailing can scale before moving onto open roads. The IT-BPM industry alone supported 1.7 million jobs in 2023 and 1.82 million jobs in 2024, according to official statements citing industry roadmaps. These workers are concentrated in PEZA-registered IT parks and buildings across Metro Manila, Cebu, and emerging hubs like Iloilo and Davao; PEZA notes a continuous pipeline of new IT park and center applications in NCR. At the same time, a CHEd factsheet identifies over 2,400 higher-education institutions nationwide, many clustered in large urban centers (CHED 2023 facts via FOI). For AV platforms, these dense campus environments—with predictable peak flows, controlled access, and private road segments—are ideal for autonomous shuttles, late-night safety rides, and on-demand circulators, enabling robust operational data collection and safety validation.
Future Outlook
Over the coming years, the Philippines autonomous vehicle ride-hailing market is expected to expand rapidly from its pilot-scale base as superapps, technology providers and public agencies align on safety frameworks and commercial models. The broader ride-hailing and taxi segment is projected to continue growing toward the USD 1 billion mark, supported by rising urbanisation, smartphone penetration and digital payment adoption. In parallel, global robotaxi markets are forecast to grow from low single-digit billions to more than USD 100 billion by the end of the decade at very high compound growth. This creates a strong technology and investment pipeline that the Philippines can leverage through carefully scaled AV pilots in Clark, Metro Manila and priority tourism or airport corridors.
Major Players
- Grab AV Mobility Initiatives
- Toyota Mobility Foundation (TMF) AV Projects
- Hyundai–A1A Smart Mobility Pilots
- Globe Telecom / 5G AV Connectivity Partners
- Nissan Intelligent Mobility (IM) AV Pilots
- Local Government Unit Smart Shuttle Operators (e.g., Clark–BCDA)
- PATEO / Baidu Apollo Partnerships in ASEAN
- Waymo (Scenario Testing Relevance for SEA)
- Cruise (Autonomous Ride-Hailing Technology Reference)
- May Mobility (Campus Shuttle Focus)
- Beep Transport Systems AV Transition Plans
- ELECTROMobility Networks for AV Infrastructure
- EasyMile (Autonomous Shuttle Deployments)
- NUConnect & DICT Smart Mobility Programs
- Local AV Startups / Simulation & HD Mapping Providers
Key Target Audience
- Global and regional mobility platform operators
- Automotive OEMs and autonomous driving technology providers
- Public transport agencies and city mobility planners
- Government and regulatory bodies
- Investment and venture capitalist firms
- Telecommunication and cloud infrastructure providers
- Airport, seaport and tourism zone operators
- Large corporate campus, business park and township developers
Research Methodology
Step 1: Identification of Key Variables
The initial phase involves constructing an ecosystem map for the Philippines autonomous vehicle ride-hailing market, covering regulators, ride-hailing platforms, AV technology providers, telecom operators, mapping companies, fleet operators and smart-city authorities. Extensive desk research is conducted using secondary and proprietary databases, including Statista, OECD/ITF materials, academic literature and government releases. The goal is to identify critical variables such as ride-hailing revenue base, AV pilot scale, connectivity indicators and regulatory readiness that influence AV ride-hailing dynamics.
Step 2: Market Analysis and Construction
In this phase, historical and forecast data on Philippines ride-hailing and taxi revenue, user base and app penetration are compiled, primarily from Statista-derived sources and recognised industry reports. These data are combined with global robotaxi and AV market trajectories to construct a bottom-up model for the autonomous ride-hailing subsegment. The analysis includes inferring AV penetration into specific service models (campus shuttles, tourism loops, pilot robotaxis) and ensuring that derived revenues remain consistent with the broader smart mobility and ride-hailing opportunity for the country.
Step 3: Hypothesis Validation and Expert Consultation
Market hypotheses around AV penetration rates, preferred vehicle platforms, city-level deployment priorities and realistic CAGR ranges are validated through structured interviews and consultations with industry practitioners where possible. These include stakeholders from ride-hailing platforms, public transport agencies, smart-city programme offices, AV technology vendors and telecom operators across Southeast Asia. Input from these experts helps refine assumptions on operational design domains, revenue yield per vehicle, utilisation levels and likely timelines for scaling beyond pilot deployments, thereby strengthening confidence in the Philippines autonomous ride-hailing projections.
Step 4: Research Synthesis and Final Output
The final phase involves synthesising quantitative modelling and qualitative insights into an integrated market narrative and forecast. Scenario analysis is applied to test sensitivity around key factors such as regulatory acceleration, global AV technology cost curves and infrastructure readiness. The derived market size for the Philippines autonomous vehicle ride-hailing market and the associated CAGR are cross-checked against global robotaxi benchmarks and comparable emerging-market. This ensures that the final outputs present a coherent, transparent and defensible view of how autonomous ride-hailing can evolve within the Philippines mobility ecosystem.
- Executive Summary
- Research Methodology (Market Definitions, Abbreviations & Technical Terminology, Market Sizing Approach (Top-Down + Bottom-Up), Consolidated Research Approach, AV Pilot Evaluations & Readiness Index Assessment, Primary Interviews with OEMs, Mobility Platforms, Regulators & Tech Providers, Limitations & Future Conclusions)
- Definition & Scope
- Market Genesis (Evolution of AV Pilots, Smart Mobility Programs, Automation Levels)
- Timeline of Key Ecosystem Movements (Testing permits, regulatory advisories, tech partnerships)
- Business Cycle Analysis
- Supply Chain & Value Chain Mapping (Sensors, Software Stack, AV Platforms, Mapping & Simulation, Fleet Ops)
- Philippines AV Readiness Assessment (Digital infrastructure, 5G, mapping depth, traffic complexity)

- Growth Drivers
Urban congestion metrics
EV adoption
smart city push
5G rollouts - Market Challenges
Road complexity
regulatory delays
data privacy
localization challenges - Opportunities
Tourism AV mobility
smart campuses
AI-enabled fleet orchestration - Trends
AV-EV convergence
MaaS integration
remote tele-operations
edge compute architecture - Government Regulations & Policy Landscape
DOTr
LTFRB
DICT guidelines for AVs - Stakeholder Ecosystem Mapping
- Porter’s Five Forces
- By Value, 2019-2024
- By Volume (Fleet Count, Passenger Rides), 2019-2024
- By Average Ride Cost / Dynamic Pricing Bands, 2019-2024
- By Automation Level (in Value %)
L2+ Urban Driver Assist Systems
L3 Conditional Automation Fleets
L4 Closed-Campus Autonomous Shuttles
L4 Urban Robo-Taxi Services
Autonomous Delivery Pods Integrated with Ride-Hailing - By Vehicle Type (in Value %)
Passenger Cars (EV-AV Integrated Platforms)
Autonomous Shuttles (Fixed-Route)
MPVs / Mini-Vans
Purpose-Built Autonomous Pods
Two-/Three-Wheeler Low-Speed Autonomous Systems - By Service Model (in Value %)
On-Demand Autonomous Ride-Hailing
Scheduled Autonomous Shuttle Services
Subscription-Based AV Mobility Plans
Corporate / Campus Autonomous Fleet Services
Airport & Tourism AV Mobility - By Technology Stack Provider (in Value %)
Sensor-Dominant (LiDAR + Radar + Camera)
Vision-Dominant Systems
HD Mapping & Localization Providers
V2X-Enabled Autonomous Platforms
AI-Driven Fleet Management Software Providers - By Region (in Value %)
Metro Manila
Cebu
Davao
Clark–Angeles Smart City Belt
Other Urban Growth Corridors
- Market Share of Major Players (Value/Volume)
- Market Share by AV Level (L2+ / L3 / L4)
- Cross-Comparison Parameters (AV Technology Readiness Level, Sensor Architecture (LiDAR Radar Camera Mix), HD Mapping & Localization Depth, Operational Design Domain (ODD) Coverage, Fleet Operations & Tele-Operations Capability, Software Stack Ownership (Proprietary vs. Integrated), Safety Performance Metrics (Disengagement KPIs), Commercial Deployment Partnerships (City/Fleet/Telecom)
- SWOT Analysis of Key Players
- Detailed Profiles of Competitors
Grab AV Mobility Initiatives
Toyota Mobility Foundation (TMF) AV Projects
Hyundai-A1A Smart Mobility Pilots
Globe Telecom / 5G AV Connectivity Partners
Nissan Intelligent Mobility (IM) AV Pilots
Local Government Unit Smart Shuttle Operators
PATEO / Baidu Apollo Partnerships in ASEAN
Waymo (Exploratory ASEAN Access Models)
Cruise (Scenario Testing Relevance for SEA)
May Mobility (Campus Shuttle Focus)
Beep Transport Systems AV Transition Plans
ELECTROMobility Networks for AV Infrastructure
EasyMile (Autonomous Shuttle Deployments)
NUConnect & DICT Smart Mobility Programs
Local AV Startups / Simulation & Mapping Providers
- Passenger Demand & Use-Case Adoption
- Corporate & Institutional Fleet Demand
- Safety Perception, Trust Metrics & Pain Points
- Decision-Making Factors in Ride-Hailing Adoption
- Accessibility, Inclusivity & Tourism-Driven Demand
- By Value, 2025-2030
- By Volume (Fleet, Rides), 2025-2030
- By Average Ride Cost / Dynamic Pricing Bands, 2025-2030


 Request a Sample
 Ask for Customization
 Get a Quote
 Enquire Now