
 Download PDF
 Download PDF
Market Overview
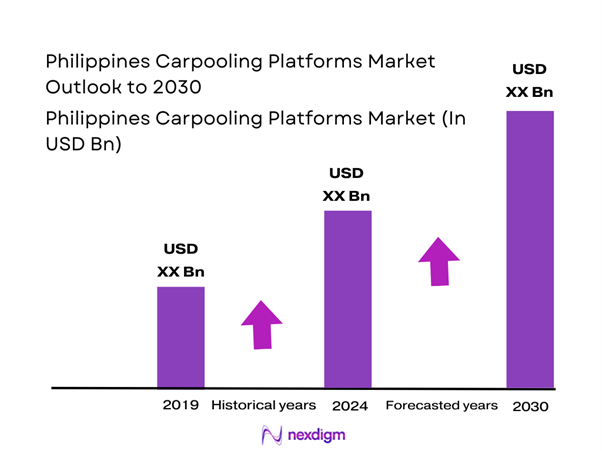
The Philippines carpooling platforms market (app-enabled shared rides and scheduled carpools) is valued at USD ~ billion in the latest year, up from USD ~ billion in the prior year, implied by the Market Insights revenue series referenced in peer-reviewed research on the local ride-hailing market. Demand is primarily pushed by daily commuter pain points (congestion, unreliable mass transport), platform-led supply expansion (more driver-partners and vehicles online), and deeper in-app payments that reduce booking friction and improve repeat usage.
Metro Manila dominates platform activity because it concentrates commuter density, chronic traffic congestion, and the largest addressable base for app-based mobility, making pooling “match probability” structurally higher than elsewhere. Cebu and Davao follow due to urbanization, airport–CBD travel flows, and tourism-linked ride demand that supports route repeatability and reliable pooling economics. Across these cities, platforms win where they can sustain high ride frequency, short pickup times, and strong digital payment acceptance—conditions that are materially stronger in the major metros than in smaller provincial markets.
Market Segmentation
By Carpooling Model
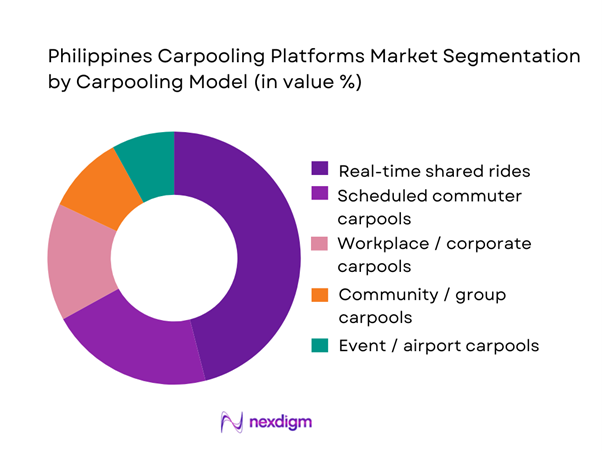
Philippines carpooling platforms market is segmented by carpooling model into real-time shared rides (on-demand pooling), scheduled commuter carpools, workplace/corporate carpools, community/group carpools, and event/airport carpools. Recently, real-time shared rides hold the dominant share because they plug directly into existing ride-hailing behavior: commuters already open mobility apps when stuck in peak-hour traffic, and the platform’s algorithm can bundle nearby riders with overlapping routes. The leading apps also lower coordination burden versus traditional carpools—no fixed groups, no manual planning, and fewer cancellations through in-app matching and pricing. Where pooling is offered as a “tier,” riders treat it as a cheaper alternative to solo bookings without losing app convenience, which is especially compelling in Metro Manila’s dense origin–destination corridors.
By Geography
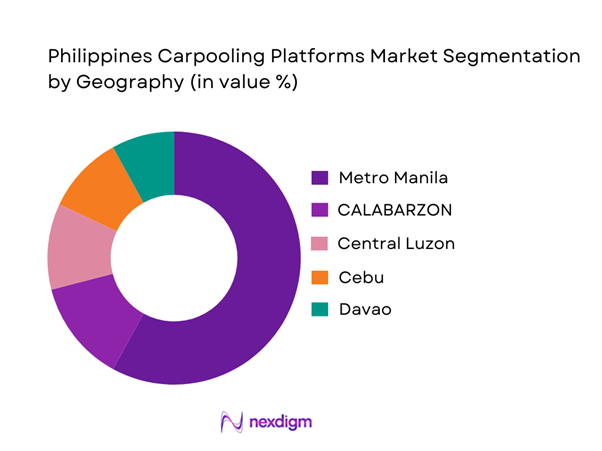
Philippines carpooling platforms market is segmented by geography into Metro Manila, CALABARZON, Central Luzon, Cebu, Davao, and other urban clusters. Recently, Metro Manila has the dominant market share because pooling success depends on density: higher passenger volume increases match rates, reduces detours, and improves pickup reliability—core factors that make shared rides acceptable to time-sensitive commuters. The capital region also benefits from the highest concentration of business districts, BPO hubs, universities, and mixed-use developments that generate predictable commute waves, which platforms can capture with route learning and incentive design. Cebu and Davao rise on tourism and expanding CBD footprints, but the overall pooling “liquidity” remains strongest in the National Capital Region because it concentrates both rider demand and driver availability.
Competitive Landscape
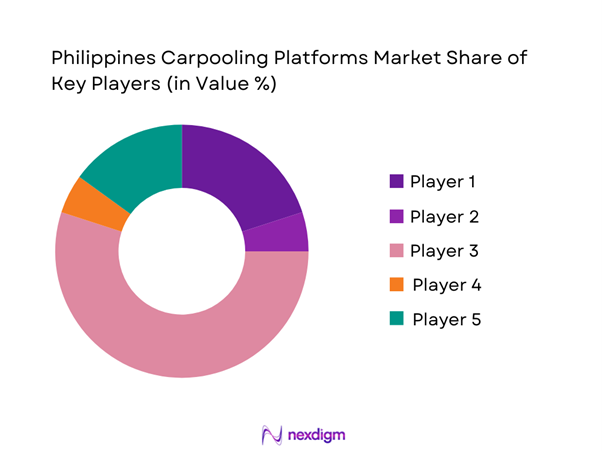
The Philippines carpooling platforms market is dominated by a few major mobility platforms and app-based taxi/ride-hailing operators that can launch pooling as a product tier or route-based feature. Consolidation is shaped by network effects (supply + demand liquidity), regulatory readiness, and the ability to manage safety, trust, and customer support at scale. Metro-led density favors players with the strongest driver acquisition funnels, wallet/payment integration, and operational tooling for peak-hour balancing.
| Company | Established | Headquarters | Core Service Footprint | Pooling / Shared-Ride Capability | Primary Cities Strength | Payment Coverage | Driver / Rider Verification Stack | Unit Economics Lever |
| Grab | 2012 | Singapore | ~ | ~ | ~ | ~ | ~ | ~ |
| JoyRide | 2019 | Philippines | ~ | ~ | ~ | ~ | ~ | ~ |
| Move It | 2022 | Philippines | ~ | ~ | ~ | ~ | ~ | ~ |
| Angkas | 2016 | Philippines | ~ | ~ | ~ | ~ | ~ | ~ |
| MiCab | 2012 | Philippines | ~ | ~ | ~ | ~ | ~ | ~ |
Philippines Carpooling Platforms Market Analysis
Growth Drivers
Urban Congestion Intensity
Carpooling demand in the Philippines is structurally tied to Metro Manila’s congestion load, where “trips per day” and “vehicle-kilometers traveled” keep rising alongside urban concentration. The Philippines’ nominal GDP is USD ~ billion, and the size of the working population creates dense peak-hour directional flows that are hardest to serve with fixed-route capacity alone. The economy also supports continued urbanization: the urban population share is ~ per ~ people, reinforcing corridor crowding and last-mile frictions that make planned carpools attractive for time reliability and access. With ~ million employed persons, daily commuting remains a major, recurring mobility use-case—especially for office-based roles clustered in NCR and growth hubs. These macro baselines (GDP scale, urban concentration, employment mass) translate into a high “matchability” environment for carpooling platforms: many riders share similar origins/destinations at similar times, raising potential seat fill-rates and improving route planning efficiency without requiring new vehicle supply.
Fuel Cost Sensitivity
Fuel sensitivity in carpooling is best explained with macro exposure and consumption volumes (not pump-price levels). The Philippines remains highly exposed to oil-product dependence in transport: national energy statistics show oil products at ~ MTOE in total final energy consumption and note road-transport fuels as the dominant oil-use block, with both fuels increasing versus the prior year. That volume reality matters because shared rides convert fixed vehicle-kilometers into “cost per passenger-kilometer” savings for riders—especially when combined with congestion. Inflation normalization also influences household trade-offs: the inflation indicator shows the country returning to a ~ full-year average inflation environment, which still keeps commuting affordability salient for working households and supports recurring “share-to-save” behavior. At the macro level, the same GDP scale (USD ~ billion) underpins continued mobility demand, but carpooling becomes a practical hedge for cost-aware commuters because it reduces the number of single-occupancy trips required to move the same number of people. Net effect: high road-fuel consumption volumes + inflation sensitivity + large employed base create a durable economic logic for seat-sharing—even without referencing any market size, CAGR, or pricing.
Challenges
Regulatory Ambiguity for Private Vehicles
The policy boundary between “private carpooling,” “for-hire,” and “colorum” operations remains a recurring friction point, shaping platform design (pricing mechanics, driver onboarding, trip frequency caps, and proof-of-cost-sharing). Public discourse and reporting highlight repeated calls for clearer rules on carpooling and private shuttles, including concerns that some shared-ride behaviors can be treated as unauthorized operations without a clear compliance path. At the same time, mobility regulation in the Philippines is active and evolving via transport issuances and circulars, which can create spillover uncertainty for adjacent shared-mobility models when regulators tighten definitions of “public utility” vs. private use. Macro conditions amplify the stakes: with ~ million employed persons, even minor regulatory ambiguity can affect a very large commuting base and can deter corporate participation. At USD ~ billion GDP scale, regulators also face pressure to balance consumer welfare, road safety, and fair competition across mobility formats—often resulting in incremental rule-making rather than one clean framework. For platforms, this challenge is less about “demand” and more about “operating latitude,” which directly impacts supply availability, service continuity, and investment appetite.
Driver Trust and Safety Concerns
Trust is the largest non-price barrier in Philippine carpooling because shared rides rely on “stranger interaction” plus real-world road risk. Road safety signals are material: official and widely reported figures cite ~ vehicular crash incidents in the Philippines in ~, with ~ deaths recorded from these crashes, reinforcing why riders and drivers demand stronger verification, SOS features, and accountability. Even beyond fatalities, incident volume raises perceived risk and increases “no-show” behavior, last-minute cancellations, and preference for known groups. Macro scale compounds the operational challenge: with ~ million employed persons, platforms that cannot solve trust at scale will plateau because mainstream commuters are risk-averse on routine trips. Urbanization also intensifies exposure—~ per ~ people in urban areas means more dense traffic interaction, more complex pickup/dropoff points, and more opportunities for disputes. From a macro lens, trust is not “soft”: it translates into measurable utilization. Platforms that reduce safety incidents and fear unlock higher frequency usage and broader adoption across demographics, which is essential in a commuting-led category.
Opportunities
Corporate Mobility Tie-Ups
Corporate tie-ups are a high-leverage growth path for Philippine carpooling because they create predictable cohorts, repeat usage, and lower trust barriers (employees carpool with verified communities). The macro base is enormous: ~ million employed persons implies a deep pool for employer-mediated commuting programs—especially for firms trying to reduce lateness and improve attendance without adding fleet assets. Government investment promotion signals continued job creation and campus-style employment clusters: approved projects are expected to provide direct jobs to more than ~ Filipinos, which is exactly the kind of concentrated workforce that improves carpool match rates when routed by shift windows and pickup nodes. At a macro scale, the Philippines’ USD ~ billion GDP supports continued expansion of services, office operations, and industrial parks—settings where corporate mobility benefits are often used to reduce commuting stress and improve retention. Finally, stabilized inflation at ~ improves the feasibility of recurring payroll-linked mobility wallets or commuter stipends that can fund scheduled carpools via e-money rails—without needing to reference any market size or pricing.
Green Mobility Programs
Green mobility is an opportunity for carpooling platforms because it aligns with public goals (decongestion + emissions reduction) and can unlock partnerships with LGUs, campuses, and agencies—while using current, verifiable program indicators rather than future projections. A strong proxy for policy momentum is the electrification and charging ecosystem build-out: official reporting cites ~ accredited EV charging station providers as of ~, showing the institutionalization of cleaner mobility infrastructure and accreditation processes that can be extended to shared mobility standards. Road safety and congestion concerns also reinforce “shared-first” logic: with ~ road crash incidents and ~ deaths recorded in ~, programs that reduce vehicle count per commuter can be framed as safety-positive as well as climate-positive—important for government-aligned pilots. Macro fundamentals support continued adoption: ~ per ~ people urban implies that green mobility interventions are easiest to implement where trip corridors are dense and carpooling can replace marginal single-occupancy trips. With nominal GDP at USD ~ billion, the Philippines has the economic scale to keep funding infrastructure, accreditation, and enforcement regimes that can make “verified carpooling” part of urban mobility toolkits without needing any market-size claims.
Future Outlook
Over the next several years, the Philippines carpooling platforms market is expected to expand steadily as platforms refine matching algorithms, reduce cancellation and waiting times, and improve trust through verification and support tooling. Dense commuter corridors in Metro Manila will remain the primary testing ground for pooling-led affordability tiers. Growth will also be supported by wider digital payment usage, stronger employer participation in commute programs, and policy maturation around app-based mobility services and platform work.
Major Players
- Grab
- JoyRide
- Move It
- Angkas
- MiCab
- Owto
- Hype Transport Systems
- U-Hop
- InDrive
- Transportify
- Sakay.ph
- TaxiGo
- eSakay
- Community Carpool PH networks
Key Target Audience
- Mobility platform operators & super-app strategy teams
- Corporate HR & admin teams managing employee commute programs
- Real estate developers & township operators
- Fleet operators and vehicle leasing companies
- Insurance providers underwriting platform mobility risk products
- Payments & e-wallet companies
- Investments and venture capitalist firms
- Government and regulatory bodies
Research Methodology
Step 1: Identification of Key Variables
We map the platform mobility ecosystem across riders, driver-partners, taxi operators, employers, and payment providers. Desk research is supported by platform feature mapping and regulatory scans to define market boundaries for “carpooling platforms” within app-based mobility. Variables include trip frequency, pooling matchability, route density, cancellation drivers, and payment mix.
Step 2: Market Analysis and Construction
We construct the market using a hybrid approach: top-down validation from published mobility revenue/user series and bottom-up triangulation from platform mechanics (active supply, booking conversion funnels, and city-level liquidity). We validate the linkage between demand peaks and pooling suitability.
Step 3: Hypothesis Validation and Expert Consultation
Hypotheses are validated through expert consultations with platform operators, fleet/driver communities, and corporate mobility managers. Discussions focus on pooling adoption constraints, trust and safety friction, city-level expansion barriers, and monetization models.
Step 4: Research Synthesis and Final Output
We synthesize findings into segment-wise opportunity sizing, competitive positioning, and go-to-market recommendations. The final report cross-validates claims using multiple sources to ensure robust, business-decision-ready outputs.
- Executive Summary
- Research Methodology (Market Definitions and Assumptions, Abbreviations, Market Boundary Definition for Digital Mobility Platforms, Demand-Side vs Supply-Side Estimation Logic, Platform-Level Bottom-Up Sizing, Rider–Driver Cohort Mapping, Primary Interviews with Platform Operators, Drivers and Corporate Mobility Managers, Regulatory Mapping Validation, Limitations and Forward-Looking Assumptions)
- Definition and Scope
- Market Genesis and Evolution of Shared Mobility Models
- Platform-Led vs Community-Led Carpooling Ecosystem
- Market Lifecycle and Adoption Curve
- Digital Mobility Value Chain Analysis

- Growth Drivers
Urban Congestion Intensity
Fuel Cost Sensitivity
Smartphone Penetration
Digital Wallet Adoption
Work-from-Office Resumption Patterns - Challenges
Regulatory Ambiguity for Private Vehicles
Driver Trust and Safety Concerns
Ride Consistency Issues
Insurance Coverage Gaps
Platform Unit Economics - Opportunities
Corporate Mobility Tie-Ups
Green Mobility Programs
Electric Vehicle-Based Carpooling
Subscription Commute Models
Smart City Integrations - Trends
Super-App Integration
AI-Based Route Optimization
Carbon Credit-Linked Carpooling
Women-Only Carpooling
Employer-Sponsored Commute Programs - Regulatory & Policy Landscape
- SWOT Analysis
- Stakeholder & Ecosystem Analysis
- Porter’s Five Forces Analysis
- Competitive Intensity & Ecosystem Mapping
- By Value, 2019–2024
- Installed Base, 2019–2024
- Service Revenue Mix, 2019–2024
- By Fleet Type (in Value %)
Trip-Based Matching
Route-Based Matching
Workplace-Based Carpooling
Community-Based Carpooling
Event-Based Carpooling - By Application (in Value %)
Daily Office Commuters
BPO Employees
University Students
Industrial Zone Workers
Long-Distance Provincial Commuters - By Technology Architecture (in Value %)
Private Sedans
MPVs
SUVs
Vans
Electric Vehicles - By Connectivity Type (in Value %)
Cash
E-Wallets
In-App Wallets
Corporate Reimbursements
Subscription Passes - By End-Use Industry (in Value %)
VC-Backed Startups
Corporate Mobility Platforms
Cooperative or Community Platforms
Enterprise SaaS Mobility Providers
Super-App Integrated Services - By Region (in Value %)
Metro Manila
CALABARZON
Central Luzon
Cebu
Davao
- Market Share Analysis by Trips and Active Users
- Cross Comparison Parameters (Platform Scale, Active Driver Base, Route Density, Matching Algorithm Sophistication, Payment Integration Depth, Corporate Partnerships, Regulatory Readiness, Unit Economics Sustainability)
- SWOT Analysis of Major Players
- Monetization and Pricing Model Analysis
- Detailed Profiles of Major Companies
Grab
JoyRide
Angkas
Move It
Sakay.ph
eSakay
GoLag
Tripidito
Carpool PH
Wunder
BlaBlaCar
HopSkipDrive
SweldoRide
Campus-Based Carpool Networks
- Daily office commuters
- BPO employees
- University students
- Industrial zone workers
- Long-distance provincial commuters
- By Value, 2025–2030
- Installed Base, 2025–2030
- Service Revenue Mix, 2025–2030


 Request a Sample
 Ask for Customization
 Get a Quote
 Enquire Now