
 Download PDF
 Download PDF
Market Overview
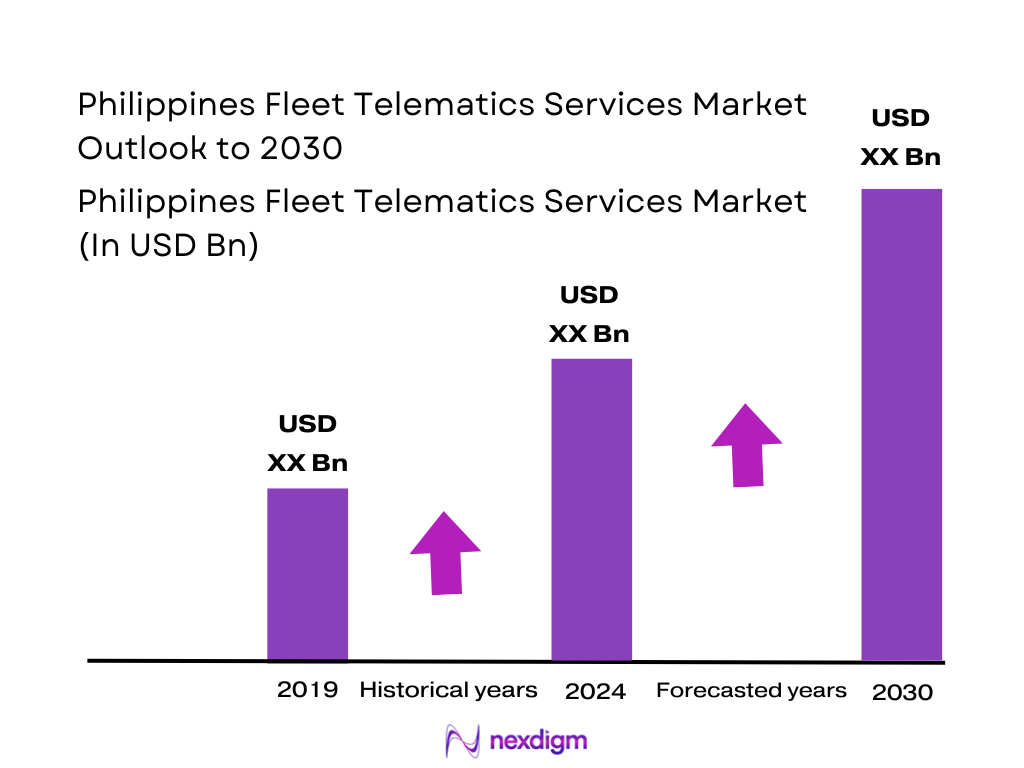
The Philippines Fleet Telematics Services Market is valued at USD ~ million in the latest year, following a valuation of USD ~ million in the preceding year as reported in public market snapshots. Demand is anchored in fleet operators’ need for real-time visibility, route discipline, fuel control, theft recovery, driver-safety monitoring, and maintenance scheduling, with adoption accelerating where fleets run multi-stop urban routes and time-window deliveries. The shift from “GPS dots-on-a-map” to analytics-led fleet operations is also expanding subscription ARPU through add-ons such as alerts, dashboards, and API integrations.
Within the Philippines, Metro Manila (NCR) leads deployments because dense delivery loops, congestion exposure, and service-level pressure make dispatch optimization and exception management high-ROI; adjacent industrial corridors in CALABARZON and Central Luzon follow due to warehousing, manufacturing, and port-linked distribution. Regionally important secondary hubs such as Cebu and Davao also sustain demand through inter-island logistics and urban delivery. On the supplier side, solution ecosystems and platforms anchored in the United States and Singapore tend to dominate enterprise-grade deployments due to stronger SaaS maturity, multi-country fleet support, and integration-led product roadmaps.
Market Segmentation
By Fleet Type
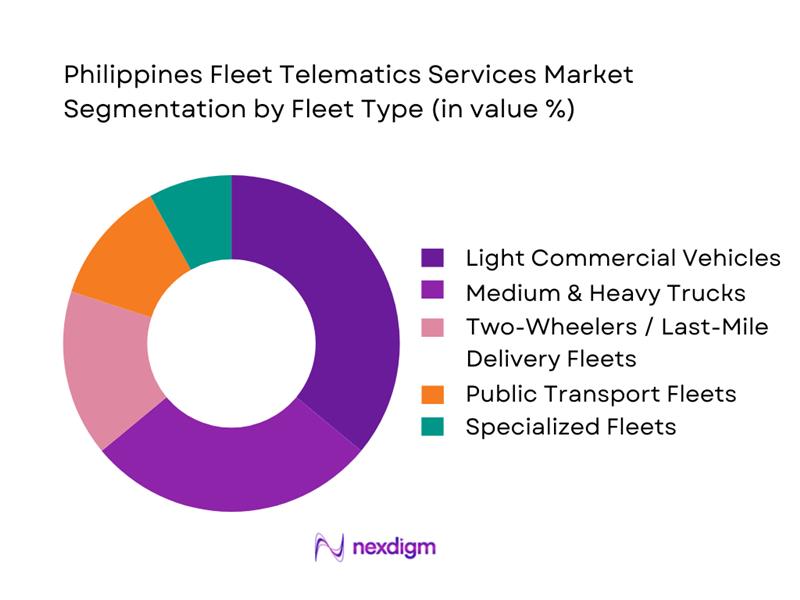
The Philippines Fleet Telematics Services Market is segmented by fleet type into light commercial vehicles, medium & heavy trucks, two-wheelers/last-mile, public transport fleets, and specialized fleets (utilities/construction/cold chain). Recently, light commercial vehicles (LCVs) hold the dominant market share because LCVs form the operational backbone of urban and peri-urban distribution, where route density, stop frequency, and delivery proof requirements push fleets to adopt location intelligence, geofencing, ePOD workflows, and driver behavior monitoring. LCV operators also scale faster than heavier fleets (shorter procurement cycles, easier device installation, and higher fleet churn requiring fast onboarding). In addition, LCVs are the most exposed to Metro Manila service variability, so dispatch discipline and delay analytics become mission-critical. This combination makes LCV telematics spend more “subscription-led” and sticky versus one-time tracking hardware purchases.
By Application
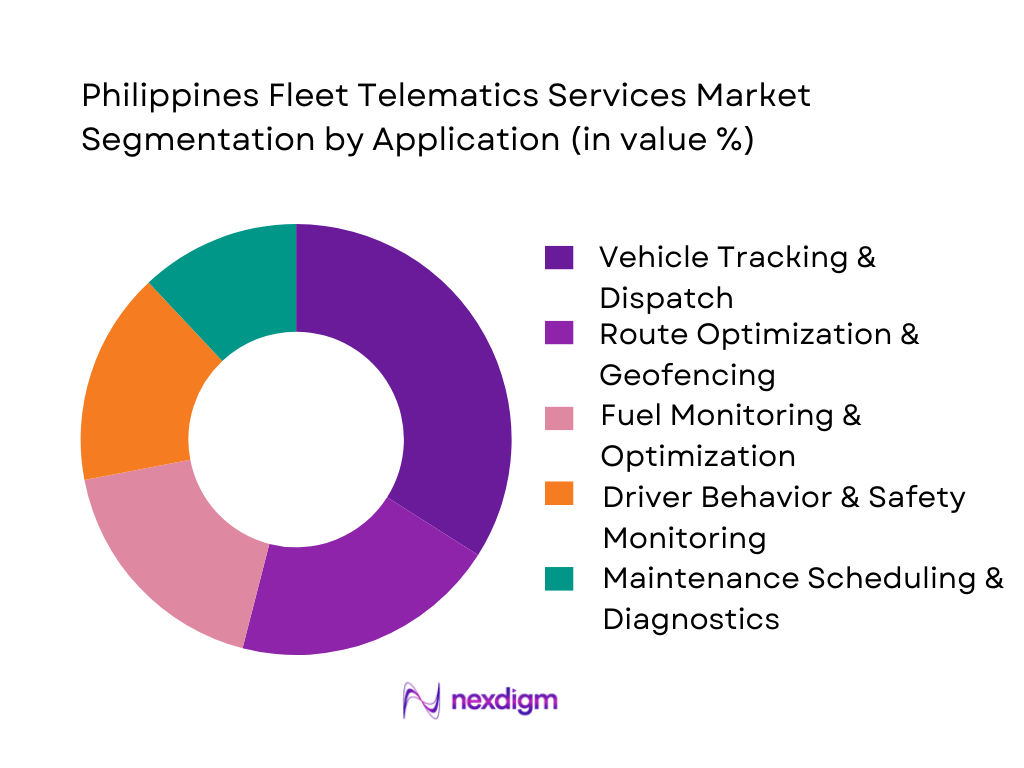
The market is segmented by application into vehicle tracking & dispatch, driver behavior & safety, fuel monitoring, route optimization & geofencing, and maintenance/diagnostics. Recently, vehicle tracking & dispatch dominates because most Philippine fleets still prioritize operational visibility as the first layer of digital control—especially in high-traffic metros where service failures are driven by late departures, route deviations, and unplanned stops. Dispatch-focused telematics is also the easiest to operationalize: it delivers immediate value through live ETAs, exception alerts, job allocation, and customer coordination without requiring deep vehicle data access. As fleets mature, they typically add fuel and safety modules; however, the “control tower” need (tracking + dispatch) remains the daily system-of-record across logistics, field service, and contract transport. This also makes tracking/dispatch the most widely purchased bundle among SMEs and mid-market fleets.
Competitive Landscape
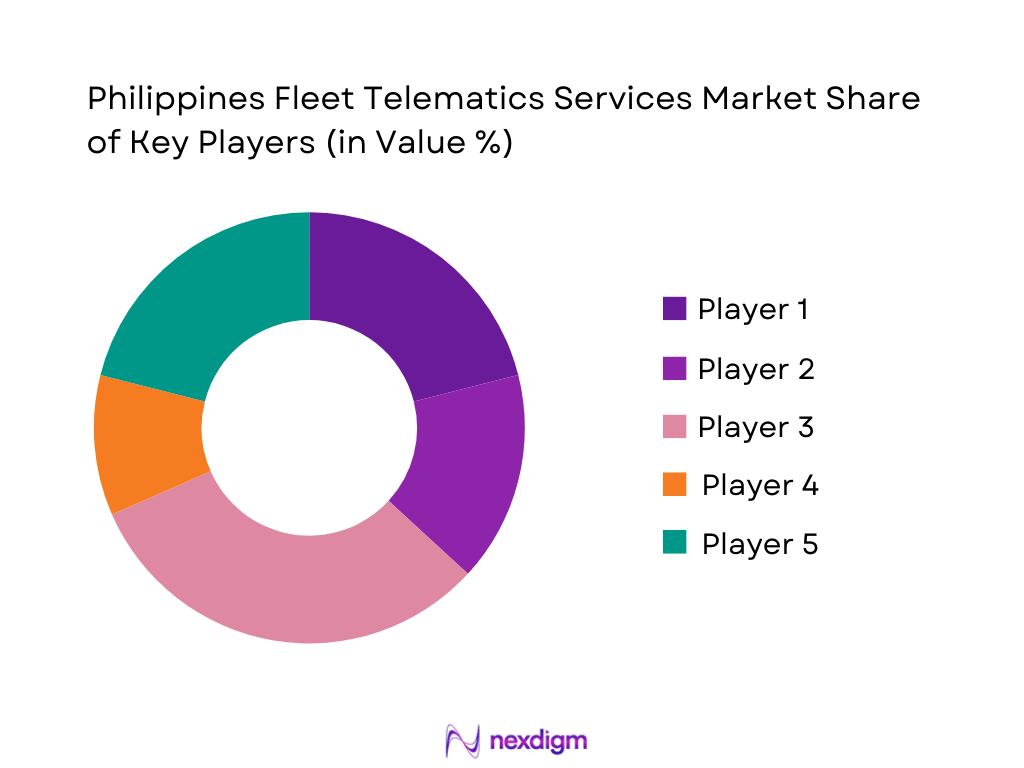
The Philippines Fleet Telematics Services Market is moderately fragmented: enterprise fleets lean toward global platforms with strong analytics and integrations, while SMEs and mid-market fleets often buy through local integrators offering device installation, SIM provisioning, and field support. Public-transport modernization and safety-led procurement also expand demand for CCTV/video telematics, driving partnerships between platform vendors, hardware OEMs, and Philippine installation networks.
| Company | Est. Year | Headquarters | Primary PH Use-Cases | Typical Deployment Model | Device/Data Stack Depth | Video Telematics Readiness | Integration Strength (APIs/ERP/TMS) | Local Partner / Support Footprint |
| Geotab | 2000 | Oakville, Canada | ~ | ~ | ~ | ~ | ~ | ~ |
| Verizon Connect | 2001 | Georgia, USA | ~ | ~ | ~ | ~ | ~ | ~ |
| Trimble Transportation | 1978 | Colorado, USA | ~ | ~ | ~ | ~ | ~ | ~ |
| MiX Telematics | 1996 | Johannesburg, South Africa | ~ | ~ | ~ | ~ | ~ | ~ |
| Vectras (PH-focused integrator) | 2000s* | Philippines | ~ | ~ | ~ | ~ | ~ | ~ |
Philippines Fleet Telematics Services Market Analysis
Growth Drivers
Fuel Cost Volatility
The business case for fleet telematics in the Philippines strengthens when fuel-driven operating risk rises, because route optimization, idling control, speed governance, and exception-based dispatch directly reduce avoidable kilometers and unproductive engine hours. Macro conditions underline why fuel management remains board-level: the Philippines’ imports of mineral fuels, lubricants and related materials were USD ~ billion and remained among the country’s largest import items, keeping fleet OPEX exposed to external shocks and peso movements. At the same time, the economy’s scale indicates a large base of commercial mobility—logistics, field services, and contracted transport—where fuel leakages compound quickly across multi-vehicle fleets. Telematics ROI is also reinforced by external buffers and monetary conditions: the IMF reported gross reserves of USD ~ billion and period-average inflation of 3.2, signaling an environment where firms still pursue cost discipline even as disinflation improves planning reliability. In this context, Philippine fleets increasingly prioritize “fuel governance stacks”, because they translate macro import exposure into controllable, vehicle-level KPIs without changing core service capacity.
Traffic Congestion Index
Fleet telematics adoption accelerates where congestion is structural, because the economic value shifts from “faster driving” to “smarter movement”—dynamic routing, time-window compliance, dwell-time analytics, and geofenced customer service verification. Metro Manila’s congestion is evidenced by operational-scale traffic loads: the MMDA reported average daily traffic on EDSA of more than ~ vehicles, a volume that creates persistent travel-time variability and elevates SLA risk for B2B distribution, last-mile, and service fleets crossing major corridors. This directly increases the demand for telematics features that are congestion-resilient: multi-stop optimization, historical travel-time overlays, dispatch exception workflows, and customer ETA accuracy. Congestion-driven telematics value is also amplified by macro scale and labor-market tightness because late deliveries and missed appointments translate into overtime, failed deliveries, and re-servicing costs rather than just “lost time.” The IMF’s macro profile supports this intensity: a nominal GDP of USD ~ billion with an unemployment rate of 4.0 indicates high utilization of both assets and workforce—so reducing non-productive time through route compliance and automated proof-of-service becomes a productivity strategy, not a nice-to-have. In practice, Philippine operators increasingly pair telematics with operational policy to stabilize delivery cadence across Metro Manila choke points and inter-city spillovers, especially where customer penalties or per-drop economics are tight.
Challenges
Fragmented Fleet Ownership
Fleet telematics scale can be slowed by ownership fragmentation—many small operators, mixed-asset profiles, and irregular replacement cycles—which complicates standardization, procurement, and recurring subscription adoption. In the Philippines, fragmentation is reinforced by the broader SME-heavy business structure and subcontracting practices in trucking, couriering, construction haulage, and service logistics, where vehicle ownership is distributed and fleet sizes are often small per operator. This creates practical barriers: inconsistent installation quality, varied device specs, uneven driver training, and higher churn when vehicles change hands. Macro signals indicate why fragmentation matters operationally: the IMF reports employment growth of ~ (in its table) and an unemployment rate of ~, reflecting an active labor market where fleets rely on flexible staffing—drivers moving between operators—making identity, behavior history, and compliance harder to retain without integrated systems. The economic scale further indicates the presence of many transport users across industries rather than a single concentrated buyer set. For telematics providers, this shifts the go-to-market requirement toward “SME-ready telematics”: quick-install kits, device financing structures, offline-capable apps, and simplified dashboards that translate into daily operational decisions. For buyers, fragmentation pushes demand for interoperability—APIs, multi-vendor device support, and standard KPI templates—so corporate shippers and 3PLs can enforce performance metrics across subcontractors. The challenge is not demand; it is execution at scale across heterogeneous fleet owners, which requires onboarding toolkits and operational playbooks built for fragmented ecosystems.
Hardware Theft & Tampering Risk
Telematics value depends on data integrity; theft and tampering reduce trust in metrics and can force fleets to over-invest in controls, slowing deployments. The Philippines’ dense urban corridors and high vehicle volumes create more touchpoints for opportunistic interference—devices can be unplugged, antennas cut, GPS spoofing attempted, or cameras obstructed—especially in high-dwell environments. The macro environment underlines the stakes: with EDSA averaging more than ~ vehicles daily, enforcement bandwidth and traffic density create practical limits to “manual oversight,” making fleets more dependent on automated, tamper-aware telemetry. Meanwhile, the IMF’s economic profile—nominal GDP of USD ~ billion and gross reserves of USD ~ billion—signals a large flow of goods and services that depends on reliable commercial mobility; telematics failures can translate into claims, compliance risk, and service penalties. Because the user environment is adversarial, successful Philippine deployments typically require layered protection: hidden installation practices, tamper alerts, driver policy enforcement through apps, and cross-validation using motion/accelerometer and network signals. Video telematics increases the stakes further because cameras are easier targets for obstruction; fleets compensate through dual-facing setups, event-triggered uploads, and periodic audit routines. In short, tamper risk is not a niche technical issue—it is an operational reality that pushes the market toward ruggedized devices, secure installation ecosystems, and strong chain-of-custody processes for data used in disciplinary actions or insurance claims.
Opportunities
Public Transport Modernization Program Integration
A major growth opportunity for fleet telematics in the Philippines is deeper integration into public transport modernization and formalization initiatives, because these programs require measurable service quality, safety, and operational compliance—exactly what telematics provides. The macro signal is that the operating base is large and the state has an incentive to improve mobility productivity: the IMF reports nominal GDP of USD ~ billion and gross reserves of USD ~ billion, reflecting capacity for continued infrastructure and system modernization discussions even amid competing priorities. Urban mobility pressure is also quantifiable: EDSA’s more than ~ vehicles daily indicates congestion and reliability constraints that reward managed, monitored fleet operations in public transport corridors. In this environment, telematics vendors can grow by aligning product design with program needs: standardized compliance dashboards for route operators, automated reporting packs for regulators/LGUs, driver safety scoring, and incident workflows that support enforcement and subsidy-linked accountability. Importantly, this opportunity reflects future growth without relying on future numbers: the current scale of traffic and the current macro-economic base explain why stakeholders increasingly require “measurable mobility outcomes” rather than informal operations. As modernization pushes for better headway control, service reliability, and safety oversight, telematics becomes the backbone for performance-based contracting, operator accreditation, and continuous compliance auditing—creating an addressable market beyond private logistics fleets.
Video Telematics Adoption
Video telematics is a structural expansion lever for the Philippine fleet telematics market because it moves value from “where the vehicle was” to “what happened,” enabling defensible safety programs, claims support, and behavior coaching in high-risk traffic conditions. The current operating environment supports this: EDSA traffic averaging more than ~ vehicles daily indicates dense interaction, higher incident probability, and more frequent dispute scenarios—conditions where event-based video evidence improves resolution speed and reduces operational friction. Compliance and trust also matter: the National Privacy Commission’s dashboard lists ~ personal breach notifications, pushing enterprises to demand stronger governance when deploying camera-based systems—creating a premium for vendors that can combine video with privacy controls. Macro capacity supports ongoing digitization: the IMF reports inflation of ~ and nominal GDP of USD ~ billion, while the BSP records ~ million digital transactions in major use-cases—signals that digital workflows are normalizing and enterprises are more willing to adopt data-heavy systems when controls are robust. In practice, video telematics adoption is accelerated by Philippine realities: motorcycle-heavy mixed traffic, frequent close-quarters maneuvers, and congestion-driven stress. Fleets respond by using AI-triggered clips rather than continuous recording, balancing operational usefulness with compliance discipline.
Future Outlook
Over the next cycle, the Philippines Fleet Telematics Services Market is expected to expand as fleets move from basic tracking to decision automation—exception-based dispatch, fuel anomaly detection, and predictive maintenance. Video telematics adoption is likely to rise where safety KPIs and incident disputes are costly. Interoperable APIs and integration with TMS/ERP/field-service tools will become a major vendor differentiator. A regional benchmark indicates Southeast Asia’s active fleet management installed base is forecast to rise from about ~ million units to nearly ~ million units by the late-decade window, supporting a structurally growing demand pool for telematics platforms and services.
Major Players
- Geotab
- Verizon Connect
- Trimble Transportation
- MiX Telematics
- Webfleet
- Samsara
- Teletrac Navman
- CalAmp
- TomTom
- Fleet Complete
- Navixy
- Teltonika Telematics
- Ctrack
- Trackimo
Key Target Audience
- C-suite and heads of fleet operations
- Transport and last-mile operations leaders
- Heads of safety, risk, and compliance
- Procurement heads and category managers
- Telecommunications and IoT solutions leaders
- Insurance and UBI/claims innovation teams
- Investments and venture capitalist firms
- Government and regulatory bodies
Research Methodology
Step 1: Identification of Key Variables
We build an ecosystem map of Philippine fleet stakeholders—fleet operators, integrators, telcos, and regulators—then define variables such as fleet count bands, device attach rates, ARPU, and solution mix. Desk research is supported by paid databases and credible public references, aligned with a consistent market definition and inclusion criteria.
Step 2: Market Analysis and Construction
Historical adoption is constructed by fleet archetype and solution layers. We model revenue through a bottom-up lens using subscription mix, device deployment patterns, and typical contract structures across SME, mid-market, and enterprise fleets.
Step 3: Hypothesis Validation and Expert Consultation
Hypotheses are validated through CATIs with fleet managers, dispatch heads, integrators, and IoT connectivity teams. Interviews test willingness-to-pay bands, churn drivers, feature demand, and vendor selection criteria, improving the robustness of the market sizing.
Step 4: Research Synthesis and Final Output
Outputs are finalized through triangulation between bottom-up estimates, vendor-channel checks, and expert confirmations. We consolidate findings into segmentation, competitive benchmarking, and forward outlook—ensuring assumptions, limitations, and sensitivity checks are clearly documented.
- Executive Summary
- Research Methodology (Market Definition & Scope, Telematics Service Boundary Mapping, Data Triangulation Framework, Bottom-Up & Top-Down Market Engineering, Primary Interviews with Fleet Operators & System Integrators, Assumptions & Limitations)
- Definition and Scope
- Evolution of Fleet Telematics Adoption in the Philippines
- Milestone Timeline
- Business Cycle Analysis: Adoption, Expansion, Optimization & Renewal
- Fleet Telematics Value Chain & Service Delivery Ecosystem

- Growth Drivers
Fuel Cost Volatility
Traffic Congestion Index
Logistics Cost Intensity
Urbanization & E-Commerce Penetration - Challenges
Fragmented Fleet Ownership
Hardware Theft & Tampering Risk
Connectivity Gaps in Tier-II/III Regions
Data Privacy Compliance - Opportunities
Public Transport Modernization Program Integration
Video Telematics Adoption
EV Fleet Telematics
AI-Driven Predictive Analytics - Trends
Shift from Tracking to Analytics-Led Telematics
SaaS-Based Fleet Platforms
API-First Integrations with ERP & TMS - Regulatory & Policy Landscape
- SWOT Analysis
- Stakeholder & Ecosystem Analysis
- Porter’s Five Forces Analysis
- Competitive Intensity & Ecosystem Mapping
- By Value, 2019-2024
- Installed Base of Telematics-Enabled Vehicles, 2019-2024
- Service Revenue Mix, 2019-2024
- By Fleet Type (in Value %)
Light Commercial Vehicles
Medium & Heavy Commercial Vehicles
Public Utility Jeepneys & Buses
Motorcycles & Last-Mile Delivery Fleets
Government & Municipal Fleets - By Application (in Value %)
Vehicle Tracking & Real-Time Location
Driver Behavior & Safety Monitoring
Fuel Monitoring & Optimization
Route Planning & Dispatch Management
Predictive Maintenance & Diagnostics - By Technology Architecture (in Value %)
GPS-Based Telematics
OBD-Based Systems
CAN-Bus Integrated Solutions
Video Telematics & ADAS-Enabled Platforms
IoT Sensor-Driven Fleet Analytics - By Connectivity Type (in Value %)
Cellular
LPWAN & Hybrid Connectivity
Satellite-Assisted Telematics - By End-Use Industry (in Value %)
Logistics & Freight Forwarding
Ride-Hailing & On-Demand Mobility
E-Commerce & Last-Mile Delivery
Construction, Mining & Utilities
Government, Public Transport & Emergency Services - By Region (in Value %)
NCR
Luzon
Visayas
Mindanao
- Market Share Analysis by Value & Installed Base
- Cross Comparison Parameters (Geographic Coverage, Connectivity Partnerships with Philippine Telcos, Public Transport Modernization Readiness, Video Telematics Capability, Data Analytics Depth, API & ERP Integration Capability, Local Support & Installation Network, Pricing & Contract Flexibility)
- Competitive Benchmarking Matrix
- Strategic Initiatives, Partnerships & Platform Differentiation
- SWOT Analysis of Major Players
- Detailed Company Profiles
Geotab
Verizon Connect
Trimble Transportation
Samsara
Webfleet
MiX Telematics
Teletrac Navman
CalAmp
TomTom Telematics
Fleet Complete
Navixy
Trackimo
Ctrack
Teltonika Telematics
- Fleet Digital Maturity Assessment
- Telematics Adoption Drivers by Fleet Size
- Budget Allocation & ROI Sensitivity
- Operational Pain Points & KPI Priorities
- Buying Decision Process & Vendor Selection Criteria
- By Value, 2025-2030
- Installed Base of Telematics-Enabled Vehicles, 2025-2030
- Service Revenue Mix, 2025-2030


 Request a Sample
 Ask for Customization
 Get a Quote
 Enquire Now