
 Download PDF
 Download PDF
Market Overview
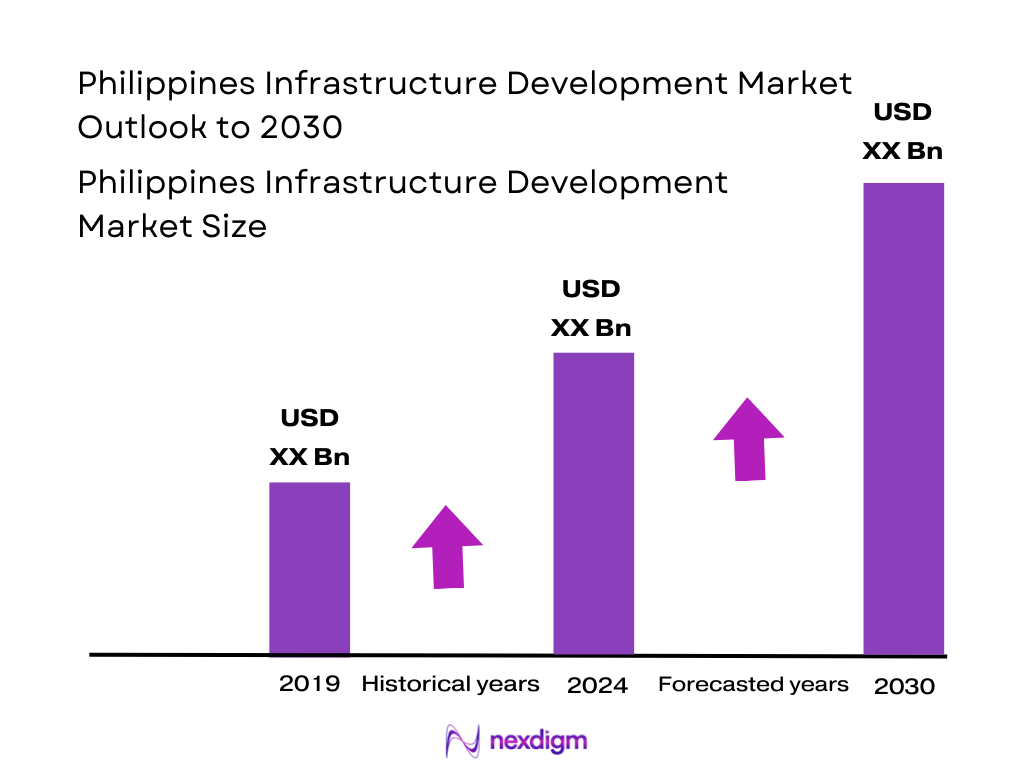
The Philippines infrastructure development market is valued at approximately USD 39.40 billion, derived from the broader construction market in 2024. This valuation reflects substantial government-driven infrastructure spending across transport, energy, water, and digital networks, supported by public–private partnerships and urban expansion.
The landscape is dominated by major urban centers—Metro Manila, Cebu, and Davao—which lead due to their extensive infrastructure demand, business-economic activity, and prioritization in national infrastructure agendas. Metro Manila commands the deepest funding pipelines, while vibrant regional economies in Cebu and Davao are attracting projects for connectivity, urban resiliency, and commercial growth.
Market Segmentation
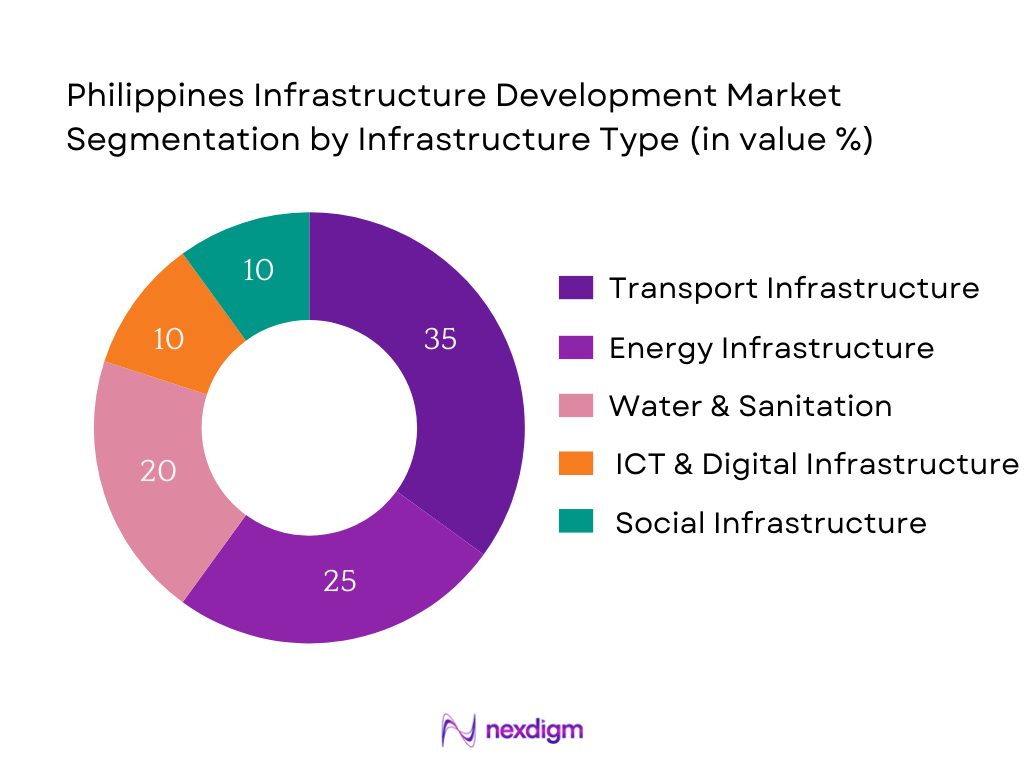
By Infrastructure Type
The Philippines infrastructure market is segmented into transport, energy, water & sanitation, ICT/digital, and social infrastructure. Transport infrastructure leads in share due to major projects such as commuter rail, expressways, and airport expansions forming the core of national connectivity objectives. Transport corridors catalyze economic zones and land value; consequently, transport dominates construction volume. Energy infrastructure follows, propelled by grid interconnection (e.g. Mindanao–Visayas Interconnection) and renewable projects to meet the 35 % renewables target. Water systems and sanitation infrastructure reflect growing demand from urban populations and resilience to climate challenges. Digital infrastructure is increasingly significant as smart city and connectivity rollouts grow, while social infrastructure supports socio‑economic development through hospitals and schools.
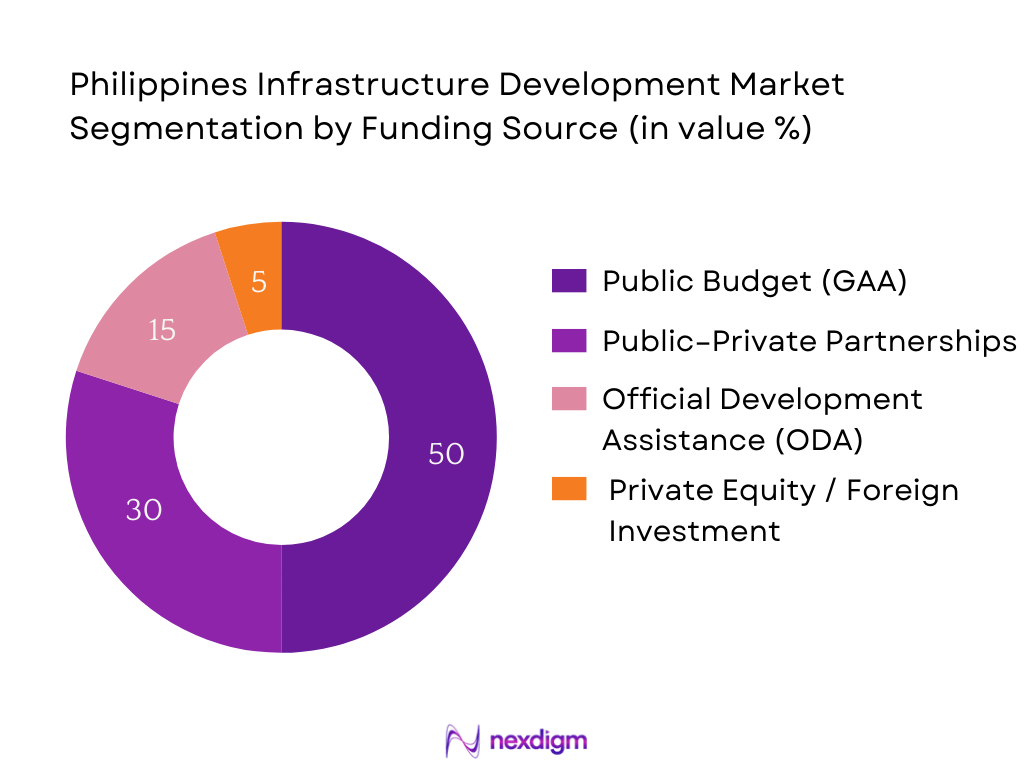
By Funding Source
Infrastructure funding is segmented into public general appropriations, PPPs, ODA, and private/foreign investment. Public budget remains dominant, underwritten by major programs like Build Better More. However, PPPs are rapidly growing as government seeks co‑financing and technical capacity. ODA from multilateral agencies continues to fund water and health projects, while private equity plays a rising but smaller role, particularly in renewable energy and digital infrastructure, driven by investment reforms and foreign interest.
Competitive Landscape
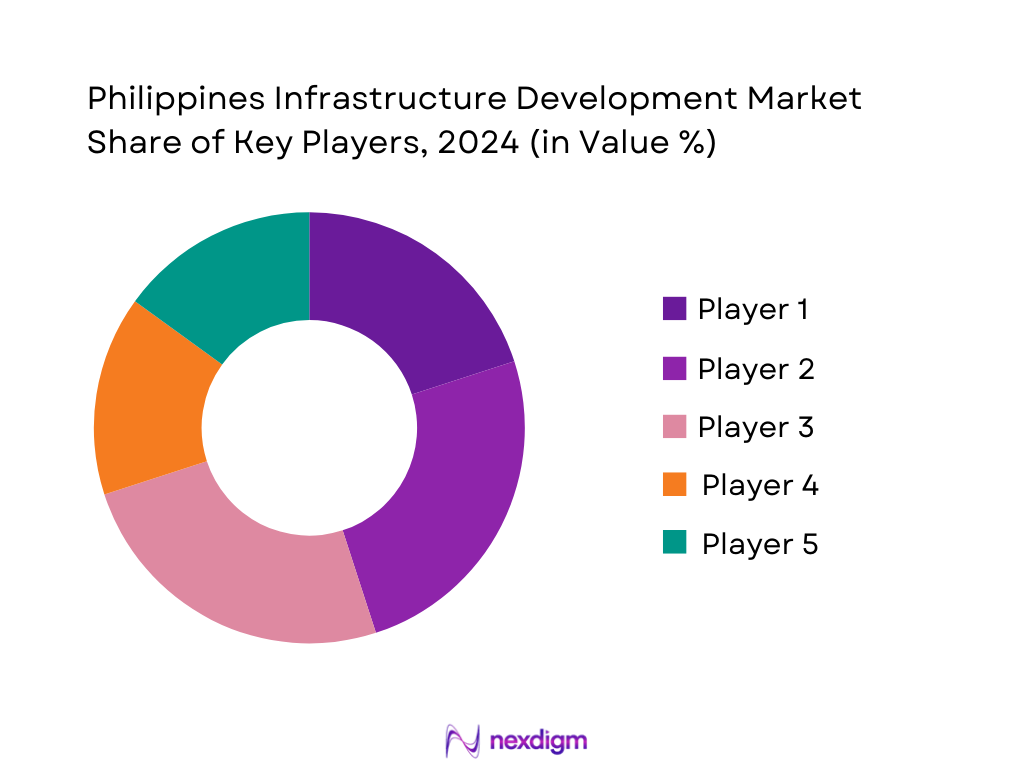
The Philippines infrastructure development market is shaped by a handful of integrated and regionally deep companies that manage high‑value infrastructure projects. These major firms leverage EPC capabilities, precast assets, bold financing strategies, and strong government ties to secure flagship contracts.
| Company | Establishment Year | Headquarters | EPC Capabilities | Precast/Modular Capacity | PPP Experience | Geographic Coverage | Renewable/Energy Expertise | Flagship Projects |
| DMCI Holdings | 1954 | Manila | – | – | – | – | – | – |
| Megawide Construction Corporation | 1997 | Quezon City | – | – | – | – | – | – |
| EEI Corporation | 1931 | Quezon City | – | – | – | – | – | – |
| San Miguel Infrastructure | 1957 | Mandaluyong City | – | – | – | – | – | – |
| Metro Pacific Tollways Corporation | 1985 | Pasig City | – | – | – | – | – | – |
Philippines Infrastructure Development Market Analysis
Growth Drivers
GDP Share of Construction Sector
The construction sector contributes 7.7 percent of GDP in the first semester of 2025, up from 6.8 percent in 2024 according to the Philippine Statistics Authority. At current prices, construction value added rose to PHP 1,079,645 million in the first semester of 2025, compared to PHP 1,027,961 million in the same period of 2024, reflecting increasing government infrastructure activity and private investments channeled into megaprojects. This expansion in construction’s GDP share underscores its pivotal role in supporting infrastructure development across transport, energy, water, and digital sectors. These figures indicate sustained momentum that underpins infrastructure growth, reinforcing its weight in economic output and investment planning.
Logistics Cost Reduction
The Philippines’ Logistics Performance Index score improved to 3.3 in 2023 from 2.86 in 2018, propelling it to 43rd among 139 countries, up from 60th, signaling significant gains in logistics efficiency. Enhanced customs procedures, infrastructure quality, and timeliness of shipments contributed to this improvement. Specifically, the “infrastructure” sub‑score reached 3.2, while “timeliness” scored 3.3, reflecting smoother freight flow, better roads, ports, and digital tracking systems. These logistics enhancements have translated into lower operational bottlenecks and reduced indirect infrastructure development costs, catalyzing a more favorable environment for project execution and investment.
Market Challenges
Right‑of‑Way Issues
Land acquisition and right‑of‑way (ROW) delays remain major barriers. The Philippine Roads Board and DPWH report that ROW acquisition lags by 8 to 12 months on average for major road projects, particularly in regions like Luzon and Mindanao, stalling project timelines despite official approval. Delays escalate holding costs and financing burdens, discouraging some investors or pushing contractors to escalate bids. These protracted acquisition timelines reflect coordination gaps among agencies, legal disputes, and conflicts with landowners. Addressing this bottleneck remains crucial to keeping infrastructure projects on track, ensuring timely completion and cost efficiency.
Permit and Regulatory Delays
Regulatory red tape continues to stall approvals. According to the Department of Public Works and Highways, it currently takes an average of 9 to 11 months to secure all necessary permits and environmental clearances for large infrastructure projects, up from 6 to 8 months prior to 2022 reforms. This elongation reflects overlapping requirements across national and local government units, compounded by intermittent policy changes. Such delays inflate financing costs and often disrupt procurement timelines, constraining contractors’ capacity to mobilize resources. Streamlined inter‑agency coordination and single‑window systems are being explored to mitigate these barriers.
Opportunities
Green Infrastructure Financing
There is growing traction for green infrastructure funding. The Philippine Department of Finance reports that as of mid‑2024, PHP 150 billion worth of “green” or climate‑resilient infrastructure proposals—spanning flood control, renewable energy, and water conservation projects—are in active review for public financing and multilateral concessional loans. These projects are being prioritized under new guidelines in the Build Better More program, reflecting recognition of climate risks and sustainable development mandates. The volume of climate‑aligned infrastructure proposals marks a clear shift in financing priorities, unlocking future pipelines that can drive both resilience and infrastructure growth.
Smart Infrastructure Rollout
Digital and smart infrastructure investments are gaining momentum. The Department of Information and Communications Technology reports that PHP 12 billion worth of smart city and digital infrastructure projects—such as intelligent traffic systems, fiber‑optic backbones, and urban sensors—are currently being implemented in Metro Manila, Cebu, and Davao. This includes metro traffic management systems and citywide surveillance networks. Deployment of such technologies enhances efficiency, reduces maintenance costs, and augments data‑driven planning capacity, progressively transforming infrastructure development from traditional physical to digitally‑augmented systems.
Future Outlook
The infrastructure development market in the Philippines is poised for sustained expansion, underpinned by accelerated public infrastructure pipelines, rising private sector participation, and regional connectivity ambitions. The Build Better More initiative, continued renewables push, and digital infrastructure rollout are expected to sustain strong construction momentum. Efficiency gains from modular construction and healthy PPP frameworks will drive scalability and ROI. Overall, infrastructure will remain a principal economic lever in the near term.
Key Players
- DMCI Holdings
- Megawide Construction Corporation
- EEI Corporation
- San Miguel Infrastructure
- Metro Pacific Tollways Corporation
- First Balfour
- Aboitiz InfraCapital
- Alloy MTD Philippines
- Ayala‑owned Makati Development Corporation
- China Road and Bridge Corporation (Philippines)
- Clara International Corp.
- JFAP Construction
- DDT Konstract Inc.
- Atlantic Gulf & Pacific Co. of Manila
- Prime Metroline Infrastructure Holdings
Key Target Audience:
- Infrastructure Investment Funds / Investment & Venture Capitalist Firms
- Department of Public Works and Highways (DPWH)
- Department of Transportation (DOTr)
- Bases Conversion and Development Authority (BCDA)
- National Economic and Development Authority (NEDA)
- Department of Energy (DOE)
- Metropolitan Waterworks & Sewerage System (MWSS)
- Local Government Units (LGUs) pursuing bond-funded infrastructure initiatives
Research Methodology
Step 1: Identification of Key Variables
This stage involves mapping stakeholders across government agencies, EPC contractors, financiers, and investor groups. Extensive desk research and secondary data from industry reports underpin identification of critical market drivers, such as funding models, project typologies, and regional demand.
Step 2: Market Analysis and Construction
Historical data on infrastructure investment, project awards, sector breakdowns, and cost benchmarks are compiled and analyzed to construct a time‑series for market sizing. Infrastructure-specific metrics such as budget allocation by mode (transport, energy, etc.) and funding sources are assessed.
Step 3: Hypothesis Validation and Expert Consultation
Research hypotheses—e.g., that transport projects dominate investment share—are validated through interviews (phone/virtual) with industry stakeholders including government procurement officials, major EPC firms, and PPP center specialists, providing qualitative depth to quantitative data.
Step 4: Research Synthesis and Final Output
Data is triangulated with direct consultation with select EPC contractors and agencies to verify market projections, share of sub‑segments, and strategic insights. This synthesis ensures the report’s accuracy, robust segmentation, and actionable foresight.
- Executive Summary
- Research Methodology (Market Definitions and Assumptions, Abbreviations, Market Sizing Approach, Consolidated Research Approach, Primary and Secondary Data Sources, Limitations and Future Outlook)
- Definition and Scope
- Evolution and Development Landscape
- Infrastructure Investment Milestones and Programs (Build Better More, PPP Center Updates)
- Infrastructure Funding Sources (ODA, GAA, PPP, LGU Bond Issuance, Multilateral Aid)
- Regulatory Framework (NEDA Guidelines, ICC, DOTr, DPWH, PPP Code)
- Value Chain Analysis (Engineering Design, EPC, Project Financing, Operations)

- Growth Drivers [GDP share of construction sector, logistics cost reduction, urbanization rate, FDI inflows, demographic pressure, climate resilience projects, digital connectivity targets, disaster recovery and rehabilitation funds]
- Market Challenges [Right-of-way issues, permit and regulatory delays, financing risks, currency volatility, procurement inefficiencies, skill shortages, LGU coordination, climate and geographic risks]
- Opportunities [Green infrastructure financing, smart infrastructure rollout, ASEAN integration, infrastructure REITs, LGU project pipeline, agri-infra development, port and airport modernization, health infra PPP]
- Trends [Climate-resilient infrastructure design, digital twin integration, modular construction, EV-ready urban infra, data center power infra, decentralized water infra, blended finance instruments, ESG-linked infra bonds]
- Government Policies and Regulatory Landscape [Build Better More (BBM) program, PPP Code of the Philippines, NEDA Joint Memorandum Circulars, CREATE Act incentives, ODA Coordination Protocols]
- SWOT Analysis
- Stakeholder Ecosystem [Infra investors, LGUs, contractors, lenders, bilateral/multilateral donors, regulators, consultants]
- Porter’s Five Forces Analysis
- By Value, 2019-2024
- By Number of Projects Awarded, 2019-2024
- By Type of Projects Initiated (Roads, Airports, Railways, Water, ICT), 2019-2024
- By Source of Financing (Public Budget, PPP, ODA, Private Equity), 2019-2024
- By Sectoral Allocation (Transport, Water, Energy, Social Infrastructure, ICT), 2019-2024
- By Infrastructure Type [Value, No. of Projects, Budget Allocation]
Transportation Infrastructure
Water and Sanitation Infrastructure
Energy Infrastructure
Social Infrastructure (Schools, Hospitals)
ICT Infrastructure - By Funding Source [Value, Project Count]
General Appropriations Act (GAA)
Official Development Assistance (ODA)
Public-Private Partnership (PPP)
Multilateral Agencies (ADB, World Bank)
Private Sector Equity - By Implementing Agency [Value, No. of Projects]
Department of Public Works and Highways (DPWH)
Department of Transportation (DOTr)
Bases Conversion and Development Authority (BCDA)
Metropolitan Waterworks and Sewerage System (MWSS)
Local Government Units (LGUs) - By Region [Value, Budget Allocation]
Luzon
Visayas
Mindanao
NCR - By Project Lifecycle Stage [Project Count]
Conceptualization and Planning
Feasibility Study and Procurement
Construction and Development
Operations and Maintenance
Decommissioning and Rehabilitation
- Market Share by Value and Volume of Awarded Projects
- Competitive Positioning by Type of Project (Transport, Water, Social, Energy, ICT)
- Cross Comparison Parameters (Company Overview, Revenue from Infrastructure Projects, Financing Mechanisms, Project Execution Capabilities, EPC vs O&M Revenue Mix, Asset Lifecycle Management, Government Partnerships, Technology Adoption, Geographic Coverage, ESG Integration, Number of Ongoing Projects, Bid Success Rate)
- SWOT Analysis of Key Players
- Pricing and Cost Benchmarking (Cost/km road, per bed hospital cost, km rail line, MW energy project, ML/d water infra)
- Detailed Company Profiles
DMCI Holdings
Megawide Construction Corporation
EEI Corporation
San Miguel Corporation Infrastructure
Metro Pacific Tollways Corporation
First Balfour
Aboitiz InfraCapital
AlloyMTD Philippines
Makati Development Corporation (Ayala)
China Road and Bridge Corporation Philippines
Sta. Clara International Corp.
JFAP Construction
DDT Konstract Inc.
Atlantic Gulf & Pacific Company of Manila
Prime Metroline Infrastructure Holdings
- Public Sector Entities and Regulatory Compliance
- Private Investors and ROI Expectations
- Local Governments and Infrastructure Demand Mapping
- Urban vs Rural Infrastructure Utilization Patterns
- Sector-Specific Pain Points (Health, Transport, Water, etc.)
- Budgetary and Policy Alignment for Target Projects
- By Value, 2025-2030
- By Number of Projects, 2025-2030
- By Sectoral Pipeline, 2025-2030
- By Project Mode (PPP, ODA, GAA), 2025-2030
- By Region 2025-2030


 Request a Sample
 Ask for Customization
 Get a Quote
 Enquire Now