
 Download PDF
 Download PDF
Market Overview
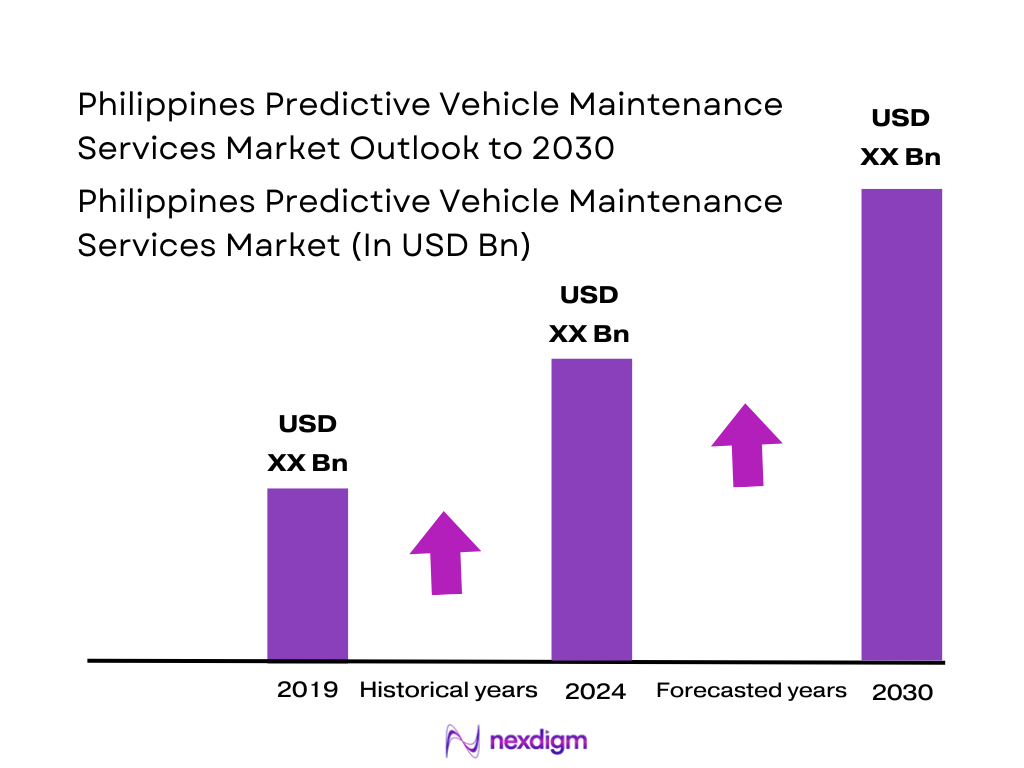
The Philippines predictive vehicle maintenance services market is valued at USD ~ million. This spend is being pulled by uptime-critical fleets that treat breakdowns as a service-level failure, not just a repair event—so budgets shift toward always-on telemetry, remote diagnostics, and “alert-to-work-order” automation that shortens mean time to repair and stabilizes vehicle availability.
Dominance is anchored in Metro Manila (NCR) and the CALABARZON–Central Luzon logistics belt, where fleet density, multi-stop delivery routes, and congestion-led wear accelerate the value of predictive interventions. Cebu and Davao follow as regional consolidation points for distribution and inter-island operations, where centralized fleet hubs benefit most from standardized maintenance workflows and vendor-managed analytics. In practice, the “where” is decided by depot concentration, service-network depth, and installer coverage rather than vehicle ownership alone.
Market Segmentation
By Service Layer
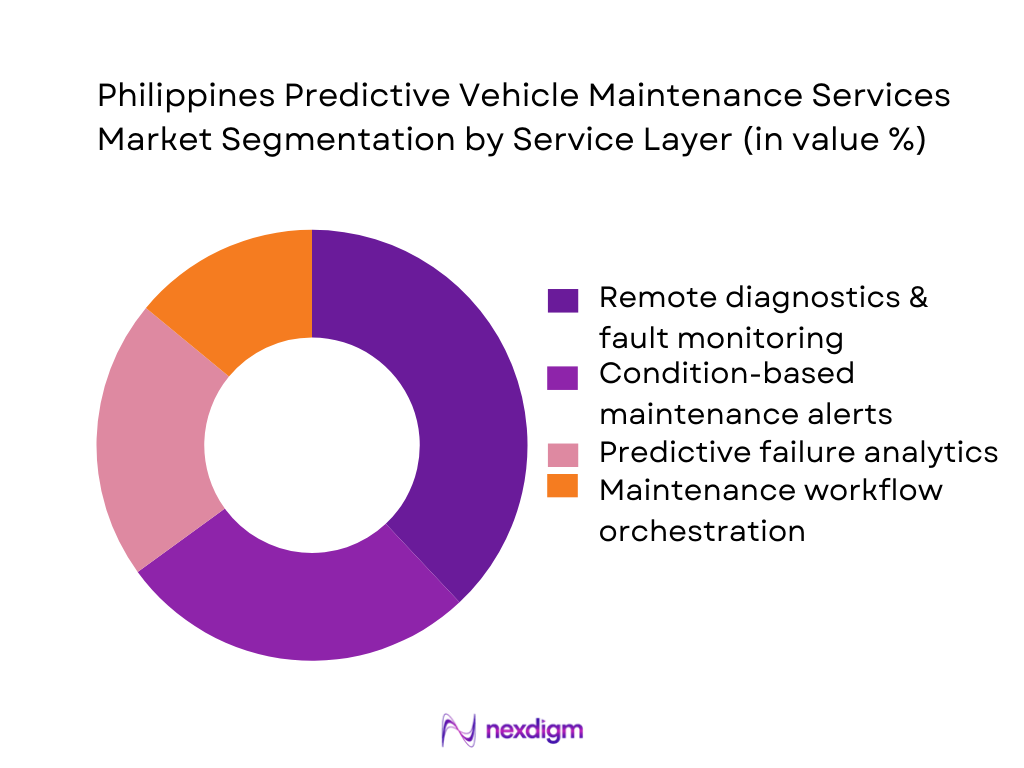
Philippines predictive vehicle maintenance services market is segmented by service layer into remote diagnostics & fault monitoring, condition-based maintenance alerts, predictive failure analytics, and maintenance workflow orchestration. Recently, remote diagnostics & fault monitoring tends to dominate deployments because it is the fastest-to-rollout layer across mixed fleets and creates immediate operational value: fewer “no-fault-found” workshop visits, earlier identification of repeat DTC patterns, and stronger maintenance discipline. It also acts as the data foundation for higher-order predictive models—fleets typically standardize telemetry and diagnostic hygiene first, then upgrade into predictive failure alerts and automated work orders once data quality stabilizes.
By End-Use Industry
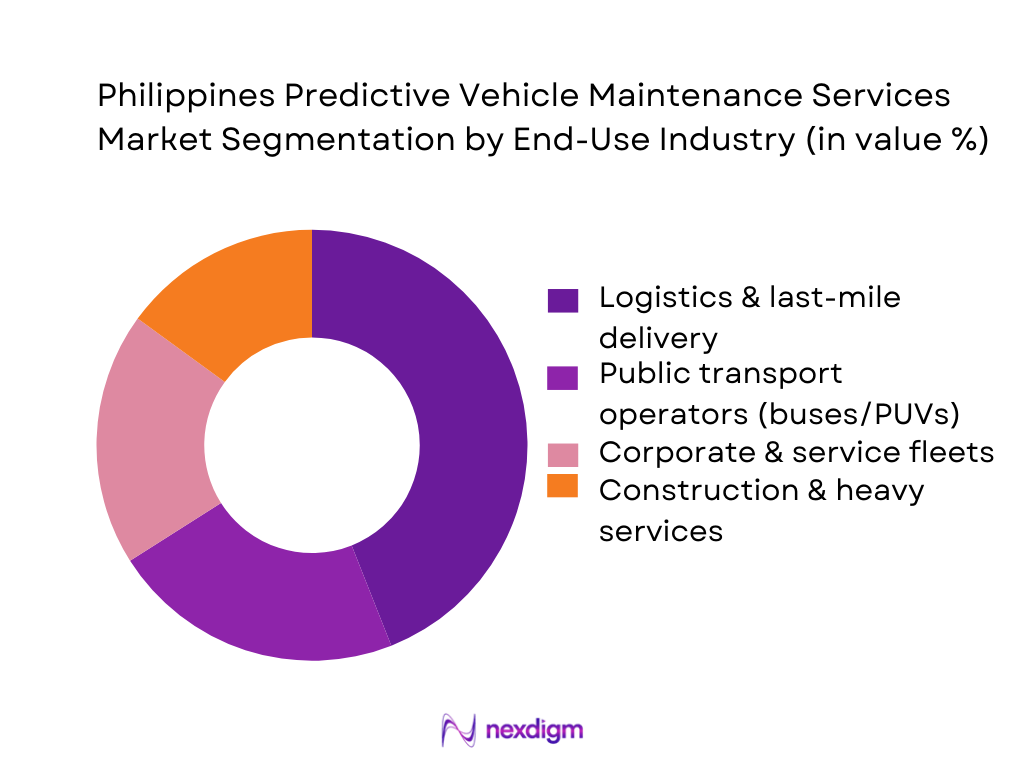
Philippines predictive vehicle maintenance services market is segmented by end-use industry into logistics & last-mile delivery, public transport operators, construction & heavy services, and corporate/service fleets. Logistics & last-mile delivery is typically the dominant demand pool because the business model is utilization-heavy: route compression, multiple delivery drops, driver rotation, and tight SLA windows magnify the cost of unplanned downtime. These operators adopt predictive maintenance as an operational control layer—linking vehicle health alerts to dispatch decisions, scheduling off-peak repairs, and preventing cascading failures. They also benefit from scalable rollouts through depot-based installation and centralized analytics.
Competitive Landscape
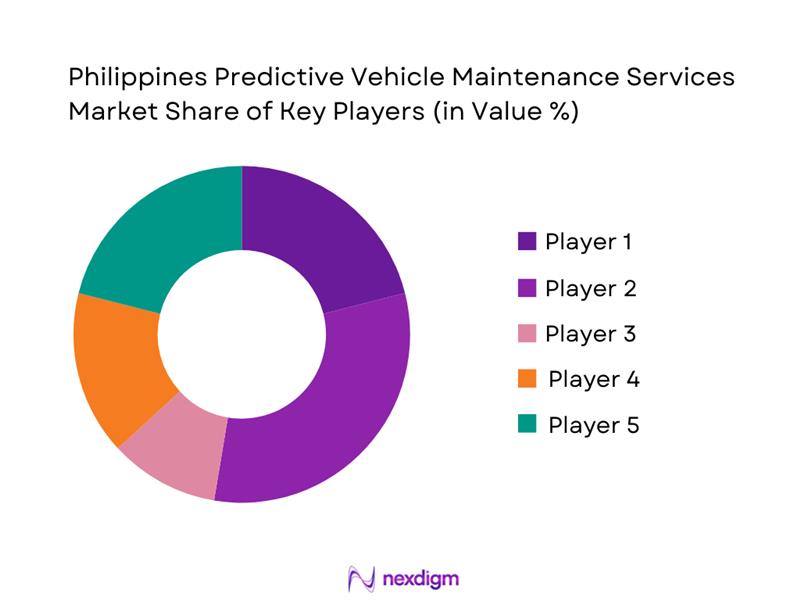
The Philippines predictive vehicle maintenance services market is led by a mix of global telematics platforms and local/regional integrators that execute installations, connectivity management, and fleet adoption. This structure creates a “two-layer competition”: platforms win on analytics depth and integrations, while local partners win on rollout capability, service responsiveness, and fleet-specific customization.
| Company | Est. Year | Headquarters | PH Go-to-Market Model | Predictive Maintenance Depth | Data Stack (OBD/CAN/J1939/Video) | Integration Readiness (APIs/ERP/TMS) | Local Support / Installer Footprint | Typical Best-Fit Fleets |
| Geotab | 2000 | Canada | ~ | ~ | ~ | ~ | ~ | ~ |
| Verizon Connect | 2001 | USA | ~ | ~ | ~ | ~ | ~ | ~ |
| Trimble Transportation | 1978 | USA | ~ | ~ | ~ | ~ | ~ | ~ |
| MiX Telematics | 1996 | South Africa | ~ | ~ | ~ | ~ | ~ | ~ |
| Cartrack | 2001 | Singapore | ~ | ~ | ~ | ~ | ` | ~ |
Philippines Predictive Vehicle Maintenance Services Market Dynamics & Strategic Analysis
Growth Drivers
Fleet uptime KPIs
Across Philippine logistics and service fleets, “uptime” is increasingly treated as a board-level KPI because the national operating context punishes unplanned downtime: the economy is large enough to sustain high daily dispatch intensity and a rapidly digitizing payments layer is making time-based customer promises more enforceable. As fleets scale, predictive maintenance becomes the practical way to shift from reactive workshop stops to condition-based scheduling—especially for multi-branch operators that need standardized reliability across routes, depots, and third-party service points. The country’s digital industries employment base also signals the depth of the technical workforce available to operate data-driven programs. In this environment, predictive maintenance is increasingly justified not as “tech spend,” but as operating-risk control: fewer roadside incidents, fewer missed drops, fewer penalties, and more stable asset availability across peak cycles.
E-commerce delivery pressure
E-commerce and adjacent digital trade are compressing delivery windows and raising the cost of failures, which directly amplifies the value of predictive maintenance. The Philippine Statistics Authority measured the digital economy at PHP ~ trillion and reported digital-industry employment at ~—both of which indicate sustained online consumption and platform-mediated commerce volumes that translate into more parcels, more route cycles, and more stop-and-go vehicle stress. On the payments side, the Bangko Sentral ng Pilipinas’ measurement shows digital retail payments reached 57.4 per 100 retail payment transactions by volume in the latest measurement year, reinforcing that a greater share of purchases are “trackable” and service-level expectations are harder to soften when deliveries slip. With GDP at USD ~ billion, the addressable business base for last-mile and middle-mile networks is large enough that delivery reliability becomes a competitive weapon—pushing fleets toward predictive, sensor-led maintenance programs that reduce late deliveries caused by mechanical failures rather than traffic alone.
Challenges
Data quality gaps
Predictive maintenance is only as strong as the data feeding it, and Philippine fleet data often breaks at the “ground truth” layer—work orders, parts replaced, failure codes, and consistent vehicle master records across branches. A major structural factor is the scale and heterogeneity of the downstream repair ecosystem: the DTI’s MSME statistics show ~ establishments in “Wholesale and Retail Trade; Repair of Motor Vehicles and Motorcycles,” including ~ micro enterprises and ~ small enterprises—numbers that imply high fragmentation and uneven digitization of service records. On the survey side, PSA’s ASPBI notes ~ establishments in-scope for this sector with ~ respondents. Meanwhile, macro scale is not the issue—GDP USD ~ billion and population ~ indicate enough demand—but operational consistency is: predictive models struggle when odometer readings are inconsistent, maintenance actions aren’t coded uniformly, or telematics events aren’t reconciled with workshop outcomes.
Mixed-brand fleets
Philippine fleets commonly evolve through incremental purchases, second-hand acquisitions, and program-driven modernization, creating mixed-brand, mixed-model, mixed-powertrain realities. This complicates predictive maintenance because sensor availability, diagnostic protocols (OBD variants), and parts interchangeability differ by OEM and model year—raising integration effort for a single “fleet health” view. The modernization landscape adds another layer: LTFRB-reported PUV consolidation scope of ~ units and consolidated count of ~ indicates that a massive base is being reorganized; such reorganizations typically pool units from multiple operators, often across different vehicle makes, into cooperative structures. On the macro side, population ~ and GDP USD ~ billion support a wide set of fleet use-cases, each with different duty cycles and OEM mixes—making “one-size” predictive rules unreliable without local tuning. As a result, vendors face higher onboarding friction: VIN normalization, compatible device selection, model-specific failure libraries, and workshop SOP harmonization across OEM ecosystems.
Opportunities
PUV modernization telemetry
Public transport modernization creates a structured channel for predictive maintenance adoption because modernization is not only about new vehicles—it is about reorganizing operators into entities that can manage fleet systems at scale. LTFRB consolidation reporting indicates a large formal scope: ~ PUV units in focus and ~ consolidated as of a referenced update; consolidation enables pooled procurement of telematics devices, unified maintenance SOPs, and shared analytics across routes. Safety pressure adds urgency: official-channel reporting cites ~ road accidents, ~ fatalities, and ~ vehicles involved in a single year—numbers that strengthen the policy and operator case for earlier fault detection through telemetry. With GDP at USD ~ billion and population ~, the scale of passenger movement and service demand makes reliability a public and political issue, not only an operator issue—positioning predictive maintenance as a modernization “assurance layer” that supports safer, more dependable service without relying on future-only claims.
Heavy fleet analytics
Heavy fleets benefit disproportionately from predictive maintenance because failure events are more disruptive, repair cycles are longer, and safety exposure is higher. The Philippines’ macro footprint—GDP USD ~ billion, inflation 3.2, and population ~ —supports large-scale construction, distribution, and public infrastructure activity where heavy assets are continuously utilized and downtime costs show up as delayed projects and missed deliveries. The service ecosystem is broad but uneven: DTI’s MSME statistics show ~ establishments in the broad trade/repair sector, implying that heavy-fleet operators must actively curate “capable bays” rather than assume uniform service readiness—making analytics-driven maintenance planning (parts forecasting, bay scheduling, failure-mode prioritization) especially valuable. Road-incident reporting reinforces why heavy fleets—due to mass and operating hours—face high governance attention; analytics that reduces brake, tire, and powertrain failure risk becomes a defensible, compliance-aligned investment justified by current operating conditions rather than future projections.
Future Outlook
Over the next five to six years, the Philippines predictive vehicle maintenance services market is expected to grow steadily as fleets push beyond “tracking” into health-driven operations—where maintenance becomes a planned production system rather than a reactive repair cycle. Adoption will accelerate through: deeper penetration of connected devices across mixed vehicle ages, stronger workflow automation linking alerts to work orders and parts planning, and bundling models that reduce friction for SMEs. The cited market growth trajectory is 13.91% CAGR.
Major Players
- Cartrack Philippines
- Geotab
- Novanco
- IZ Technologies
- V3 Smart Technologies
- Verizon Connect
- Trimble Transportation
- MiX Telematics
- Webfleet
- Samsara
- Fleet Complete
- Ruptela
- Tramigo
- Uffizio
Key Target Audience
- Fleet owners/operators
- Public transport operators and fleet cooperatives
- Construction, mining, and heavy equipment fleet managers
- Aftermarket service chains, workshops, and multi-brand maintenance networks
- Vehicle leasing and fleet financing companies
- Insurance providers
- Investments and venture capitalist firms
- Government and regulatory bodies
Research Methodology
Step 1: Identification of Key Variables
We build an ecosystem map of stakeholders (fleet operators, telematics vendors, workshops, insurers, OEM/dealers, connectivity partners). Desk research is combined with structured expert prompts to define variables that govern adoption: fleet size distribution, vehicle mix, uptime KPIs, maintenance maturity, and deployment models.
Step 2: Market Analysis and Construction
We compile historical and current market indicators from accessible secondary sources and validate service-layer definitions (diagnostics vs predictive vs workflow). We map revenue pools by commercial model (SaaS, managed services, device bundling) and align them with the Philippines fleet-management spending baseline.
Step 3: Hypothesis Validation and Expert Consultation
Hypotheses on adoption barriers (data quality, mixed fleets, workshop fragmentation) and buying triggers (downtime cost, SLA failures, safety) are validated through CATIs with fleet operations heads, platform partners, and workshop managers to confirm what is actually budgeted and renewed.
Step 4: Research Synthesis and Final Output
We triangulate findings across vendor inputs, fleet interviews, and market baselines to finalize sizing logic, growth outlook, competitive benchmarking, and segmentation. Outputs are stress-tested through sensitivity checks on penetration, churn, and attach rates of predictive modules to tracking subscriptions.
- Executive Summary
- Research Methodology (Market definition & inclusions/exclusions, assumptions & abbreviations, primary interview map, data triangulation approach, market sizing logic, forecasting model inputs, sensitivity checks, limitations)
- Definition, Scope and Service Boundaries
- Evolution from Preventive to Predictive Maintenance in PH Fleets
- Business Cycle
- Value Chain & Operating Model
- Ecosystem Map

- Growth Drivers
fleet uptime KPIs
e-commerce delivery pressure
aging vehicle parc
route congestion wear
safety & compliance push - Challenges
data quality gaps
mixed-brand fleets
workshop fragmentation
change management
connectivity blind spots - Opportunities
PUV modernization telemetry
heavy fleet analytics
insurer-led programs
EV fleet predictive servicing
parts forecasting - Trends
OEM embedded shift
AI alert-to-action automation
video+diagnostics fusion
predictive parts planning
API-first ecosystems - Government/Regulatory Environment
- Porter’s Five Forces
- SWOT
- By Value, 2019-2024
- By Volume, 2019-2024
- Installed Base & Active Connected Fleet Vehicles, 2019-2024
- Revenue Mix, 2019-2024
- By Service Layer / Analytics Type (in Value %)
Remote Diagnostics
Condition-Based Maintenance
Predictive Failure Alerts
Remaining Useful Life / Asset Health Scoring
Maintenance Workflow Automation - By Vehicle Type (in Value %)
Light Commercial Vehicles
Medium & Heavy Trucks
Buses & Public Utility Vehicles
Construction/Mining Equipment Fleets
Corporate & Service Fleets - By End-Use Industry (in Value %)
Logistics & Express / E-commerce Delivery
Manufacturing & Industrial Distribution
Construction, Aggregates, Mining & Heavy Services
Public Transport Operators & Cooperatives
Utilities, Telecom Field Service & Government Fleets - By Deployment & Commercial Model (in Value %)
SaaS Subscription
Managed Fleet Intelligence
OEM/Dealer-Integrated Programs
Insurer/Financier-Linked Programs
Hybrid - By Data Architecture & Telemetry Source (in Value %)
Plug-and-Play OBD Devices
Hardwired CAN/J1939 Devices
OEM Embedded Telematics
Video Telematics + Diagnostics
Multi-Source Fusion - By Region / Operating Base (in Value %)
NCR / Metro Manila
CALABARZON
Central Luzon
Central Visayas
Davao Region / Mindanao Growth Corridors
- Competitive Positioning Matrix
- Cross Comparison Parameters (Vehicle Data Depth, Predictive Accuracy & Model Maturity, Alert-to-Action Workflow Strength, Integration Readiness, On-Ground Execution Capability, Compliance & Governance Readiness, Connectivity Resilience, Commercial Flexibility)
- Competitive Benchmarking Dashboards
- Company SWOT Snapshot
- Detailed Profiles of Major Companies
Cartrack Philippines
Geotab
Novanco
IZ Technologies
V3 Smart Technologies
Verizon Connect
Trimble Transportation
MiX Telematics
Webfleet
Samsara
Fleet Complete
Ruptela
Tramigo
Uffizio
- Fleet Segments’ Maintenance Maturity
- Pain Points
- Buying Journey
- Vendor Evaluation Scorecard
- Contracting Models
- By Value, 2025-2030
- By Volume, 2025-2030
- Installed Base & Active Connected Fleet Vehicles, 2025-2030
- Revenue Mix, 2025-2030


 Request a Sample
 Ask for Customization
 Get a Quote
 Enquire Now