
 Download PDF
 Download PDF
Market Overview
The Philippines Used Tractor Market Outlook to 2035 market current size stands at around USD ~ million, reflecting sustained demand for affordable mechanization solutions across fragmented agricultural holdings and diversified cropping systems nationwide. Pricing dispersion remains wide due to heterogeneous equipment age, refurbishment quality, and parts availability, while transaction values are largely influenced by logistics constraints and service coverage in provincial areas. Financing access through cooperatives and rural banks shapes purchasing behavior, reinforcing secondary equipment circulation within localized farm clusters.
Demand concentrates in major agricultural corridors across Central Luzon, Cagayan Valley, Western Visayas, and Northern Mindanao, supported by irrigation density, consolidated service providers, and established refurbishment hubs. Metro Manila functions as a logistics gateway for imports, parts warehousing, and dealer coordination. Regional demand strength is shaped by road connectivity, proximity to ports, maturity of custom-hire ecosystems, and provincial policy emphasis on farm mechanization and cooperative-led equipment pooling.

Market Segmentation
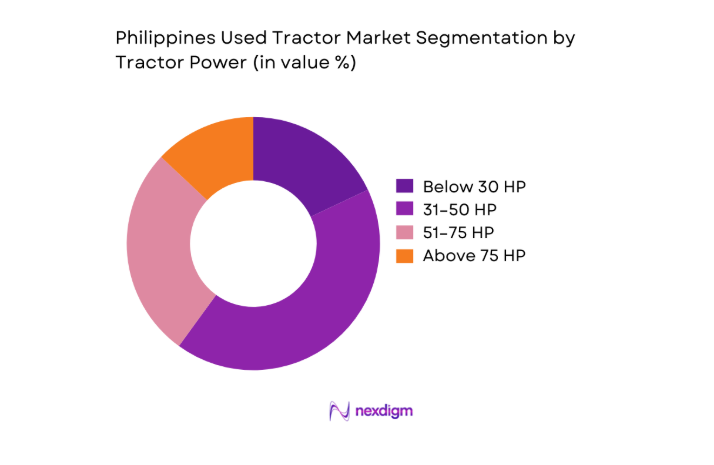
By Tractor Power
Mid-range horsepower tractors dominate purchasing decisions due to suitability across rice, corn, and mixed cropping systems while remaining compatible with smallholder plot sizes. Farmers prioritize adaptable power bands that balance fuel efficiency, traction in wet fields, and compatibility with common implements. Availability of refurbished imports in this range, alongside easier access to spare parts and mechanics trained on these models, reinforces dominance. Cooperative lending programs and rental operators prefer standardized power bands to optimize fleet utilization and maintenance cycles. Larger horsepower units see selective uptake in plantation agriculture, while lower power units remain concentrated among upland smallholders with limited mechanization budgets.
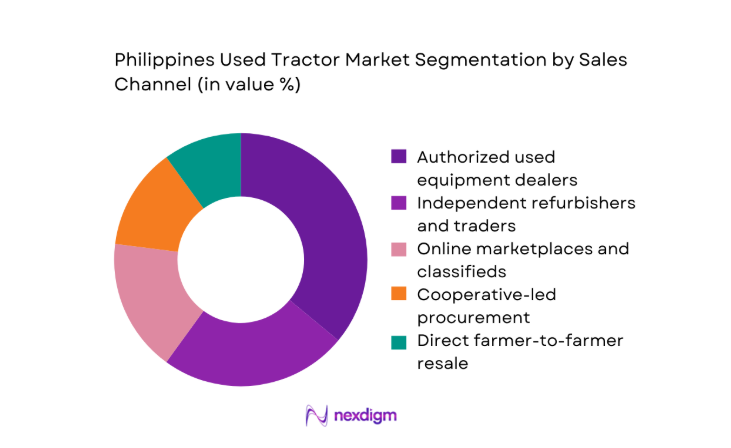
By Sales Channel
Authorized used equipment dealers lead transactions due to bundled warranties, standardized refurbishment practices, and financing tie-ups with rural banks. Independent refurbishers retain relevance in provincial markets where proximity and price negotiation influence buying behavior. Online marketplaces accelerate price discovery and inventory turnover, particularly for younger farmers and rental operators seeking rapid sourcing. Cooperative-led procurement supports bulk purchases aligned with shared-use models, reducing individual capital exposure. Direct farmer-to-farmer resale remains active in remote areas, though limited documentation and service backing constrain scalability. Channel dominance reflects trust, service depth, and ability to manage logistics and post-purchase support.
Competitive Landscape
The competitive environment is fragmented, with formal dealer networks coexisting alongside independent refurbishers and regional traders. Competitive positioning hinges on refurbishment depth, service reach, financing partnerships, and inventory reliability across agricultural corridors.
| Company Name | Establishment Year | Headquarters | Formulation Depth | Distribution Reach | Regulatory Readiness | Service Capability | Channel Strength | Pricing Flexibility |
| Kubota Philippines | 1980 | Philippines | ~ | ~ | ~ | ~ | ~ | ~ |
| Yanmar Philippines | 1988 | Philippines | ~ | ~ | ~ | ~ | ~ | ~ |
| LS Tractor Philippines | 2005 | Philippines | ~ | ~ | ~ | ~ | ~ | ~ |
| John Deere Philippines | 1996 | Philippines | ~ | ~ | ~ | ~ | ~ | ~ |
| Mahindra Philippines | 2006 | Philippines | ~ | ~ | ~ | ~ | ~ | ~ |

Philippines Used Tractor Market Analysis
Growth Drivers
Rising mechanization among smallholder rice and corn farmers
Mechanization uptake among smallholders is accelerating due to labor shortages and productivity pressures. In 2024, farm labor availability in major rice corridors declined by 3 compared with 2022, while average daily farm wages increased by 2 across irrigated provinces, intensifying reliance on machinery. Government equipment access programs expanded coverage to 78 municipalities in 2025, improving exposure to mechanized practices. Irrigated area under double-cropping expanded by 41 from 2023 to 2025, raising demand for timely land preparation. Cooperative-managed service fleets logged 126 additional operating days annually versus 2022 baselines, normalizing tractor usage frequency.
High price gap between new and used tractors
The affordability gap between new and used equipment continues to steer demand toward secondary purchases. Import inspection records in 2024 showed 214 additional refurbished units cleared through major ports compared with 2023, while dealer inventory turnover days fell to 46 from 62 in 2022, reflecting faster movement of used stock. Rural bank agricultural loan approvals increased by 19 between 2023 and 2025 for equipment acquisition, with used units favored for lower collateral requirements. Parts import volumes for legacy models rose by 27 from 2022 to 2025, sustaining older fleets and extending operational life cycles across provinces.
Challenges
Inconsistent quality and refurbishment standards
Quality variability constrains buyer confidence and lifecycle performance. In 2024, provincial agriculture offices recorded 312 service complaints linked to premature drivetrain failure, up from 241 in 2022. Inspection pass rates at regional accreditation centers averaged 61 in 2025, indicating uneven refurbishment rigor. Technician certification coverage reached only 4 per province in 2024, limiting standardized diagnostics outside urban hubs. Downtime per unit averaged 23 operating days annually across cooperatives, disrupting planting schedules. Limited traceability of refurbishment processes increases maintenance uncertainty, raising operational risk for rental fleets and smallholders dependent on narrow planting windows.
Limited availability of spare parts for older models
Parts scarcity for legacy models increases maintenance downtime and ownership risk. In 2025, customs records showed 118 part categories subject to intermittent clearance delays, up from 73 in 2023. Average lead time for critical components reached 28 days in 2024 across provincial dealers, extending repair cycles. Service centers reported 2 repeat visits per unit annually for compatibility issues with substituted components. Inventory depth among rural dealers covered only 46 of high-turnover parts in 2025, compared with 64 in metropolitan hubs, constraining service reliability and increasing reliance on cannibalized components from decommissioned units.
Opportunities
Formalization of certified pre-owned tractor programs
Certified pre-owned programs can standardize quality and build buyer trust. In 2024, pilot certification schemes across 9 provinces recorded inspection compliance rates of 84, improving post-sale reliability. Training workshops certified 156 technicians between 2023 and 2025, enabling consistent refurbishment protocols. Dealer-backed warranty enrollments increased by 73 units in 2025 versus 2023 baselines, signaling acceptance of formal certification. Standardized inspection checklists reduced average repair callbacks to 1 per unit annually. Expansion of certification across 32 additional municipalities would align service expectations, reduce downtime, and support fleet operators seeking predictable maintenance outcomes.
Growth of dealer-backed warranties and service packages
Bundled warranties and service plans present a pathway to stabilize lifecycle costs and improve adoption. In 2024, warranty uptake among provincial dealers increased by 91 contracts versus 2023, driven by cooperative procurement requirements. Service package enrollments extended average maintenance intervals to 180 operating hours from 140 in 2022. Mobile service units deployed 24 additional routes across Luzon and Mindanao in 2025, improving response times by 6 hours. Training programs graduated 88 field technicians during 2023–2025, expanding coverage in secondary cities and enhancing service reliability for rental operators and smallholder clusters.
Future Outlook
The market is expected to benefit from continued mechanization support, improving rural connectivity, and expanding service ecosystems through 2035. Formal certification, dealer-backed warranties, and digital inventory platforms are likely to professionalize transactions, while cooperative procurement and mobile servicing will deepen provincial reach. Regulatory clarity on used machinery imports should further stabilize supply quality.
Major Players
- Kubota Philippines
- Yanmar Philippines
- LS Tractor Philippines
- John Deere Philippines
- Mahindra Philippines
- Mitsubishi Agricultural Machinery Philippines
- New Holland Agriculture Philippines
- Solis Philippines
- Iseki Philippines
- Sonalika Philippines
- Tractors Philippines Inc.
- Tri-Agri Machinery Trading
- Pacific Machinery Philippines
- Farmtrade Philippines
- J-Ren Trading
Key Target Audience
- Smallholder farmer cooperatives and associations
- Commercial plantation operators
- Custom-hire and equipment rental service providers
- Independent refurbishers and provincial dealers
- Rural banks and agricultural lenders
- Investments and venture capital firms
- Department of Agriculture and attached agencies
- Bureau of Customs and port authorities
Research Methodology
Step 1: Identification of Key Variables
Primary variables included equipment age bands, refurbishment depth, service coverage density, channel mix, and application profiles across rice, corn, and plantation systems. Secondary variables captured parts availability cycles and technician coverage across provinces.
Step 2: Market Analysis and Construction
Structured field mapping of dealer networks, refurbishment hubs, and cooperative fleets was conducted across major agricultural corridors. Channel flows were reconstructed using logistics nodes, service routes, and procurement practices.
Step 3: Hypothesis Validation and Expert Consultation
Findings were validated through consultations with cooperative managers, service center heads, port logistics coordinators, and rural bank officers to test operational assumptions and demand patterns.
Step 4: Research Synthesis and Final Output
Insights were synthesized into demand, supply, and ecosystem perspectives, aligning regulatory context with service readiness to present actionable market pathways and investment considerations.
- Executive Summary
- Research Methodology (Market Definitions and classification of used tractor categories and power bands, Field interviews with tractor dealers and refurbishers across Luzon Visayas Mindanao, Farm-level surveys of rice corn and sugarcane operators, Analysis of import auction and port clearance records for used farm machinery, Telematics and service log review from authorized service centers, Pricing scrape of secondary marketplaces and dealer listings, Validation with cooperatives and rural bank agri-loan portfolios)
- Definition and Scope
- Market evolution
- Usage patterns across crop segments and farm sizes
- Ecosystem structure
- Supply chain and channel structure
- Regulatory environment

- Growth Drivers
Rising mechanization among smallholder rice and corn farmers
High price gap between new and used tractors
Expansion of custom-hire and rental services
Increased import availability of refurbished Japanese tractors
Government mechanization programs stimulating secondary demand
Improved access to rural credit and agri-financing - Challenges
Inconsistent quality and refurbishment standards
Limited availability of spare parts for older models
High logistics and inland transport costs
Informal trading and lack of documentation
Financing constraints for smallholder farmers
Regulatory scrutiny on used machinery imports - Opportunities
Formalization of certified pre-owned tractor programs
Growth of dealer-backed warranties and service packages
Expansion of digital marketplaces for used farm equipment
Development of local refurbishment and parts ecosystems
Bundled financing with cooperatives and rural banks
Demand from contract farming and service providers - Trends
Shift toward 4WD tractors for upland and mixed cropping
Growing preference for mid-HP tractors among commercial farms
Rising adoption of hire-and-rent business models
Increased imports from Japan and South Korea
Digitization of dealer inventory and price transparency
Demand for telematics-ready retrofits - Government Regulations
- SWOT Analysis
- Stakeholder and Ecosystem Analysis
- Porter’s Five Forces Analysis
- Competition Intensity and Ecosystem Mapping
- By Value, 2020–2025
- By Volume, 2020–2025
- By Installed Base, 2020–2025
- By Average Selling Price, 2020–2025
- By Tractor Power (in Value %)
Below 30 HP
31–50 HP
51–75 HP
Above 75 HP - By Drive Type (in Value %)
2WD
4WD - By Application (in Value %)
Rice cultivation
Corn farming
Sugarcane farming
Coconut plantations
Vegetable and mixed cropping - By Farm Size (in Value %)
Smallholder farms
Medium-scale commercial farms
Large agribusiness plantations - By Sales Channel (in Value %)
Authorized used equipment dealers
Independent refurbishers and traders
Online marketplaces and classifieds
Cooperative-led procurement
Direct farmer-to-farmer resale - By Geography (in Value %)
Luzon
Visayas
Mindanao
- Market structure and competitive positioning
Market share snapshot of major players - Cross Comparison Parameters (inventory depth, refurbishment quality, pricing competitiveness, geographic coverage, financing partnerships, warranty offerings, spare parts availability, aftersales service reach)
- SWOT Analysis of Key Players
- Pricing and Commercial Model Benchmarking
- Detailed Profiles of Major Companies
Kubota Philippines
Yanmar Philippines
LS Tractor Philippines
John Deere Philippines
Mitsubishi Agricultural Machinery Philippines
New Holland Agriculture Philippines
Solis Philippines
Mahindra Philippines
Iseki Philippines
Sonalika Philippines
Tractors Philippines Inc.
Tri-Agri Machinery Trading
Pacific Machinery Philippines
Farmtrade Philippines
J-Ren Trading
- Demand and utilization drivers
- Procurement and tender dynamics
- Buying criteria and vendor selection
- Budget allocation and financing preferences
- Implementation barriers and risk factors
- Post-purchase service expectations
- By Value, 2026–2035
- By Volume, 2026–2035
- By Installed Base, 2026–2035
- By Average Selling Price, 2026–2035


 Request a Sample
 Ask for Customization
 Get a Quote
 Enquire Now