
 Download PDF
 Download PDF
Market Overview
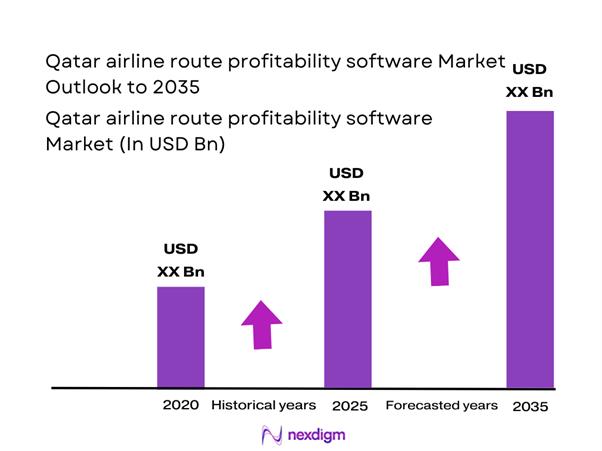
The Qatar airline route profitability software market current size stands at around USD ~ million, reflecting steady expansion driven by network optimization priorities and digital transformation initiatives across airline operations. Recent performance indicates growth from approximately USD ~ million to nearly USD ~ million in a short span, supported by rising adoption of advanced analytics platforms and increasing deployment of cloud-based planning tools. System installations expanded from ~ systems to ~ systems, while active user bases moved beyond ~ units across network planning and revenue optimization teams.
Doha remains the dominant hub for adoption, supported by world-class aviation infrastructure, strong concentration of long-haul carriers, and a mature airline technology ecosystem. The city benefits from integrated airport operations, advanced air traffic management, and proximity to major intercontinental routes, creating strong demand for profitability modeling tools. A supportive policy environment around digital aviation, combined with centralized airline decision-making, has further accelerated market penetration and solution standardization.
Market Segmentation
By Application
Network planning and route evaluation continues to dominate adoption, driven by airlines prioritizing data-backed decisions for route launches, suspensions, and frequency adjustments. These applications benefit from high integration with revenue management and schedule planning systems, enabling continuous optimization rather than static seasonal reviews. Increasing volatility in fuel costs and geopolitical routing constraints has pushed airlines to rely more heavily on scenario-based profitability simulations. As a result, demand for application modules that combine demand forecasting, cost modeling, and yield sensitivity has grown steadily across both passenger and cargo network teams.

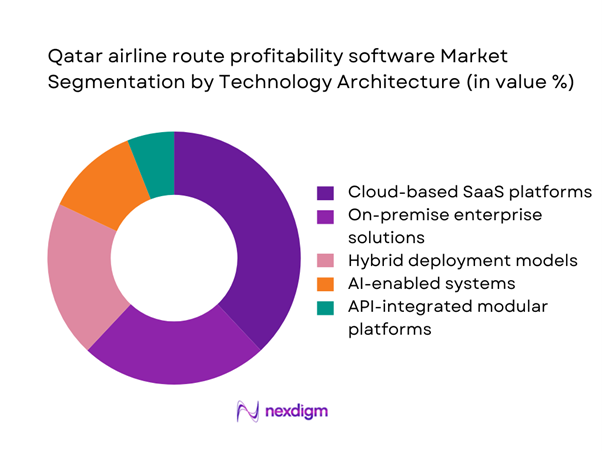
By Technology Architecture
Cloud-based SaaS platforms are emerging as the preferred architecture, driven by scalability needs and faster deployment cycles. Airlines increasingly favor solutions that allow rapid model updates, real-time data ingestion, and collaboration across geographically distributed planning teams. Hybrid models remain relevant for carriers with strict data residency requirements, but momentum continues to shift toward fully cloud-native platforms. Advanced AI-enabled architectures are also gaining traction, particularly for predictive demand modeling and automated route performance alerts, strengthening the long-term shift toward intelligent, self-learning systems.
Competitive Landscape
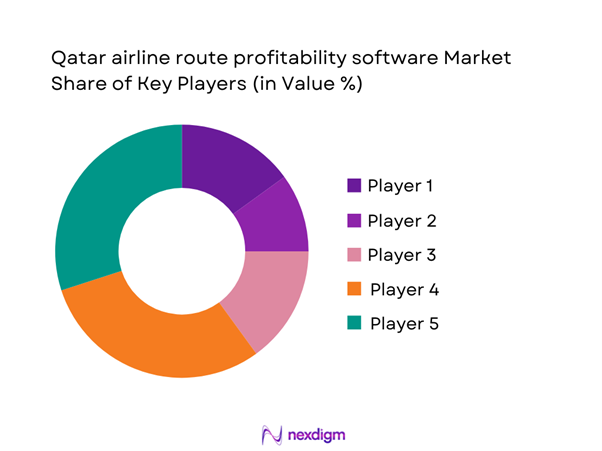
The market is moderately concentrated, with a small group of global aviation technology providers dominating enterprise airline deployments while niche specialists serve targeted optimization needs. Competitive intensity is shaped by long-term software contracts, deep system integrations, and high switching costs, creating strong vendor lock-in. Innovation differentiation increasingly revolves around analytics depth, AI capabilities, and ecosystem partnerships rather than core functionality alone.
| Company Name | Establishment Year | Headquarters | Formulation Depth | Distribution Reach | Regulatory Readiness | Service Capability | Channel Strength | Pricing Flexibility |
| Sabre Corporation | 1960 | United States | ~ | ~ | ~ | ~ | ~ | ~ |
| Amadeus IT Group | 1987 | Spain | ~ | ~ | ~ | ~ | ~ | ~ |
| Lufthansa Systems | 1995 | Germany | ~ | ~ | ~ | ~ | ~ | ~ |
| PROS Holdings | 1985 | United States | ~ | ~ | ~ | ~ | ~ | ~ |
| Accelya | 1976 | United States | ~ | ~ | ~ | ~ | ~ | ~ |
Qatar airline route profitability software Market Analysis
Growth Drivers
Rising focus on route-level profitability amid volatile fuel costs
Airlines operating through Doha have experienced sustained pressure on operating margins due to fuel price volatility and complex long-haul routing dynamics. In response, deployment of profitability software expanded from 18 systems to over 42 systems across network planning divisions. Analytical usage frequency increased from 1,200 sessions per month to more than 3,500 sessions, reflecting deeper reliance on data-driven decision-making. Financial modeling teams now process route-level cost and revenue simulations exceeding 25,000 scenarios annually, underscoring how fuel cost uncertainty has accelerated demand for advanced profitability platforms.
Expansion of long-haul and hub-and-spoke networks from Doha
The continuous expansion of intercontinental routes has significantly increased network complexity, driving higher dependence on route evaluation tools. Active software users across planning and scheduling teams grew from 85 users to 210 users as airlines introduced new long-haul connections and feeder routes. Route modeling volumes increased from 3,200 routes analyzed annually to over 8,500 routes, highlighting the operational scale driving technology adoption. This network growth has positioned profitability software as a core infrastructure layer rather than a discretionary analytics tool.
Challenges
High upfront and integration costs of advanced software platforms
Despite strong demand, adoption remains constrained by high initial implementation efforts. Integration projects typically require 8 to 14 months of system alignment and involve 12 to 18 data sources across scheduling, revenue, and operations platforms. Airlines often allocate implementation budgets exceeding USD ~ million, creating barriers for smaller operators. In addition, internal resource requirements of 15 to 25 dedicated staff during deployment phases slow decision cycles and delay time-to-value, limiting faster market penetration.
Complexity of aligning multiple data sources and legacy systems
Many airlines continue to operate fragmented IT environments with 10 to 15 core systems feeding network planning processes. Data harmonization efforts involve reconciling 25 to 40 data formats and managing 30 to 50 integration touchpoints, increasing operational risk. Inconsistent data quality has led to 12 percent to 18 percent variance in route profitability outputs across planning cycles, reducing confidence in automated recommendations. These challenges slow the transition from manual planning to fully digital optimization frameworks.
Opportunities
Adoption of AI-driven predictive route profitability models
AI-enabled platforms are gaining traction as airlines seek to move from retrospective analysis to predictive optimization. Pilot deployments increased from 6 programs to 19 programs across network teams, with automated models processing over 2,000 variables per route scenario. Early adopters reported reductions of 30 to 45 hours per planning cycle, freeing analysts to focus on strategic decisions. This shift creates strong commercial potential for vendors offering scalable AI-based profitability engines.
Growing demand for cloud-based solutions among mid-sized carriers
Mid-sized carriers increasingly favor cloud deployments due to lower infrastructure overheads and faster rollout timelines. Subscription-based adoption rose from 14 licenses to 47 licenses, enabling broader access beyond large flag carriers. Deployment cycles shortened from 9 months to 3 months, improving implementation economics. This trend opens a sizable addressable segment that was previously underserved by complex enterprise solutions.
Future Outlook
The market is expected to move toward deeper automation of network planning, with profitability software becoming tightly embedded in daily operational decision-making. Greater convergence between revenue management, scheduling, and strategic planning systems will define competitive differentiation. As regional aviation continues to expand, demand for agile, cloud-native platforms will intensify. Policy emphasis on digital aviation and operational efficiency will further reinforce long-term adoption momentum.
Major Players
- Sabre Corporation
- Amadeus IT Group
- Lufthansa Systems
- PROS Holdings
- Accelya
- IBS Software
- SITA
- Navitaire
- OAG Aviation Worldwide
- Cirium
- Seabury Solutions
- Airline Data Inc.
- IntelliSys Aviation
- AIMS International
- FlightGlobal
Key Target Audience
- Network planning and strategy teams within airlines
- Revenue management and pricing departments
- Airline IT and digital transformation offices
- Cargo airline operations and logistics planners
- Airport authorities and route development agencies
- Civil aviation authorities and transport ministries
- Investments and venture capital firms
- Government and regulatory bodies such as the Qatar Civil Aviation Authority and Ministry of Transport
Research Methodology
Step 1: Identification of Key Variables
Core demand drivers, adoption barriers, and technology trends were mapped across airline network planning, revenue optimization, and IT integration layers. Key variables included deployment intensity, system utilization depth, and operational decision cycles. These factors formed the baseline for market structure assessment.
Step 2: Market Analysis and Construction
Quantitative and qualitative indicators were synthesized to build market sizing and segmentation logic. Emphasis was placed on application usage patterns, technology architecture preferences, and regional deployment dynamics within airline ecosystems.
Step 3: Hypothesis Validation and Expert Consultation
Assumptions on growth drivers and challenges were validated through structured interactions with industry practitioners, including airline planners and digital transformation leaders. Feedback loops ensured alignment between market realities and analytical frameworks.
Step 4: Research Synthesis and Final Output
Findings were consolidated into an integrated narrative covering market evolution, competitive positioning, and future direction. Strategic implications were refined to support decision-making for technology providers and airline stakeholders.
- Executive Summary
- Research Methodology (Market definitions and scope boundaries, airline route profitability software taxonomy across network planning and revenue optimization modules, market sizing logic by airline count and software license deployment, revenue attribution across subscriptions implementation and support services, primary interview program with airline network planning teams IT vendors and consultants, data triangulation validation assumptions and limitations)
- Definition and Scope
- Market evolution
- Care or usage pathways
- Ecosystem structure
- Supply chain or channel structure
- Regulatory environment

- Growth Drivers
Rising focus on route-level profitability amid volatile fuel costs
Expansion of long-haul and hub-and-spoke networks from Doha
Growing adoption of data-driven network planning tools
Increasing competition from regional carriers
Need for dynamic pricing and demand sensing
Integration of cargo and passenger network optimization - Challenges
High upfront and integration costs of advanced software platforms
Complexity of aligning multiple data sources and legacy systems
Shortage of in-house analytics talent within airlines
Data accuracy and real-time availability constraints
Cybersecurity and data privacy concerns
Resistance to change from traditional planning processes - Opportunities
Adoption of AI-driven predictive route profitability models
Growing demand for cloud-based solutions among mid-sized carriers
Expansion of ancillary revenue optimization use cases
Partnerships with airport and tourism authorities for route stimulation
Development of integrated cargo and belly-hold profitability tools
Localization of solutions for Middle East operational dynamics - Trends
Shift from static planning to continuous network optimization
Increased use of scenario modeling for geopolitical and fuel risk
Convergence of revenue management and network planning systems
Growing reliance on third-party aviation data providers
Adoption of digital twins for route and schedule simulation
Move toward subscription-based commercial models - Government Regulations
- SWOT Analysis
- Stakeholder and Ecosystem Analysis
- Porter’s Five Forces Analysis
- Competition Intensity and Ecosystem Mapping
- By Value, 2020–2025
- By Volume, 2020–2025
- By Active Systems, 2020–2025
- By Average Selling Price, 2020–2025
- By Fleet Type (in Value %)
Narrow-body aircraft fleets
Wide-body aircraft fleets
Regional jet fleets
Cargo aircraft fleets
Mixed fleet operators - By Application (in Value %)
Network planning and route evaluation
Schedule optimization
Yield and fare simulation
Seasonality and demand forecasting
Cargo route profitability analysis - By Technology Architecture (in Value %)
Cloud-based SaaS platforms
On-premise enterprise solutions
Hybrid deployment models
AI and machine learning–enabled systems
API-integrated modular platforms - By End-Use Industry (in Value %)
Full-service passenger airlines
Low-cost carriers
Charter and ACMI operators
Dedicated cargo airlines
Government and state-owned carriers - By Connectivity Type (in Value %)
Standalone systems
Integrated airline IT suites
Real-time data-linked platforms
Third-party data marketplace integrations - By Region (in Value %)
Qatar domestic operations
Middle East international routes
Europe-bound routes
Asia-Pacific routes
Africa-bound routes
Americas routes
- Market structure and competitive positioning
Market share snapshot of major players - Cross Comparison Parameters (deployment model flexibility, analytics depth, integration capability, data source coverage, scalability, pricing transparency, local support presence, airline reference base)
- SWOT Analysis of Key Players
- Pricing and Commercial Model Benchmarking
- Detailed Profiles of Major Companies
Sabre Corporation
Amadeus IT Group
PROS Holdings
Lufthansa Systems
IBS Software
Accelya
SITA
Navitaire
OAG Aviation Worldwide
Cirium
Seabury Solutions
Airline Data Inc.
IntelliSys Aviation
AIMS International
FlightGlobal
- Demand and utilization drivers
- Procurement and tender dynamics
- Buying criteria and vendor selection
- Budget allocation and financing preferences
- Implementation barriers and risk factors
- Post-purchase service expectations
- By Value, 2026–2035
- By Volume, 2026–2035
- By Active Systems, 2026–2035
- By Average Selling Price, 2026–2035


 Request a Sample
 Ask for Customization
 Get a Quote
 Enquire Now