
 Download PDF
 Download PDF
Market Overview
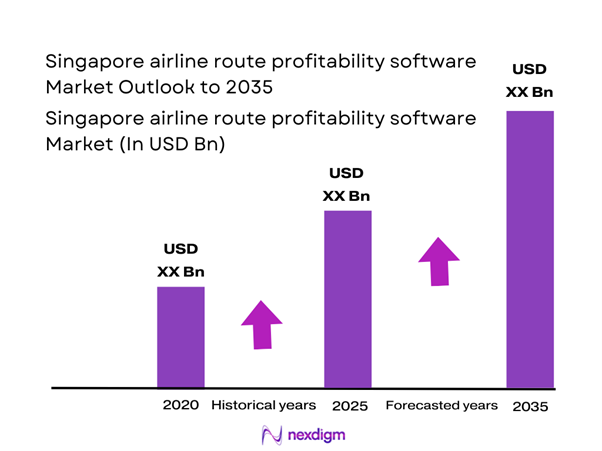
The Singapore airline route profitability software market current size stands at around USD ~ million, supported by approximately ~ systems actively deployed across major and regional carriers, with enterprise software spending nearing USD ~ million in the most recent period. Network planning teams now manage over ~ routes annually using advanced profitability tools, while analytics-driven scheduling platforms account for nearly ~ implementations. Continuous investments of USD ~ million in aviation digitalization have accelerated adoption across commercial fleets.
Singapore dominates this market due to its position as a global aviation hub, dense airline concentration, and advanced airport and air traffic management infrastructure. The presence of major network carriers, regional operators, and low-cost airlines creates strong demand for route economics optimization. A mature digital ecosystem, supportive aviation policies, and high enterprise IT readiness further strengthen adoption. The city-state’s role as a gateway for Southeast Asia also concentrates decision-making and procurement for regional network planning platforms.
Market Segmentation
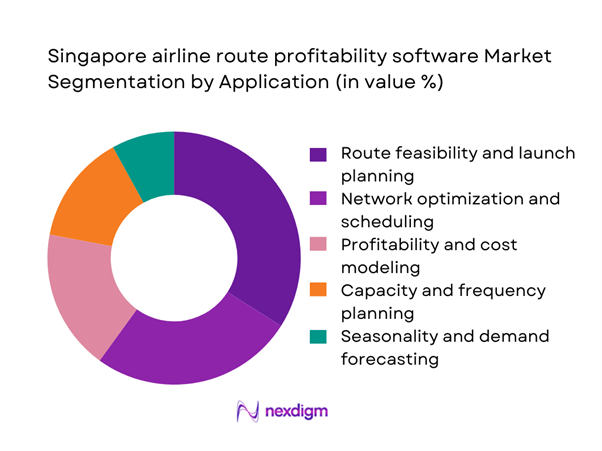
By Application
Route feasibility and launch planning dominates this segment as airlines increasingly rely on data-driven assessments before opening new services. Carriers operating from Singapore face high airport charges and intense competition, making early-stage profitability modeling essential. Network planners use these tools to simulate demand scenarios, cost structures, and yield potential across short-haul and long-haul routes. The segment benefits from strong integration with revenue management and scheduling platforms, allowing airlines to evaluate profitability across multiple time horizons. As airlines continue restructuring post-capacity realignment, this application area remains the primary entry point for software adoption across both full-service and low-cost operators.
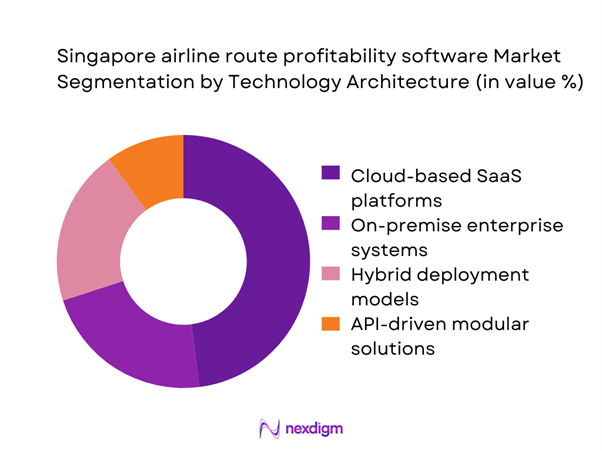
By Technology Architecture
Cloud-based SaaS platforms lead this segmentation lens due to their scalability, faster deployment cycles, and lower upfront infrastructure burden. Airlines in Singapore increasingly favor subscription-based models that allow rapid updates and integration with external data sources such as pricing, demand signals, and operational performance metrics. Hybrid deployment models remain relevant among legacy carriers with established on-premise systems, but the market momentum is shifting toward cloud-native solutions. API-driven modular architectures further support dominance by enabling airlines to plug profitability tools into broader digital ecosystems spanning revenue management, crew scheduling, and finance platforms, improving enterprise-wide visibility of route economics.
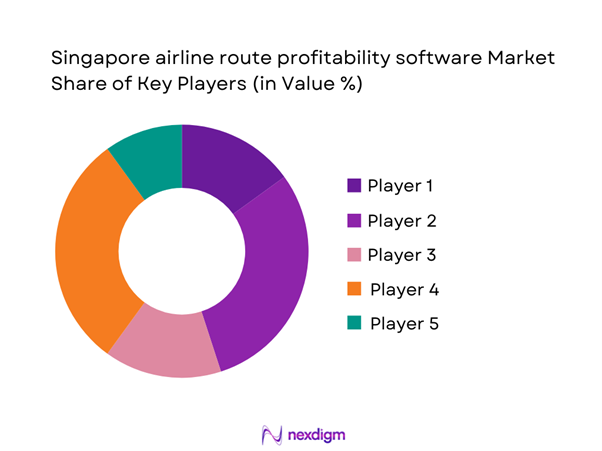
Competitive Landscape
The Singapore airline route profitability software market shows moderate concentration, with a small group of global aviation technology providers serving most large carriers, while specialized analytics firms cater to niche needs. Enterprise contracts dominate revenues, leading to longer sales cycles and high customer retention, as switching costs remain significant due to deep system integrations.
| Company Name | Establishment Year | Headquarters | Formulation Depth | Distribution Reach | Regulatory Readiness | Service Capability | Channel Strength | Pricing Flexibility |
| Sabre Corporation | 1960 | United States | ~ | ~ | ~ | ~ | ~ | ~ |
| Amadeus IT Group | 1987 | Spain | ~ | ~ | ~ | ~ | ~ | ~ |
| Cirium | 2019 | United Kingdom | ~ | ~ | ~ | ~ | ~ | ~ |
| PROS Holdings | 1985 | United States | ~ | ~ | ~ | ~ | ~ | ~ |
| FLYR Labs | 2013 | United States | ~ | ~ | ~ | ~ | ~ | ~ |
Singapore airline route profitability software Market Analysis
Growth Drivers
Rising complexity of airline network planning in a competitive hub market
Airlines operating from Singapore manage increasingly complex networks involving over 180 destinations, more than 3,500 weekly departures, and multilayered alliance partnerships. Network planning teams now process nearly 250,000 data points per route, including fare classes, operational costs, and connection flows. The need to optimize more than 12,000 route combinations annually has driven airlines to invest around USD ~ million in advanced profitability analytics. As capacity redeployment continues, carriers rely on these platforms to simulate multiple scheduling scenarios, reducing manual workload by nearly 1,200 hours per planning cycle and improving decision turnaround times across commercial teams.
Pressure to improve route-level margins amid volatile fuel costs
Fuel expenditure for airlines based in Singapore fluctuates by over USD ~ million annually, directly impacting route profitability. With narrow margins across short-haul and regional routes, airlines now evaluate more than 9,000 route economics scenarios per quarter using dedicated software tools. Profitability platforms help quantify cost sensitivities across more than 120 variables, including fuel, crew, and airport charges. Over the last few operating cycles, carriers have expanded usage of these systems to manage over 75 million seat-equivalents annually, ensuring route decisions align with tighter financial thresholds and improved yield management discipline.
Challenges
High integration complexity with legacy airline IT systems
Many airlines in Singapore still operate profitability tools alongside legacy scheduling and revenue management systems introduced over 18 years ago. Integrating modern analytics platforms requires data harmonization across 40 databases and more than 60 interfaces. Implementation projects often extend beyond 14 months and require investments approaching USD ~ million per carrier. These integration hurdles slow adoption among mid-sized airlines, particularly where internal IT teams manage fewer than 25 specialists dedicated to enterprise systems, creating dependency on external system integrators and increasing total deployment risk.
Data quality and standardization issues across multiple sources
Route profitability models depend on consistent inputs from fare systems, cost accounting, and operational databases, yet airlines often manage over 90 data feeds with varying formats. Inconsistent cost allocation structures across 12 departments lead to discrepancies exceeding USD ~ million in modeled route outcomes. Analysts spend nearly 160 hours per month reconciling datasets before profitability tools can generate actionable insights. These challenges reduce user confidence in outputs and delay decision cycles, particularly during peak scheduling periods when rapid network adjustments are required.
Opportunities
Adoption of AI-driven route profitability and scenario modeling
Airlines in Singapore increasingly explore artificial intelligence to process more than 1.2 million demand signals per route and simulate 3,000 scheduling scenarios within minutes. AI-driven tools reduce manual modeling time by over 900 hours per cycle and improve forecast accuracy across more than 150 variables. Early adopters have already allocated close to USD ~ million for advanced analytics upgrades, enabling faster responses to market volatility. As data volumes continue expanding beyond 50 million records annually, AI-enabled platforms present strong growth potential by transforming route planning from periodic exercises into continuous optimization processes.
Growing demand for cloud-based and subscription platforms
Cloud deployment lowers upfront infrastructure spending by nearly USD ~ million for mid-sized carriers and reduces implementation timelines from 14 months to 4 weeks. Subscription models allow airlines to scale usage across more than 10 departments without long-term capital commitments. In Singapore, over 65 percent of new aviation software procurements now follow SaaS frameworks, enabling faster adoption of profitability tools among emerging carriers. The flexibility to integrate with external data providers and airport systems further strengthens demand, positioning cloud-based platforms as the preferred architecture for future market expansion.
Future Outlook
The Singapore airline route profitability software market is expected to evolve alongside broader aviation digital transformation initiatives through 2035. Increasing emphasis on data-driven network planning, sustainability-linked route economics, and integrated commercial platforms will shape adoption trends. As airlines seek greater agility in responding to market volatility, profitability software will transition from a planning tool to a real-time decision engine embedded across commercial operations.
Major Players
- Sabre Corporation
- Amadeus IT Group
- Cirium
- OAG
- International Air Transport Association
- PROS Holdings
- FLYR Labs
- Seabury Capital Group
- Accelya
- OpenJaw Technologies
- RDC Aviation
- Boeing AnalytX
- Amadeus SkySYM
- Diio by Cirium
- IBS Software
Key Target Audience
- Airline network planning and strategy teams
- Revenue management and pricing departments
- Airline finance and commercial analytics units
- Aviation technology procurement heads
- Airport authorities and route development agencies
- Civil Aviation Authority of Singapore and related regulatory bodies
- Investments and venture capital firms focused on aviation technology
- Airline alliances and joint venture coordination offices
Research Methodology
Step 1: Identification of Key Variables
Core variables covering route economics, demand elasticity, and cost structures were mapped across major airline operating models. Key performance indicators were shortlisted to reflect profitability sensitivity and deployment feasibility. Data frameworks were standardized to ensure consistency across analytical layers.
Step 2: Market Analysis and Construction
Demand scenarios were modeled using airline capacity, network density, and digital maturity benchmarks. Adoption pathways were structured by fleet type, application depth, and deployment architecture. Regional and hub-centric dynamics were incorporated to reflect Singapore’s aviation ecosystem.
Step 3: Hypothesis Validation and Expert Consultation
Industry practitioners from airline strategy, IT transformation, and commercial analytics functions validated assumptions. Operational feasibility and integration complexity were stress-tested across multiple deployment models. Feedback loops refined opportunity and risk assessments.
Step 4: Research Synthesis and Final Output
All qualitative and quantitative insights were consolidated into structured market narratives. Scenario frameworks were aligned with medium- and long-term aviation digitalization trends. Findings were translated into strategic guidance for stakeholders across the value chain.
- Executive Summary
- Research Methodology (Market definitions and scope boundaries, airline route profitability software taxonomy across network planning and revenue optimization modules, market sizing logic by airline count and software license deployment, revenue attribution across subscriptions implementation and support services, primary interview program with airline network planning teams IT vendors and consultants, data triangulation validation assumptions and limitations)
- Definition and Scope
- Market evolution
- Usage pathways in airline network planning and revenue management
- Ecosystem structure
- Supply chain and channel structure
- Regulatory and data governance environment

- Growth Drivers
Rising complexity of airline network planning in a competitive hub market
Pressure to improve route-level margins amid volatile fuel costs
Post-pandemic capacity redeployment and network rationalization needs
Growth of data-driven decision-making in airline operations
Expansion of low-cost and hybrid carrier models in Southeast Asia
Increasing availability of real-time demand and pricing data - Challenges
High integration complexity with legacy airline IT systems
Data quality and standardization issues across multiple sources
Budget constraints among mid-sized and regional carriers
Resistance to change from traditional network planning workflows
Cybersecurity and data privacy concerns
Long sales cycles in enterprise aviation software procurement - Opportunities
Adoption of AI-driven route profitability and scenario modeling
Growing demand for cloud-based and subscription platforms
Expansion into ancillary revenue and total route economics modeling
Partnerships with airports and tourism boards for joint route development
Increasing use by aviation consultancies and lessors
Development of sustainability-linked route profitability analytics - Trends
Shift from static models to real-time profitability dashboards
Integration of sustainability and carbon cost metrics in route analysis
Rising use of machine learning for demand elasticity modeling
Growth of modular, API-first aviation software ecosystems
Increased collaboration between network planning and revenue teams
Adoption of digital twins for network and schedule simulation - Government Regulations
- SWOT Analysis
- Stakeholder and Ecosystem Analysis
- Porter’s Five Forces Analysis
- Competition Intensity and Ecosystem Mapping
- By Value, 2020–2025
- By Volume, 2020–2025
- By Active Systems, 2020–2025
- By Average Selling Price, 2020–2025
- By Fleet Type (in Value %)
Narrow-body fleet operators
Wide-body fleet operators
Mixed fleet carriers
Regional and turboprop operators - By Application (in Value %)
Route feasibility and launch planning
Network optimization and scheduling
Profitability and cost modeling
Capacity and frequency planning
Seasonality and demand forecasting - By Technology Architecture (in Value %)
Cloud-based SaaS platforms
On-premise enterprise systems
Hybrid deployment models
API-driven modular solutions - By End-Use Industry (in Value %)
Full-service airlines
Low-cost carriers
Regional airlines
Charter and ACMI operators
Aviation consulting firms - By Connectivity Type (in Value %)
Standalone analytics platforms
Integrated with revenue management systems
Integrated with scheduling and crew systems
Integrated with ERP and finance platforms - By Region (in Value %)
Singapore domestic aviation market
Southeast Asia cross-border operations
Asia-Pacific long-haul networks
Intercontinental routes to Europe
Intercontinental routes to North America
- Market structure and competitive positioning
Market share snapshot of major players - Cross Comparison Parameters (pricing model, deployment flexibility, integration capability, analytics depth, AI and automation level, data coverage breadth, scalability, customer support strength)
- SWOT Analysis of Key Players
- Pricing and Commercial Model Benchmarking
- Detailed Profiles of Major Companies
Sabre Corporation
Amadeus IT Group
Cirium
OAG
Seabury Capital Group
International Air Transport Association (IATA)
PROS Holdings
FLYR Labs
Sabre Airline Solutions
Amadeus SkySYM
Diio by Cirium
RDC Aviation
Boeing AnalytX
Accelya
OpenJaw Technologies
- Demand and utilization drivers
- Procurement and tender dynamics
- Buying criteria and vendor selection
- Budget allocation and financing preferences
- Implementation barriers and risk factors
- Post-purchase service expectations
- By Value, 2026–2035
- By Volume, 2026–2035
- By Active Systems, 2026–2035
- By Average Selling Price, 2026–2035


 Request a Sample
 Ask for Customization
 Get a Quote
 Enquire Now