 Download PDF
Market Overview
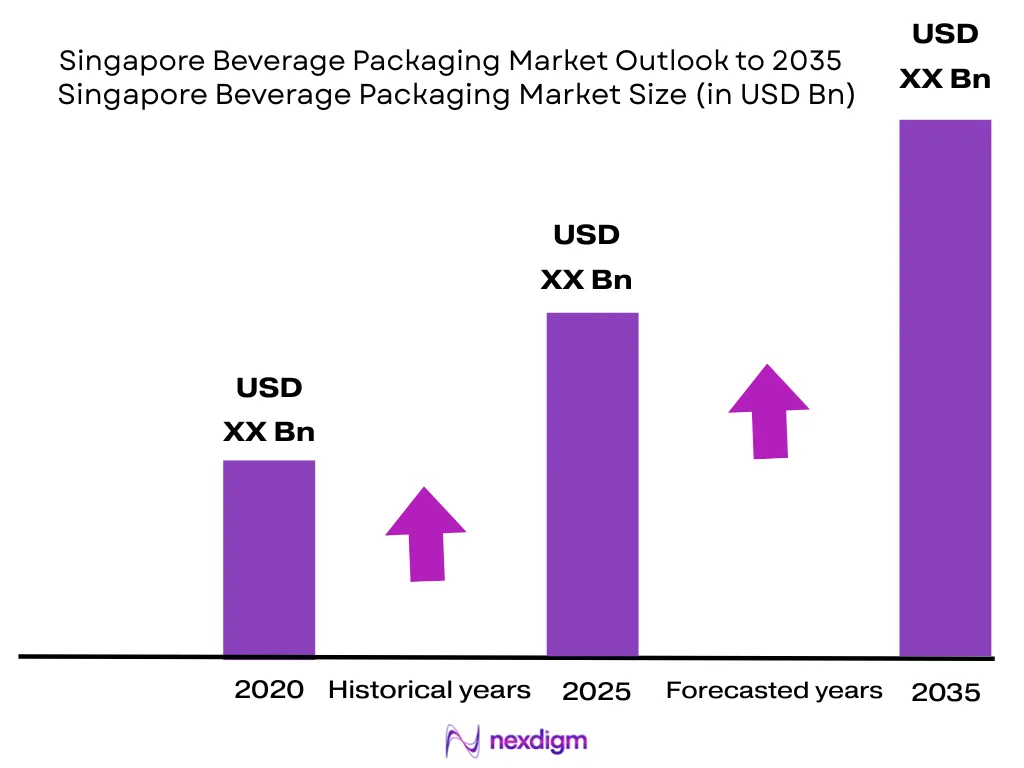
The Singapore Beverage Packaging Market is valued at approximately USD ~ billion and is forecast to expand at a CAGR of % during 2026–2035. Singapore’s economy expanded by 4.0% in the latest full-year reading, while the total population subsequently reached 6.11 million people. Demand is supported by packaged water, soft drinks, ready-to-drink tea and coffee, dairy alternatives, beer, functional beverages, hospitality, aviation, convenience retail and regional beverage trade. Jurong–Tuas, Woodlands–Senoko, Changi, central Singapore and Pasir Panjang dominate the Singapore Beverage Packaging Market. Jurong and Tuas concentrate manufacturing, warehousing and regional logistics. Woodlands and Senoko support food-processing and distribution activity. Changi generates airline, airport-retail and travel-related beverage demand, while central Singapore concentrates hotels, restaurants, offices and premium retail. Pasir Panjang supports imported packaging materials, filled beverages, distribution and re-export activity through port-linked logistics.
Market Segmentation
By Packaging Material
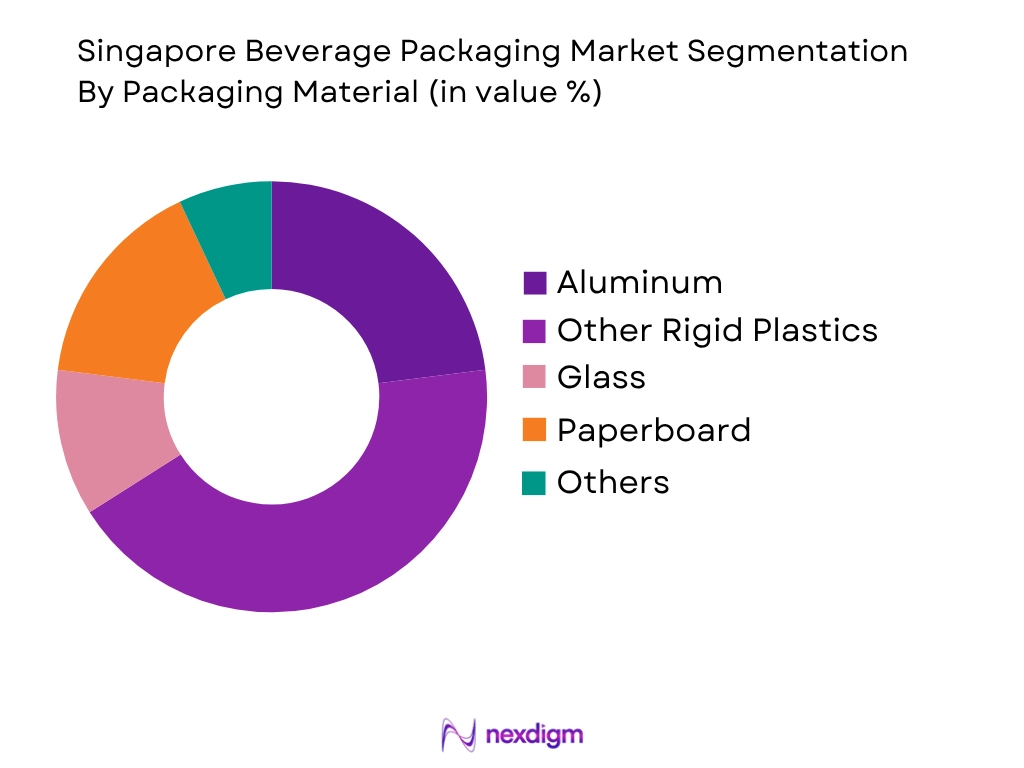
The Singapore Beverage Packaging Market is segmented into PET and other rigid plastics, aluminium and steel, paperboard and aseptic cartons, glass, and flexible or composite packaging. PET and other rigid plastics hold the dominant indicative position because packaged water, carbonated soft drinks, juices, dairy beverages, functional drinks and ready-to-drink tea rely extensively on lightweight bottles. PET is transparent, resealable, compatible with high-speed filling and suitable for dense urban distribution. Plastic and metal containers between 150 millilitres and 3 litres are also covered by Singapore’s Beverage Container Return Scheme when they carry the required deposit mark. Aluminium cans are prominent in energy drinks, beer, coffee and carbonated beverages. Aseptic cartons serve milk, juice and plant-based products, while glass supports premium water, beer, wine and spirits.
By Beverage Category
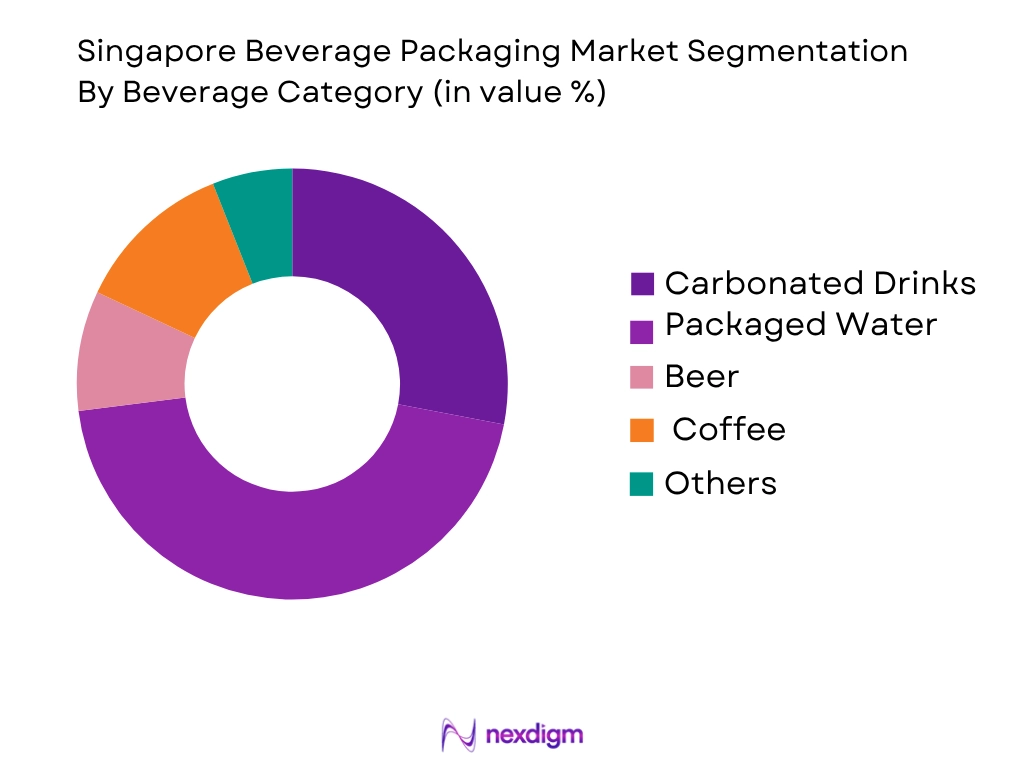
The Singapore Beverage Packaging Market is segmented into packaged water, carbonated soft drinks, ready-to-drink tea and coffee, beer and cider, juices, dairy and plant-based beverages, energy and sports drinks, wine and spirits, and functional beverages. Packaged water holds the dominant indicative position because it is distributed through supermarkets, convenience stores, workplaces, hotels, hospitals, airports, foodservice outlets, vending machines and events. The category uses single-serve PET bottles, multi-serve bottles, aluminium cans, premium glass, caps, labels, shrink film and corrugated cases. Ready-to-drink tea and coffee are significant because of Singapore’s convenience culture and established Asian beverage preferences. Beer and cider support cans, glass bottles and kegs, while plant-based drinks and juices sustain demand for aseptic cartons and chilled bottles.
Competitive Landscape
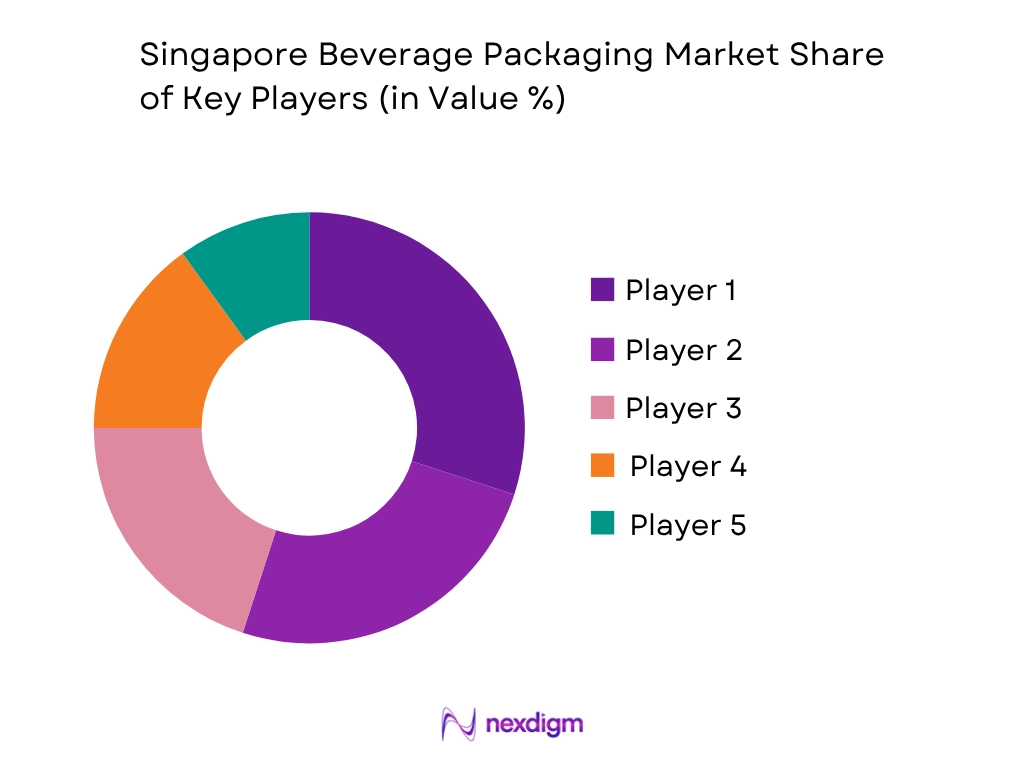
Singapore’s beverage-packaging market combines multinational packaging groups, regional converters, carton-system suppliers, machinery companies and import distributors. Competition is influenced by regional manufacturing access, local warehousing, food-contact compliance, deposit-return compatibility, technical support, minimum order volumes and the ability to serve both domestic customers and Southeast Asian export markets. Amcor, Tetra Pak, SIG, Crown and ALPLA represent important positions across flexible packaging, rigid plastics, beverage cans, aseptic cartons and filling-related services.
| Company | Establishment Year | Headquarters | Core Beverage Portfolio | Material Capability | Principal Applications | Singapore and Regional Footprint | Circularity Capability | Strategic Differentiation |
| Amcor | 1860 group heritage | Zurich, Switzerland | ~ | ~ | ~ | ~ | ~ | ~ |
| Tetra Pak | 1951 | Pully, Switzerland | ~ | ~ | ~ | ~ | ~ | ~ |
| SIG | 1853 group heritage | Neuhausen, Switzerland | ~ | ~ | ~ | ~ | ~ | ~ |
| Crown Holdings | 1892 | Tampa, United States | ~ | ~ | ~ | ~ | ~ | ~ |
| ALPLA | 1955 | Hard, Austria | ~ | ~ | ~ | ~ | ~ | ~ |
Singapore Beverage Packaging Market Analysis
Growth Drivers
Dense Urban Consumption and Expanding Beverage Demand
Singapore’s concentrated urban economy supports beverage-packaging demand by placing a large resident, commuter and visitor population within a compact retail and food-service network. The country had approximately 6.0 million residents in mid-2024, while gross domestic product reached about US$547.4 billion and GDP per capita stood at US$90,674.1. These indicators demonstrate substantial consumer purchasing capacity and a high density of economic activity, both of which support packaged water, carbonated drinks, juices, dairy beverages, functional drinks, ready-to-drink coffee and other convenience formats. Singapore’s urban structure is particularly relevant to packaging suppliers because beverages are distributed through supermarkets, convenience stores, vending machines, hawker centres, restaurants, hotels, workplaces and transport-linked retail locations. In February 2024, food-and-beverage service activity recorded a substantial year-on-year increase, while May and September also registered expansion. These monthly movements indicate continued throughput across establishments that rely on bottles, cans, cartons, cups, closures, labels and secondary transport packaging. Demand is reinforced by Singapore’s role as a tourism and business hub, where hospitality operators require individually portioned and portable beverage formats that can be stored, chilled, displayed and served efficiently. The packaging implication is not simply higher unit consumption; it is also greater demand for lightweight structures, resealable closures, smaller serving sizes, barrier protection and formats suitable for rapid retail replenishment. Singapore’s approximately US$3.13 trillion stock of foreign direct investment at the end of 2024 further reflects its importance as a regional commercial and production-management centre. This environment encourages multinational beverage and packaging companies to introduce new materials, filling systems and regional product formats through Singapore. The combination of a 6.0 million consumer base, high per-capita output, dense food-service infrastructure and strong international business activity therefore creates a dependable demand foundation for beverage packaging through 2035.
Extended Producer Responsibility and Mandatory Packaging Regulation
Regulation is becoming a direct driver of replacement demand, packaging redesign and investment in recoverable beverage formats. Singapore’s Mandatory Packaging Reporting framework requires companies meeting the applicable turnover threshold to report packaging placed on the market and submit reduction, reuse or recycling plans. For the 2026 reporting cycle, companies with annual turnover exceeding S$10 million in 2024 must report their 2025 packaging data between 1 January and 31 March 2026. This requirement makes packaging material, weight, recyclability and end-of-life management measurable management issues rather than voluntary branding considerations. Beverage producers must consequently maintain more detailed information on containers, closures, labels, multipacks and transport packaging, creating demand for packaging designs that can be more easily documented, collected and processed. The most significant market-specific measure is Singapore’s Beverage Container Return Scheme, which began on 1 April 2026 and covers regulated plastic and metal beverage containers. Consumers receive a S$0.10 deposit refund when eligible containers are returned. The scheme addresses more than 1 billion beverage containers used annually and is intended to recover over 16,000 tonnes of material each year. At launch, the collection system included more than 1,000 reverse-vending machines and additional manual return locations. These numbers create a large, regulated stream of containers that must carry approved labels or marks, remain machine-readable, preserve barcode integrity and meet material and size requirements. Packaging converters, label suppliers, closure manufacturers, coding-equipment providers and beverage fillers therefore face demand for compliant container specifications and production-line modifications. Regulation also encourages movement toward clear PET bottles, recyclable aluminium cans, detachable sleeves, compatible inks and simplified material combinations. The addressable opportunity is reinforced by Singapore’s 2024 economy of approximately US$547.4 billion, which gives government agencies and industry participants a substantial operating base for implementing collection infrastructure. Regulation is therefore not solely a constraint: it establishes predictable technical requirements that accelerate replacement of difficult-to-recycle beverage packs and support long-term demand for compliant packaging solutions.
Market Challenges
Compliance, Production Conversion and Operational Burden
The transition to mandatory reporting and the Beverage Container Return Scheme creates material operational challenges for beverage-packaging users and suppliers. Producers must register regulated products, manage deposit-related processes, apply compliant markings, maintain accurate product records and ensure that containers can be recognised by collection equipment. A single producer may manage hundreds of stock-keeping units across bottle sizes, can formats, imported brands, seasonal products and promotional multipacks. Each variation may require artwork revision, barcode validation, packaging-inventory control and coordination between brand owners, converters, co-packers, importers and retailers. The S$0.10 deposit applied to regulated containers also requires changes to invoicing, point-of-sale systems, reconciliation procedures and consumer communications. The challenge is magnified by the physical scale of the scheme: more than 1 billion beverage containers are consumed annually, and the system is designed to recover more than 16,000 tonnes of material. Even small errors in labels, dimensions or registration information can therefore affect large production volumes. Smaller beverage importers and niche producers may face particular difficulty because compliance work is spread across fewer units and fewer employees. Singapore’s 2024 enterprise landscape included about 276,500 micro-enterprises, 61,100 small enterprises, 16,500 medium-sized enterprises and 4,300 large enterprises. Although these figures cover the wider business economy, they demonstrate that most companies operate with relatively limited organisational scale, which can restrict access to packaging engineers, regulatory specialists and dedicated sustainability teams. Mandatory Packaging Reporting adds a parallel data burden. Companies exceeding S$10 million in 2024 turnover must submit their 2025 packaging information and implementation plans during the first quarter of 2026. Beverage companies must consequently measure packaging by material and functional category while obtaining reliable data from local and overseas suppliers. Import dependence adds complexity because a container manufactured outside Singapore may need local artwork changes, relabelling or separate inventory. These requirements can delay product launches, increase obsolete packaging stocks and complicate regional packaging standardisation. Market growth will therefore favour suppliers capable of providing validated, scheme-ready containers, short production runs, digital artwork control and comprehensive material documentation.
Low Recovery of Plastic and Glass Packaging Materials
The technical and infrastructural challenge facing Singapore’s beverage-packaging market is demonstrated by the country’s waste data. In 2024, Singapore generated 918,000 tonnes of plastic waste, but only 43,000 tonnes were recycled; 875,000 tonnes were disposed of. During the same year, 79,000 tonnes of glass waste were generated, of which 6,000 tonnes were recycled and 73,000 tonnes were disposed of. Paper and cardboard waste reached 1.272 million tonnes, with 402,000 tonnes recycled and 871,000 tonnes disposed of after rounding. These figures cover broader waste categories rather than beverage containers alone, but they directly show the limited domestic recovery environment within which beverage bottles, labels, films, cartons and secondary packaging are managed. Beverage packs frequently combine container resin, caps, liners, labels, adhesives, inks and tamper-evident components. While each component supports product integrity, incompatible combinations can reduce the quality of recovered material. Full-body sleeves may obstruct optical sorting, dark pigments can reduce polymer identification, residual liquid can contaminate collection streams and multilayer barriers may be difficult to separate. Glass beverage packaging presents different constraints. It is heavy to transport, vulnerable to breakage and requires colour separation and contaminant removal before remelting or alternative use. Singapore’s limited land availability further restricts space for sorting, baling, washing and reprocessing facilities. The country generated 6.658 million tonnes of total waste in 2024, of which 3.326 million tonnes were recycled and 3.332 million tonnes were disposed of. This large material flow competes for collection capacity, storage space and processing resources. Beverage packaging also needs food-contact performance, carbonation resistance, shelf-life protection and high-speed filling compatibility, so material reduction cannot compromise container strength or safety. Manufacturers must therefore balance recyclability with barrier performance, closure integrity and logistics requirements. The Beverage Container Return Scheme will establish a cleaner stream of metal and plastic containers, but packaging suppliers must still address label removal, cap compatibility, container compaction and recycled-material quality. The technical gap between collecting a container and converting it into suitable feedstock remains a central market challenge through 2035.
Market Opportunities
Expansion of Circular Collection and Recycled-Material Infrastructure
Singapore’s new return system creates a substantial opportunity for packaging companies that can support closed-loop collection, sorting and recycled-material use. The Beverage Container Return Scheme covers more than 1 billion containers consumed each year and is intended to recover over 16,000 tonnes of plastic and metal material annually. At launch, consumers could use more than 1,000 reverse-vending machines, with manual return points supplementing machine-based collection. This infrastructure creates a relatively clean and identifiable stream of PET bottles and aluminium cans compared with mixed household recycling. Cleaner feedstock can support more consistent sorting, baling and material-quality control, improving the commercial basis for bottle-to-bottle recycling, can-sheet recovery and other circular applications. The opportunity is supported by the scale of the existing waste-management gap. Singapore disposed of 875,000 tonnes of plastic waste in 2024 while recycling 43,000 tonnes. It also disposed of 73,000 tonnes of glass while recycling 6,000 tonnes. Beverage packaging represents a practical entry point for improving this position because containers have standardised shapes, established resin or metal values and repeatable retail distribution channels. Packaging suppliers can respond by developing clear monomaterial bottles, washable adhesives, smaller labels, compatible closures and lightweight cans that retain filling-line performance. Equipment suppliers can provide compactors, optical sorters, counting systems, balers, washing lines and quality-control systems suited to Singapore’s space constraints. There is also scope for logistics providers to consolidate containers collected from supermarkets, housing estates, hawker centres and transport locations. Packaging converters that can demonstrate traceability of recycled resin or recovered aluminium will be positioned to support beverage companies’ reporting and environmental claims. Singapore’s 2024 GDP of approximately US$547.4 billion, combined with a foreign-investment stock of about S$3.13 trillion, provides a strong commercial platform for testing circular-packaging technologies and coordinating regional supply chains. Current container volumes, collection infrastructure and waste tonnage therefore support future expansion without requiring speculative market forecasts. The strongest opportunity lies in linking compliant package design with high-purity collection and verified recycled-material reintegration.
Smart Labels, Digital Traceability and Automated Return Compatibility
The transition toward automated container returns creates an opportunity for digitally enabled beverage packaging. Reverse-vending machines must identify eligible containers, verify their characteristics and support deposit refunds. With more than 1,000 machines available at the scheme’s launch and more than 1 billion containers entering the market annually, reliable machine recognition becomes a core packaging requirement rather than an optional feature. Packaging suppliers can develop higher-quality printed barcodes, durable data carriers, machine-readable deposit marks and labels that remain legible after refrigeration, condensation, handling and transport. Digital printing can also help beverage producers manage lower-volume variants without holding large inventories of preprinted packaging, reducing the risk that regulatory changes make existing labels unusable. The opportunity extends beyond deposit recognition. Batch codes, two-dimensional codes and connected product identifiers can support production traceability, recall management, authentication, recycling instructions and consumer information. Beverage companies subject to Mandatory Packaging Reporting need structured information on packaging materials and quantities. For the 2026 submission period, businesses exceeding S$10 million in 2024 turnover must report 2025 packaging data and planned reduction, reuse or recycling measures. Digital product records can connect container specifications, material weights, supplier declarations and sales volumes, reducing manual reconciliation across large product portfolios. Singapore’s digital readiness provides a strong adoption environment. World Bank data recorded 94 internet users for every 100 people in 2024, while the country’s population was approximately 6.0 million. This enables beverage brands to combine physical packaging with digital return guidance, product information and location services. Smart features must nevertheless remain compatible with recycling: embedded electronics or complex multilayer additions would undermine material recovery. The commercial opportunity therefore centres on printable, low-material digital identification rather than hardware-heavy packaging. Suppliers that integrate artwork management, variable-data printing, barcode verification and packaging-material records can serve producers, importers and scheme operators simultaneously. Current machine numbers, regulated container volumes, reporting thresholds and national digital access provide concrete support for long-term growth in traceable and automation-compatible beverage packaging.
Future Outlook
The Singapore Beverage Packaging Market is expected to evolve materially through 2035 as deposit-return compliance, recycled-content use, packaging reporting, e-commerce and premium beverage consumption reshape supplier strategies. Growth will depend less on basic population expansion and more on format substitution, collection efficiency, regional sourcing, automation and higher-value packaging. The Beverage Container Return Scheme commenced on 1 April 2026 and applies an extended producer responsibility approach to eligible beverage containers. The system covers plastic and metal containers from 150 millilitres to 3 litres, each carrying a 10-cent refundable deposit. Packaging suppliers must ensure eligible products carry the correct deposit mark and readable barcode. Reverse-vending machines require containers to be empty, uncrushed and recognisable, making container geometry, label position and print quality important technical parameters.
Major Players
- Amcor Singapore
- Tetra Pak Singapore
- SIG Singapore
- Crown Asia Pacific Holdings
- ALPLA Singapore
- Sidel South Asia Pacific
- Krones Singapore
- KHS Asia Pacific
- Mitsui Chemicals Asia Pacific
- SCG Packaging Singapore
- Oji Asia Packaging
- Daibochi Singapore Operations
- Thong Guan Industries Singapore
- SKP
- Tong Huat Trading
Key Target Audience
- Beverage-container and packaging-material manufacturers
- Packaged-water, soft-drink, juice and functional-beverage producers
- Dairy and plant-based beverage companies
- Breweries, cider producers and alcoholic-beverage companies
- Retailers, foodservice groups, hotels and aviation operators
- Investments and venture capitalist firms
- Private-equity and strategic packaging investors
- Government and regulatory bodies
Research Methodology
Step 1: Identification of Key Variables
The first phase constructs an ecosystem map covering material suppliers, bottle and can manufacturers, carton companies, closures, beverage fillers, contract packagers, retailers, return-point operators, waste collectors and recyclers. Critical variables include container units, package weight, deposit eligibility, beverage category, recycled content, import dependence and regional supply.
Step 2: Market Analysis and Construction
Historical data is compiled by packaging material, container format, beverage category, pack size, distribution channel and deposit eligibility. Bottom-up analysis evaluates filled-beverage volumes, container shipments, imports, local conversion and supplier revenues. Top-down analysis reviews GDP, population, tourism, retail, manufacturing, trade and packaging-waste flows.
Step 3: Hypothesis Validation and Expert Consultation
Market hypotheses are validated through computer-assisted telephone interviews with packaging suppliers, beverage producers, contract fillers, retailers, hotels, foodservice operators, return-point hosts and recyclers. These consultations assess container qualification, deposit-system readiness, import lead times, recycled-material availability, technical performance and procurement behaviour.
Step 4: Research Synthesis and Final Output
Supply-side and demand-side results are triangulated to reconcile domestic consumption, imports, re-exports, container use and recovered-material flows. Segment shares and forecasts are tested against package weights, deposit-eligible volumes, supplier portfolios, regulatory requirements, collection infrastructure and primary-industry feedback.

- Executive Summary
- Research Methodology (Market Definitions and Assumptions, Beverage Packaging Inclusion and Exclusion Criteria, Abbreviations, Market Sizing Approach, Top-Down Analysis, Bottom-Up Analysis, Beverage Filling Volume Model, Container Unit Conversion Model, Packaging Material Tonnage Assessment, Domestic Production Analysis, Import and Re-Export Assessment, Demand-Side Interviews, Supply-Side Interviews, Retail and Foodservice Interviews, Data Triangulation, Scenario Modelling, Forecasting Framework, Limitations and Future Conclusions)

- Definition and Scope
- Market Evolution and Industry Genesis
- Evolution of Beverage Packaging Materials
- Development of PET Beverage Bottles
- Expansion of Aluminium Beverage Cans
- Development of Aseptic Beverage Cartons
- Evolution of Glass Beverage Bottles

- Growth Drivers (High Urban Density, Convenience Beverage Consumption, Tourism, Hospitality, Airport Traffic, Modern Retail, Functional Beverages and Regional Trade)
- Market Challenges (Limited Domestic Recycling Capacity, Import Dependence, High Operating Costs, Deposit-System Transition, Multilayer Recovery, Food-Contact Compliance and Small Domestic Scale)
- Market Opportunities (Food-Grade rPET, Deposit-Compliant Containers, Reverse-Vending Technology, Aluminium Can Recovery, Refill Systems, Premium Packaging, Smart Labels and Regional Co-Packing)
- Market Trends (Bottle Lightweighting, Can Premiumisation, Recycled Content, Deposit Marks, Digital Printing, Smart Collection, Refill Models and Packaging Carbon Disclosure)
- SWOT Analysis
- Porter’s Five Forces Analysis
- PESTLE Analysis

- By Market Value (2020-2025)
- By Beverage Container Units (2020-2025)
- By Packaged Beverage Volume (2020-2025)

- By Packaging Material (In Value %)
PET
HDPE
Polypropylene
Other Rigid Plastics
Polyethylene Films
Aluminium - By Beverage Category (In Value %)
Packaged Drinking Water
Natural Mineral Water
Flavoured and Enhanced Water
Carbonated Soft Drinks
Energy Drinks
Sports and Isotonic Drinks - By Distribution Channel (In Value %)
Supermarkets and Hypermarkets
Convenience Stores
Petrol-Station Stores
Neighbourhood Retailers
Specialty Beverage Retailers - By Geographic Cluster (In Value %)
Jurong and Tuas Industrial Corridor
Woodlands and Senoko Industrial Cluster
Pioneer and Boon Lay Manufacturing Corridor
Changi Airport and Aviation Cluster
Tampines and Eastern Distribution Cluster

- Market Share of Major Players
- Cross Comparison Parameters (Beverage Container Material and Format Breadth, Singapore and Southeast Asia Manufacturing and Supply Footprint, Deposit-Eligible Container and Barcode Compliance Capability, Food-Grade rPET and Closed-Loop Material Capability, Beverage Filling-Line Compatibility and Technical-Service Coverage, Beverage Category Pack-Size and Premium-Format Coverage, Food-Contact Mandatory-Reporting and Return-Scheme Compliance Support, Lightweighting Digital Printing and New-Format Commercialisation Capability)
- SWOT Analysis of Major Players
- Detailed Profiles of Major Companies
Amcor Singapore
Tetra Pak Singapore
SIG Singapore
Crown Asia Pacific Holdings
ALPLA Singapore
Sidel South Asia Pacific
Krones Singapore
KHS Asia Pacific
Mitsui Chemicals Asia Pacific
SCG Packaging Singapore
Oji Asia Packaging
Daibochi Berhad Singapore Operations
Thong Guan Industries Singapore
SKP
Tong Huat Trading

- Packaged-Water Producer Analysis
- Carbonated Soft Drink Producer Analysis
- Energy and Sports Drink Producer Analysis
- Juice and Fruit-Beverage Producer Analysis
- Dairy and Plant-Based Beverage Producer Analysis
- Ready-to-Drink Tea and Coffee Producer Analysis

- By Market Value (2026-2035)
- By Beverage Container Units (2026-2035)
- By Packaged Beverage Volume (2026-2035)


 Request a Sample
 Ask for Customization
 Get a Quote
 Enquire Now