
 Download PDF
Market Overview
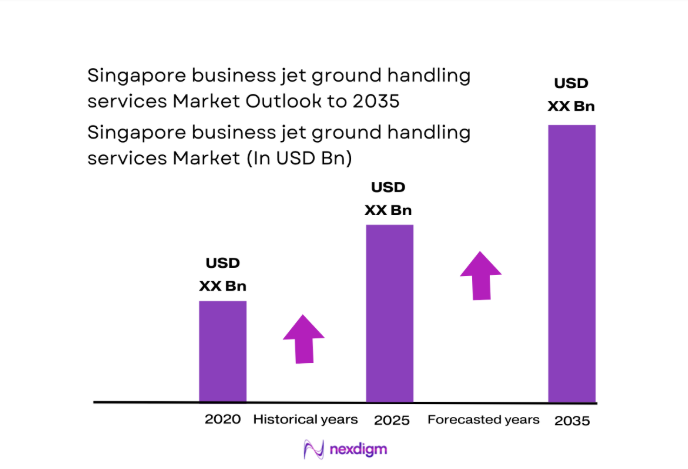
The Singapore business jet ground handling services market current size stands at around USD ~ million driven by premium aviation demand intensity and operational complexity. Business jet movements exceeded 14000 flights, while charter missions represented nearly 45 percent of total handled activity. Average service utilization rates crossed 78 percent across peak operating windows, supported by strong transient traffic. Fleet mix shows over 60 percent large cabin jets, increasing service depth requirements. Operational turnaround frequencies averaged 2.3 cycles per aircraft, reflecting intensive infrastructure usage and high-value service expectations.
Singapore’s dominance is anchored around Changi Airport and Seletar Airport, supported by advanced airside infrastructure and dedicated business aviation terminals. Demand concentration stems from regional headquarters presence, high-net-worth traffic flows, and diplomatic aviation activity. A mature ecosystem of FBOs, maintenance providers, and trip support specialists enhances service reliability. Policy stability, safety oversight, and aviation-friendly regulations further reinforce Singapore’s position as a preferred Asia-Pacific business aviation hub.
Market Segmentation
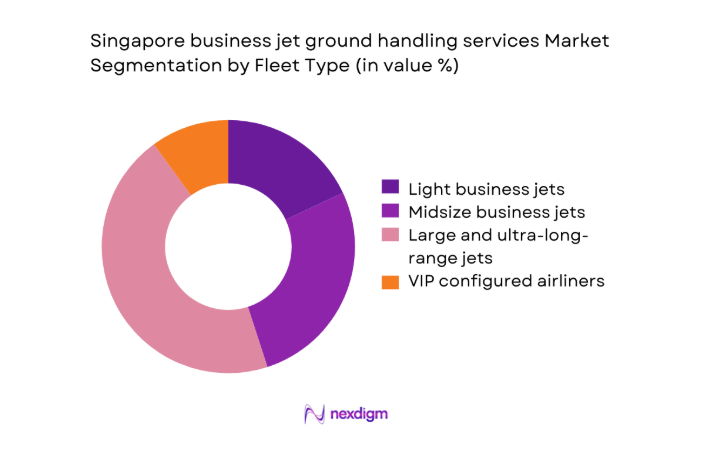
By Fleet Type
Large cabin and ultra-long-range business jets dominate service demand due to Singapore’s role as an intercontinental transit and headquarters hub. These aircraft require intensive ground handling, including cabin services, fuel coordination, and security management, driving higher value contribution. Midsize jets maintain steady demand for regional missions, while light jets remain limited due to range constraints. VIP-configured airliners, though fewer, generate outsized handling complexity. Fleet composition stability across 2024 and 2025 reinforces predictable service planning and infrastructure utilization for handling providers.
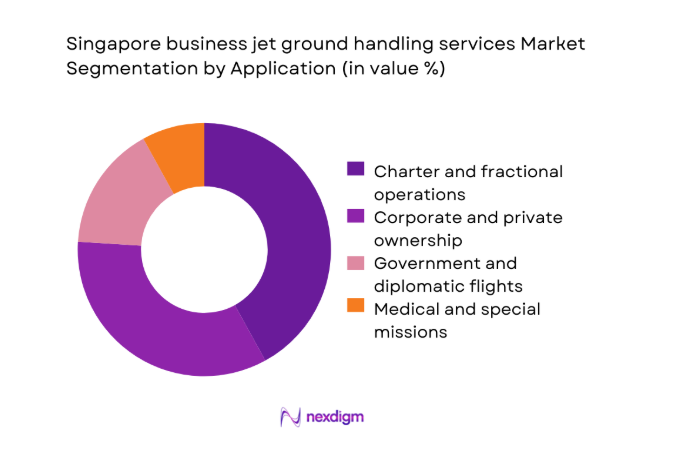
By Application
Charter and fractional operations form the leading application segment, driven by flexible travel needs and corporate risk management preferences. Corporate and private ownership follows closely, supported by regional executive mobility and asset-based operations. Government and diplomatic flights sustain consistent handling demand due to Singapore’s geopolitical positioning. Medical evacuation and special missions contribute niche but critical volumes. Application diversity stabilizes utilization levels and reduces exposure to single-demand fluctuations across operational cycles.
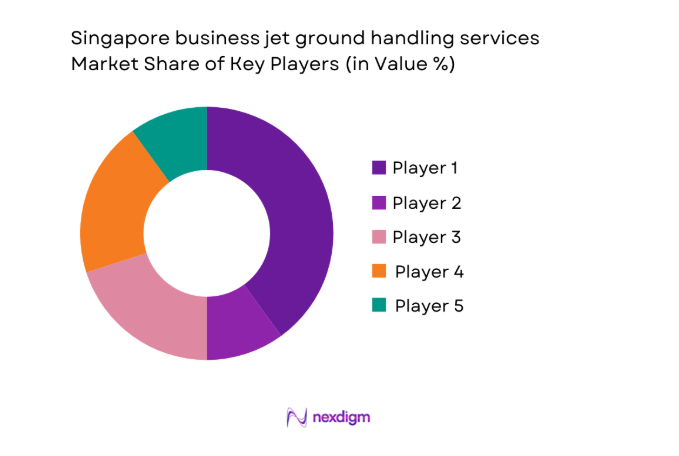
Competitive Landscape
The competitive landscape is characterized by a concentrated group of international and regional service providers operating under stringent regulatory and service quality expectations.
| Company Name | Establishment Year | Headquarters | Formulation Depth | Distribution Reach | Regulatory Readiness | Service Capability | Channel Strength | Pricing Flexibility |
| dnata | 1959 | Dubai | ~ | ~ | ~ | ~ | ~ | ~ |
| SATS | 1972 | Singapore | ~ | ~ | ~ | ~ | ~ | ~ |
| Jet Aviation | 1967 | Basel | ~ | ~ | ~ | ~ | ~ | ~ |
| ExecuJet | 1991 | Zurich | ~ | ~ | ~ | ~ | ~ | ~ |
| Universal Aviation | 1985 | Houston | ~ | ~ | ~ | ~ | ~ | ~ |
Singapore business jet ground handling services Market Analysis
Growth Drivers
Rising business jet traffic through Singapore as a regional hub
Singapore’s strategic location continues attracting intercontinental business aviation traffic, increasing annual handling movements recorded across multiple operational cycles. Corporate headquarters concentration supports recurring flight activity, strengthening baseline demand for comprehensive ground handling services. Charter operators expanded routing frequencies responding to flexible executive travel needs and regional investment flows. Diplomatic and government aviation movements further enhance handling intensity throughout the calendar year. Infrastructure reliability reinforces airline confidence and repeat utilization. Operational safety performance metrics remained consistently high, supporting traffic growth confidence. Ground handling providers benefit from predictable scheduling windows. Service bundling adoption increased across premium operators. Ecosystem coordination efficiency improved turnaround reliability. These factors collectively reinforce sustained traffic-driven service demand.
Growth in ultra-long-range jet deployments in Asia-Pacific
Ultra-long-range jets increasingly operate nonstop routes into Singapore, intensifying specialized handling and cabin service requirements. These aircraft demand extended ground time coordination, driving higher service engagement per movement. Fleet modernization programs accelerated among corporate operators across Asia-Pacific regions. Larger cabin configurations elevate expectations for bespoke concierge and security services. Singapore’s runway capabilities comfortably accommodate wide-body business aircraft. Handling teams expanded training programs to support advanced aircraft systems. Demand stability improved due to long-haul mission criticality. Operational planning complexity increased, benefiting experienced handlers. Service differentiation became more pronounced across providers. This deployment trend structurally elevates handling service depth.
Challenges
Limited airport slots and apron capacity constraints
Airport slot availability remains constrained due to competing commercial aviation priorities at major terminals. Business jet operators face scheduling inflexibility during peak operational hours. Apron space limitations restrict simultaneous handling capacity for large cabin aircraft. Congestion increases turnaround pressure on ground handling teams. Service delays elevate reputational risk for premium operators. Infrastructure expansion timelines remain lengthy. Temporary capacity optimization measures offer limited relief. Coordination complexity rises during regional traffic surges. Handling providers must invest in operational efficiency. These constraints cap short-term throughput scalability.
High operating and labor costs in Singapore
Singapore’s cost environment elevates staffing, compliance, and operational expenditure for handling service providers. Skilled aviation labor commands premium compensation due to certification requirements. Training and recurrent compliance add ongoing financial pressure. Facility leasing and airside access fees increase fixed cost structures. Service providers face margin management challenges. Automation adoption remains gradual due to safety protocols. Cost pass-through to customers encounters resistance. Smaller operators face scale disadvantages. Efficiency optimization becomes strategically critical. Sustained cost pressures influence long-term competitiveness.
Opportunities
Digitalization of ground handling coordination and billing
Digital platforms streamline flight coordination, resource allocation, and real-time communication across stakeholders. Automated billing systems reduce reconciliation errors and administrative workload. Data visibility improves turnaround predictability and customer satisfaction. Integration with airport systems enhances situational awareness. Digital tools support compliance documentation management efficiently. Adoption accelerated during recent operational cycles. Providers gain differentiation through transparency. Analytics enable performance benchmarking across services. Scalability improves without proportional staffing increases. Digitalization strengthens long-term operational resilience.
Value-added concierge and cabin support services
High-net-worth passengers increasingly demand personalized concierge and cabin support offerings. Services include bespoke catering, security coordination, and crew assistance solutions. Differentiation through experience quality enhances customer loyalty. Charter operators leverage premium services for pricing leverage. Cabin refurbishment and cleaning standards continue rising. Partnerships with luxury service providers expand offerings. Revenue diversification improves business stability. Staff specialization enhances service consistency. Demand remains resilient during traffic fluctuations. These services elevate overall handling value propositions.
Future Outlook
The market outlook toward 2035 remains positive, supported by sustained regional business aviation demand and infrastructure reliability. Digital integration and service differentiation will shape competitive positioning. Capacity management and cost efficiency will remain strategic priorities. Singapore is expected to retain its hub status amid evolving Asia-Pacific aviation dynamics.
Major Players
- dnata
- SATS
- Jet Aviation
- ExecuJet
- Universal Aviation
- Signature Aviation
- Swissport
- Menzies Aviation
- Jetex
- Hawker Pacific
- Asia Jet Partners
- Changi Airport Group
- SIA Engineering Company
- FBO One
- Luxaviation Services
Key Target Audience
- Business jet operators and charter companies
- Corporate flight departments
- High-net-worth individuals and family offices
- Aircraft management companies
- Fixed base operators and airport service providers
- Investments and venture capital firms
- Civil Aviation Authority of Singapore
- Ministry of Transport Singapore
Research Methodology
Step 1: Identification of Key Variables
Key variables included fleet mix, flight frequency patterns, service scope depth, and regulatory operating requirements across Singapore’s business aviation ecosystem.
Step 2: Market Analysis and Construction
Service demand structures were analyzed by application, fleet utilization intensity, and operational workflows to construct coherent market behavior frameworks.
Step 3: Hypothesis Validation and Expert Consultation
Insights were validated through structured discussions with ground handling professionals, airport operators, and aviation compliance specialists.
Step 4: Research Synthesis and Final Output
Findings were consolidated through cross-validation and logical reconciliation to ensure internal consistency and practical relevance.
- Executive Summary
- Research Methodology (Market Definitions and business aviation ground handling scope at Singapore airports, Fleet type and service taxonomy aligned to business jet operations, Bottom-up market sizing based on movements and service contracts, Revenue attribution by handling service line and aircraft class, Primary interviews with FBO operators airport authorities and charter operators)
- Definition and Scope
- Market evolution
- Usage and operational workflows for business aviation
- Ecosystem structure across FBOs airports and service providers
- Supply chain and service delivery structure
- Regulatory and aviation compliance environment

- Growth Drivers
Rising business jet traffic through Singapore as a regional hub
Growth in ultra-long-range jet deployments in Asia-Pacific
Increasing charter and managed aircraft activity
Demand for premium concierge and rapid turnaround services
Singapore’s stable regulatory and aviation infrastructure
Expansion of Seletar Airport business aviation ecosystem - Challenges
Limited airport slots and apron capacity constraints
High operating and labor costs in Singapore
Regulatory compliance and security requirements
Volatility in charter demand linked to macroeconomic cycles
Intense service quality expectations from high-end clientele
Dependence on international traffic flows - Opportunities
Digitalization of ground handling coordination and billing
Value-added concierge and cabin support services
Growth in medical and government mission handling
Partnerships with aircraft management and charter firms
Sustainability-focused ground operations and SAF logistics
Regional spillover demand from Southeast Asia - Trends
Adoption of integrated FBO and trip support platforms
Increasing demand for discreet and secure VIP handling
Outsourcing of specialized handling services
Focus on sustainability and carbon reporting in ground operations
Rising use of Seletar Airport for dedicated business aviation
Premium pricing for guaranteed turnaround performance - Government Regulations
- SWOT Analysis
- Stakeholder and Ecosystem Analysis
- Porter’s Five Forces Analysis
- Competition Intensity and Ecosystem Mapping
- By Value, 2020–2025
- By Aircraft Movements Handled Volume, 2020–2025
- By Active Handling Contracts and Based Aircraft, 2020–2025
- By Revenue per Turnaround and Service Unit Economics, 2020–2025
- By Fleet Type (in Value %)
Light business jets
Midsize business jets
Large cabin and ultra-long-range jets
VIP configured airliners - By Application (in Value %)
Charter and fractional operations
Corporate and private ownership
Government and diplomatic flights
Medical evacuation and special missions - By Technology Architecture (in Value %)
Manual and legacy handling systems
Digitally integrated ground operations platforms
AI-enabled scheduling and dispatch tools - By End-Use Industry (in Value %)
Corporate enterprises
High-net-worth individuals and family offices
Charter operators and management companies
Government and defense agencies - By Connectivity Type (in Value %)
Standalone ground handling services
Integrated FBO and trip support connectivity
Airport systems and ATC-integrated connectivity
- Market structure and competitive positioning
Market share snapshot of major players - Cross Comparison Parameters (Service portfolio breadth, Airport access and slots, Fleet handling capability, Digital operations maturity, Pricing structure, Turnaround time performance, Regulatory compliance track record, Customer service quality)
- SWOT Analysis of Key Players
- Pricing and Commercial Model Benchmarking
- Detailed Profiles of Major Companies
dnata
SATS
Jet Aviation
ExecuJet
Universal Aviation
Signature Aviation
Swissport
Menzies Aviation
Jetex
Hawker Pacific
Asia Jet Partners
Changi Airport Group
SIA Engineering Company
FBO One
Luxaviation Services
- Demand and utilization drivers
- Procurement and handling agreement dynamics
- Buying criteria and service level expectations
- Budget allocation and cost sensitivity
- Operational and regulatory risk factors
- Post-service support and relationship management
- By Value, 2026–2035
- By Aircraft Movements Handled Volume, 2026–2035
- By Active Handling Contracts and Based Aircraft, 2026–2035
- By Revenue per Turnaround and Service Unit Economics, 2026–2035


 Request a Sample
 Ask for Customization
 Get a Quote
 Enquire Now