
 Download PDF
Market Overview
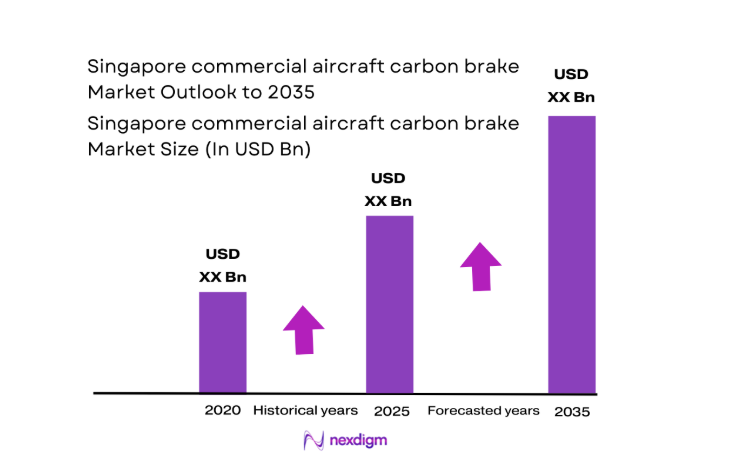
The Singapore commercial aircraft carbon brake market current size stands at around USD ~ million, reflecting a mature aftermarket anchored by intensive fleet utilization, frequent landing cycles, and strong maintenance ecosystems. Demand is shaped by carbon brake adoption across narrowbody and widebody fleets, lifecycle-driven replacements, and refurbishment programs routed through certified maintenance facilities. Supply continuity depends on OEM approvals, material yield consistency, and turnaround performance within overhaul shops, while logistics resilience supports line-fit and aftermarket availability across hub operations.
Activity concentrates around Singapore’s primary aviation hub and adjacent aerospace zones, where airline engineering teams, leasing managers, and MRO providers cluster around dense maintenance infrastructure. Strong air connectivity, cargo throughput concentration, and established bonded logistics facilitate rapid spares positioning and refurbishment cycles. Policy alignment with international airworthiness regimes sustains certification reciprocity, enabling cross-border maintenance flows. Ecosystem maturity is reinforced by long-term service agreements, digital maintenance planning, and integrated wheel-and-brake programs embedded in airline reliability management.
Market Segmentation
By Fleet Type
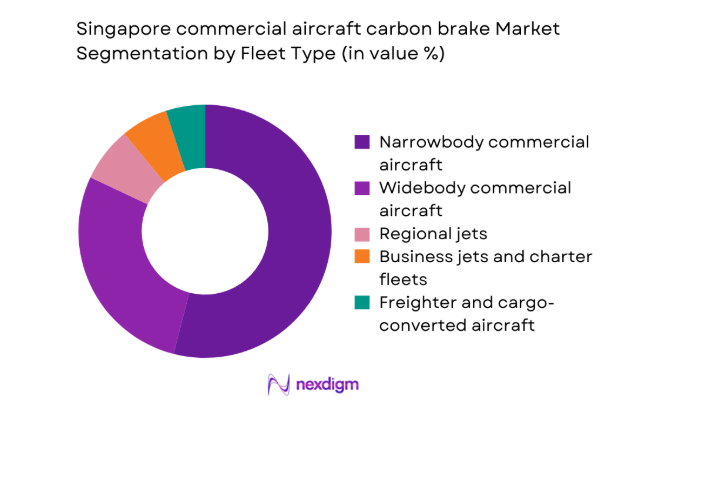
Narrowbody aircraft dominate carbon brake demand in Singapore due to high-frequency short-haul operations that generate elevated landing cycles and accelerated wear. Fleet commonality across popular narrowbody platforms simplifies spares pooling and standardizes brake shipsets within MRO workflows. Widebody aircraft contribute significant energy absorption requirements during long-haul operations and cargo missions, increasing refurbishment intensity per event. Business and charter fleets add episodic demand linked to utilization variability and leasing return conditions. Freighter conversions further elevate replacement cadence because of heavier landing weights and cycle concentration within regional cargo networks.
By Application
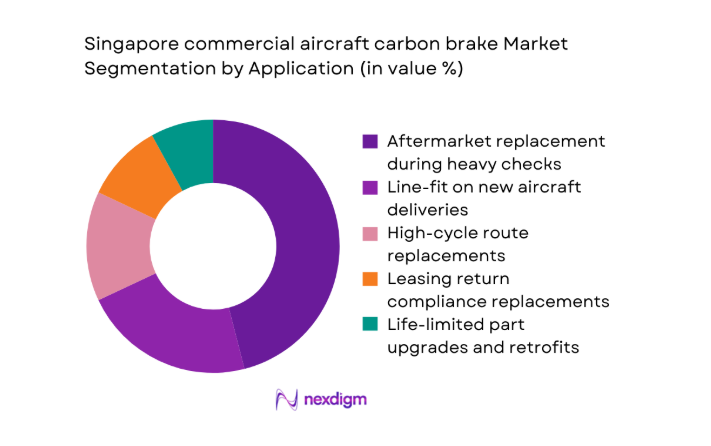
Aftermarket replacement dominates in Singapore as airlines prioritize turnaround reliability and life-limited part compliance during heavy checks. Line-fit demand is steadier and tied to delivery schedules routed through local acceptance and customization activities. High-cycle route operations accelerate brake stack replacements, while leasing return conditions impose standardized refurbishment thresholds. Retrofit programs expand where airlines align fleets to common specifications to simplify spares pooling and maintenance planning. Integrated wheel-and-brake service bundles are increasingly favored to stabilize uptime and predictability across operational peaks.
Competitive Landscape
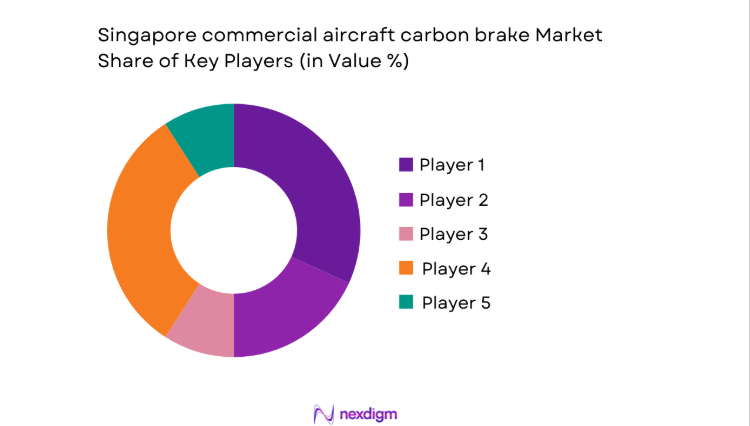
Competition is shaped by OEM approvals, depth of brake energy ratings across platforms, and the proximity of certified overhaul capabilities to airline hubs. Providers differentiate through turnaround performance, inventory localization, and integration with digital maintenance planning. Channel strength reflects long-term service agreements with airlines and lessors, while regulatory readiness determines eligibility for cross-border maintenance flows. Service capability and logistics responsiveness anchor competitive positioning within high-cycle narrowbody operations and heavy-check windows for widebody fleets.
| Company Name | Establishment Year | Headquarters | Formulation Depth | Distribution Reach | Regulatory Readiness | Service Capability | Channel Strength | Pricing Flexibility |
| Safran Landing Systems | 1925 | France | ~ | ~ | ~ | ~ | ~ | ~ |
| Collins Aerospace | 2018 | United States | ~ | ~ | ~ | ~ | ~ | ~ |
| Honeywell Aerospace | 1906 | United States | ~ | ~ | ~ | ~ | ~ | ~ |
| Meggitt Aircraft Braking Systems | 1947 | United Kingdom | ~ | ~ | ~ | ~ | ~ | ~ |
| Liebherr-Aerospace | 1949 | Switzerland | ~ | ~ | ~ | ~ | ~ | ~ |
Singapore commercial aircraft carbon brake Market Analysis
Growth Drivers
Expansion of Singapore as a regional MRO hub for widebody and narrowbody fleets
Singapore’s maintenance throughput expanded in 2024 and 2025 as hangar bays increased to 14 and certified technicians exceeded 8200, raising overhaul capacity for landing gear and braking assemblies. Civil aviation approvals recognized 27 additional component capabilities across 2024, shortening induction queues and increasing brake shop utilization. Fleet activity through the hub exceeded 42000 scheduled movements in 2024, intensifying landing cycle accumulation for narrowbody operations. Cargo flight movements rose to 180000 in 2025, elevating high-energy brake events on freighters. These institutional capacity expansions, workforce scale, and flight intensity collectively sustain accelerated brake refurbishment cycles and higher replacement frequency across fleets.
Rising landing cycle intensity from short-haul and high-frequency routes
Short-haul frequencies within Southeast Asia intensified during 2024 and 2025 as weekly departures surpassed 3100 across primary city pairs, compressing maintenance intervals for brakes. Average daily utilization for narrowbody aircraft reached 11 flight legs in 2025, compared with 9 in 2023, increasing thermal loading events per wheel set. Airport slot utilization exceeded 96 during peak hours, limiting schedule recovery buffers and driving reliability-centric maintenance planning. Operational disruptions recorded 2300 weather-related diversions in 2024, elevating rejected takeoff and high-energy stop occurrences. These operational indicators increase brake wear events and justify higher refurbishment throughput within certified workshops.
Challenges
High upfront cost of carbon brake shipsets versus steel alternatives for smaller operators
Smaller operators face capital constraints as fleet utilization fluctuates, with financing rates tightening across 2024 and 2025 when policy rates averaged 5. Workforce costs for certified technicians increased by 14 in 2024 and 11 in 2025, elevating maintenance budgets and extending approval cycles. Parts lead times for carbon preforms stretched to 26 weeks during 2024 due to constrained upstream capacity. Inventory carrying limits at bonded warehouses capped stock days at 45, increasing exposure to AOG events. These institutional and supply constraints disproportionately affect smaller fleets with limited pooling, delaying transitions and complicating lifecycle planning for carbon brake adoption.
Dependence on OEM-approved parts limiting aftermarket supplier entry
Certification pathways tightened in 2024 as approval audits increased to 18 per year, extending onboarding timelines for alternative repair schemes. Engineering order processing cycles averaged 64 days in 2025, slowing introduction of equivalent refurbishment processes. Technical documentation updates exceeded 120 revisions across braking assemblies during 2024, raising compliance overhead. Quality escape thresholds were set at 2 per 10000 components, prompting conservative acceptance criteria. These governance and compliance burdens constrain supplier diversity, reduce repair scheme flexibility, and prolong qualification windows, limiting competitive pressure and slowing innovation in refurbishment methods for carbon brake stacks.
Opportunities
Aftermarket service growth through CAAS-approved brake overhaul capabilities
Component shop authorizations expanded by 9 approvals in 2024 and 7 in 2025, enabling additional brake refurbishment lines within the hub. Turnaround targets improved from 18 days to 12 days as process automation increased across 4 new lines. Technician certification throughput reached 640 trainees in 2025, improving capacity resilience. Fleet maintenance events scheduled locally increased to 2200 in 2024, reducing ferry flights and downtime. These institutional expansions enable deeper aftermarket capture through localized overhaul, higher bay utilization, and faster return-to-service cycles for carbon brake assemblies across regional fleets.
Digital brake health monitoring adoption to optimize replacement intervals
Health monitoring deployments increased to 180 aircraft in 2024 and 260 in 2025 across narrowbody fleets operating short-haul networks. Data ingestion volumes exceeded 3 million records per month in 2025, supporting predictive wear modeling. False removal rates fell from 7 to 3 per 100 brake events following algorithm calibration in 2024. Maintenance planning accuracy improved with 28 additional parameters integrated into reliability dashboards. These indicators support condition-based maintenance, extend on-wing time within safety limits, and smooth shop loading, unlocking operational efficiency gains and improved availability for carbon brake refurbishment programs.
Future Outlook
Through the outlook period, Singapore’s role as a regional maintenance hub will continue to anchor demand for carbon brake overhaul and replacement. Integrated wheel-and-brake service models and digital health monitoring will reshape maintenance planning. Cargo network resilience and narrowbody utilization intensity will sustain refurbishment throughput. Regulatory alignment and local capability expansion are expected to reinforce cross-border maintenance flows and spares localization.
Major Players
- Safran Landing Systems
- Collins Aerospace
- Honeywell Aerospace
- Meggitt Aircraft Braking Systems
- Liebherr-Aerospace
- AAR Corp
- SIA Engineering Company
- ST Engineering Aerospace
- Lufthansa Technik
- Turkish Technic
- GMF AeroAsia
- Hawker Pacific Aerospace
- Safran Aerosystems Services Asia
- Hutchinson Aerospace
- AAR Asia Pacific
Key Target Audience
- Commercial passenger airlines
- Cargo and logistics airlines
- Aircraft leasing companies
- Independent MRO service providers
- Fleet technical management organizations
- Airport authorities and operations agencies
- Investments and venture capital firms
- Civil Aviation Authority of Singapore
Research Methodology
Step 1: Identification of Key Variables
Brake energy ratings, landing cycle intensity, fleet composition by platform, and shop capacity were defined as primary variables. Certification scope and approval pathways were mapped across component maintenance categories. Wear drivers and refurbishment yield constraints were established to frame operational dynamics.
Step 2: Market Analysis and Construction
Fleet utilization patterns, maintenance routing logic, and component turnaround benchmarks were structured into an operating model. Institutional indicators, workforce capacity, and approval throughput were aligned to maintenance demand formation. Supply chain lead times and logistics constraints were integrated to reflect operational frictions.
Step 3: Hypothesis Validation and Expert Consultation
Assumptions on wear drivers, turnaround improvements, and digital monitoring impacts were validated with certified engineers, maintenance planners, and reliability managers. Process constraints and approval bottlenecks were stress-tested against recent audit cycles and operational disruptions to refine assumptions.
Step 4: Research Synthesis and Final Output
Findings were reconciled across operational indicators, institutional capacity, and regulatory pathways. Scenario narratives were constructed to reflect utilization intensity, service model shifts, and capability expansion. Outputs were synthesized into actionable insights for maintenance planning and supplier strategy.
- Executive Summary
- Research Methodology (Market Definitions and civil aviation carbon brake system scope in Singapore MRO and fleet operations, Aircraft fleet taxonomy by narrowbody, widebody, regional jet and business aviation braking architectures, Bottom-up market sizing using fleet count, landing cycles and brake shipset replacement rates, Revenue attribution by OEM line-fit, retrofit and MRO aftermarket contracts in Singapore, Primary interviews with airline engineering heads)
- Definition and Scope
- Market evolution
- Usage and maintenance pathways within airline and MRO operations
- Ecosystem structure across OEMs, airlines, lessors and MROs
- Supply chain and distribution structure for line-fit and aftermarket
- Regulatory environment under CAAS, EASA and FAA mutual recognition

- Growth Drivers
Expansion of Singapore as a regional MRO hub for widebody and narrowbody fleets
Rising landing cycle intensity from short-haul and high-frequency routes
Fleet renewal programs favoring carbon brakes for weight and performance benefits
Growth in cargo and freighter operations driving higher brake wear rates
Airline focus on fuel efficiency and lifecycle cost reduction - Challenges
High upfront cost of carbon brake shipsets versus steel alternatives for smaller operators
Dependence on OEM-approved parts limiting aftermarket supplier entry
Volatility in airline maintenance budgets during traffic downturns
Supply chain sensitivity to carbon composite material lead times
Technical constraints in refurbishment yield and turnaround time at MRO shops - Opportunities
Aftermarket service growth through CAAS-approved brake overhaul capabilities
Digital brake health monitoring adoption to optimize replacement intervals
Partnerships between OEMs and Singapore MROs for regional distribution hubs
Freighter conversion growth increasing high-energy braking demand
Leasing-driven standardization of carbon brake specifications across fleets - Trends
Shift toward integrated wheel-and-brake service contracts
Increasing use of predictive maintenance analytics for brake wear forecasting
Localization of spare brake inventory in Singapore free trade zones
Long-term service agreements between airlines and brake OEMs
Sustainability initiatives to improve carbon brake refurbishment and recycling yields - Government Regulations
- SWOT Analysis
- Stakeholder and Ecosystem Analysis
- Porter’s Five Forces Analysis
- Competition Intensity and Ecosystem Mapping
- By Value, 2020–2025
- By Volume, 2020–2025
- By Installed Base, 2020–2025
- By Average Selling Price, 2020–2025
- By Fleet Type (in Value %)
Narrowbody commercial aircraft
Widebody commercial aircraft
Regional jets
Business jets operated by charter and corporate fleets
Freighter and cargo-converted aircraft - By Application (in Value %)
Line-fit on new aircraft deliveries
Aftermarket replacement during heavy checks
RTO and high-cycle route replacements
Leasing return condition compliance replacements
Life-limited part upgrades and retrofits - By Technology Architecture (in Value %)
Monolithic carbon brake discs
Segmented carbon brake stacks
High-energy absorption carbon composites
Oxidation-resistant coated carbon systems
Integrated brake and wheel package solutions - By End-Use Industry (in Value %)
Passenger airlines
Cargo and logistics airlines
Aircraft leasing companies
MRO service providers
Business aviation operators - By Connectivity Type (in Value %)
Non-connected conventional brake systems
Brake health monitoring enabled systems
Aircraft health management integrated brake systems
Predictive maintenance enabled brake solutions - By Region (in Value %)
Singapore domestic operations
Singapore-based MRO servicing Asia-Pacific fleets
Transit and hub operations serving long-haul fleets
Free trade zone and bonded warehouse distribution hubs
- Market structure and competitive positioning
Market share snapshot of major players - Cross Comparison Parameters (Fleet coverage breadth, OEM line-fit approvals, MRO network footprint in Asia-Pacific, Brake energy absorption rating, Turnaround time for overhaul, Total lifecycle cost per landing cycle, Digital health monitoring capability, Local inventory and spares availability)
- SWOT Analysis of Key Players
- Pricing and Commercial Model Benchmarking
- Detailed Profiles of Major Companies
Safran Landing Systems
RTX Collins Aerospace
Honeywell Aerospace
Meggitt Aircraft Braking Systems
Liebherr-Aerospace
AAR Corp
SIA Engineering Company
ST Engineering Aerospace
Safran Aerosystems Services Asia
Hawker Pacific Aerospace
Turkish Technic
Lufthansa Technik
GMF AeroAsia
AAR Asia Pacific
Hutchinson Aerospace
- Demand and utilization drivers
- Procurement and tender dynamics
- Buying criteria and vendor selection
- Budget allocation and financing preferences
- Implementation barriers and risk factors
- Post-purchase service expectations
- By Value, 2026–2035
- By Volume, 2026–2035
- By Installed Base, 2026–2035
- By Average Selling Price, 2026–2035


 Request a Sample
 Ask for Customization
 Get a Quote
 Enquire Now