
 Download PDF
 Download PDF
Market Overview
The Southeast Asia cross‑border e‑commerce logistics market is valued at USD 8.07 billion, according to a comprehensive analysis that establishes this figure by mapping shipment volumes, service types, and logistics cost structures. This valuation reflects robust expansion in courier, express, and parcel services shaped by increasing cross‑border online purchases, improved digital infrastructure, and growing fulfillment capabilities. Global demand for faster, reliable delivery and parcel tracking, along with merchant expansion across member countries, have solidified this market’s growth trajectory from the previous year.
Singapore drives this market within Southeast Asia due to its world‑class port infrastructure, mature airfreight network, efficient customs clearance, and Integrated Logistics Platforms operating from Changi and Jurong. Its role as a regional logistics hub enables economies of scale, just‑in‑time shipping, and integration with fintech and e‑commerce platforms. Malaysia and Indonesia also contribute significantly, supported by high consumer demand, improving warehousing infrastructure, and proximity‑based trade flows with Singapore and neighboring regions.
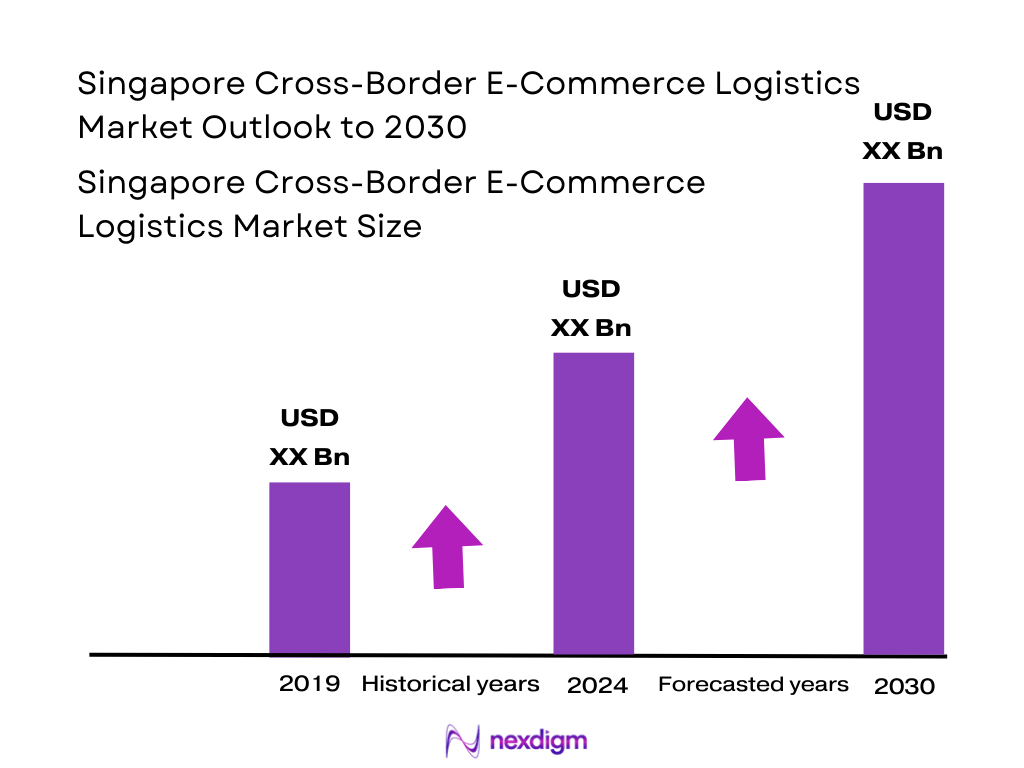
Global cross‑border e‑commerce logistics market is estimated at USD 119.29 billion in 2024 and is projected to reach USD 463.68 billion by 2030, translating to a CAGR of 25.4%. Southeast Asia segment specifically is estimated at USD 8.07 billion for 2024 and is forecast to reach USD 9.08 billion in 2025, with a projected CAGR of approximately 11.14% through 2030.
Market Segmentation
By Service Type
The Southeast Asia cross‑border e‑commerce logistics market is segmented into express courier, consolidated freight (air and ocean LCL), warehousing & fulfillment, and customs brokerage/value‑added services. Express courier services dominate the market share—attractive for e‑commerce merchants due to speed, reliability, and end‑to‑end tracking. Leading providers such as DHL Express, FedEx, and regional express operators offer SLA‑backed delivery, which commands price premiums and high customer preference. Consolidated freight serves larger volumes and lower‑value goods, but is less dominant due to transit time—and it remains secondary compared to express for typical online purchases. Warehousing & fulfillment—particularly bonded/FTZ hubs near Singapore—support inventory staging and DDP flows, while brokerage and value‑added services augment express delivery but account for smaller standalone revenue shares.

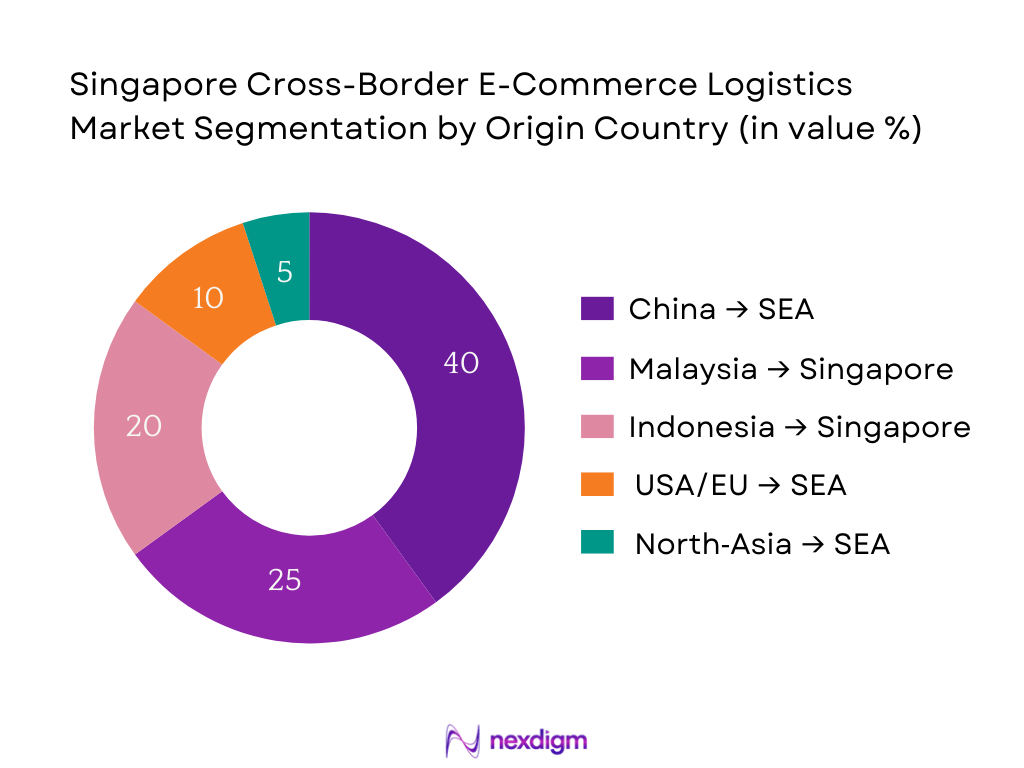
By Origin Country
The market is segmented primarily by trade lanes—China, Malaysia, Indonesia, USA/EU, and North‑Asia. The China‑to‑Southeast Asia corridor leads market share, owing to high volumes of consumer electronics, fashion, and general merchandise exported via well‑developed cross‑border parcel networks. This corridor benefits from established logistics partnerships, trade agreements, and platform‑driven seller ecosystems. Malaysia‑Singapore and Indonesia‑Singapore lanes follow, fueled by regional proximity and frequent express truck and air linkages. Long‑haul lanes from USA/EU and North‑Asia, while valuable for premium goods, contribute smaller shares due to longer transit, higher tariffs, and cost. However, they remain strategic for luxury, niche categories and contribute to overall diversified service flows.
Competitive Landscape
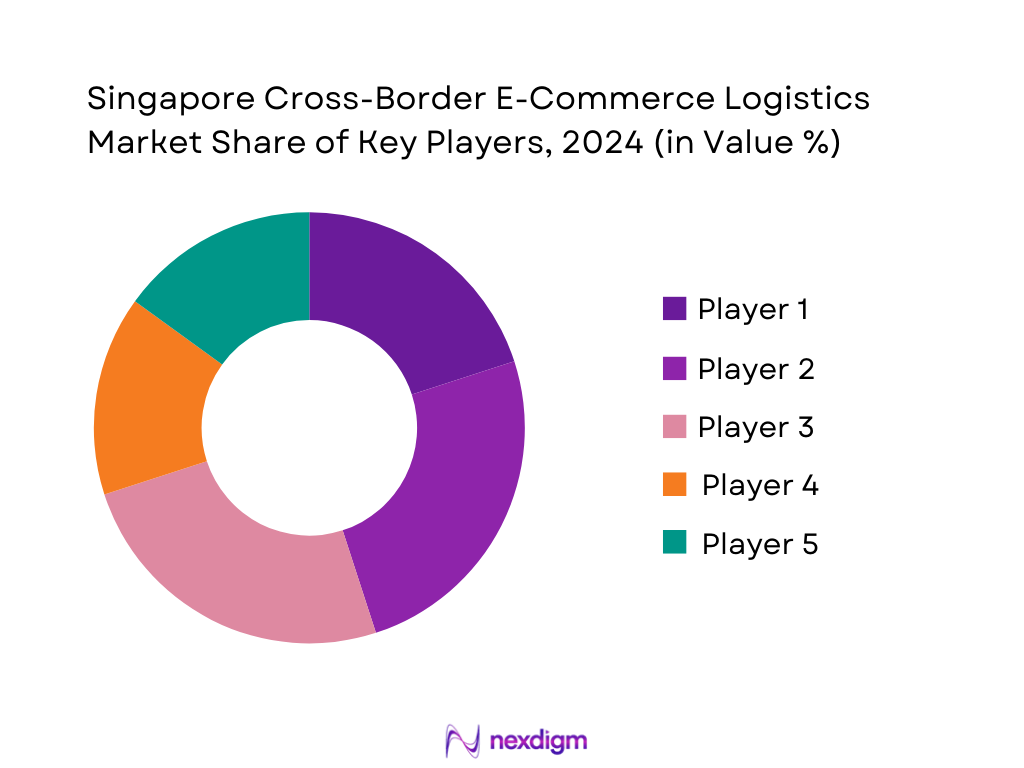
The Southeast Asia cross‑border e‑commerce logistics market is shaped by both global express giants and agile regional operators. Global players like DHL, FedEx, UPS, and Aramex lead with robust infrastructure and reliability, while regional specialists such as Ninja Van, J&T Express, and Qxpress differentiate through cost‑effective last‑mile networks and digital integrations. This dual landscape underscores a competitive yet complementary market structure where scale and local adaptability coexist.
| Company | Establishment Year | Headquarters | FTZ/Warehouse Access | Digital Integration & APIs | Lane Coverage Depth | Customs Clearance Speed | First-Attempt Delivery Rate |
| Singapore Post | 1819 | Singapore | – | – | – | – | – |
| DHL Express | 1969 | Germany | – | – | – | – | – |
| FedEx Express | 1973 | USA | – | – | – | – | – |
| UPS Singapore | 1907 (parent) | USA (Global HQ) | – | – | – | – | – |
| Ninja Van | 2014 | Singapore | – | – | – | – | – |
Singapore Cross‑Border E‑Commerce Logistics Market Analysis
Growth Drivers
Free Trade Agreements (FTAs)
Singapore’s merchandise trade rebounded with a 4.8 percent year-on-year increase in Q1 2024, driven by higher oil prices and improved external demand. Non-oil domestic exports (NODX) faced a 3.4 percent decline in the same period, highlighting both integration and vulnerabilities in trade flows. Singapore’s extensive network of FTAs—with partners like the EU, US, Japan, Korea, and others—facilitates smoother customs procedures, tariff reductions, and preferential market access, especially relevant for cross-border logistics. The volume increase in trade supports higher parcel and freight throughput, benefiting logistics players that leverage these trade corridors.
Digital Infrastructure
Singapore ranks at the top globally in human capital development and digital readiness, reflecting a mature digital foundation conducive to logistics tech integration. While GDP indicates capacity, underlying digital infrastructure enables advanced tracking systems, API-driven integrations, and seamless data exchange among logistics partners and border agencies. The country’s digital platforms—like SingPass and government data-sharing initiatives—enable over 100 million data exchanges through UGHub involving both public and private entities since inception, evidencing strong digital interconnectivity that underpins efficient cross-border logistics coordination.
Market Challenges
Customs Complexity
Although non-oil exports rebounded in early 2024, Singapore’s economy remains highly susceptible to global trade frictions: exports to the U.S.—constituting 11 percent of total exports in 2024—face new tariff impacts, with 55 percent of these shipments affected by the baseline 10 percent tariff. Such volatility introduces complexity in customs clearance processes and creates uncertainty for logistics providers, who must adapt quickly to changing regulatory conditions and ensure compliance to maintain smooth cross-border flows.
Pricing Wars
In a high-income economy where GDP per capita is USD 90,689, logistics operators face pressure to deliver cost-effective services without compromising quality. However, increased competition and commoditization of express services prompt providers to reduce margins, potentially affecting service standards. Macro indicators like the softened economic growth forecast to 1.0–3.0 percent for 2025, despite a strong 2024, signal potential revenue pressures ahead. Competitors may engage in aggressive pricing to capture volume, challenging the profitability and service consistency in the logistics sector.
Market Opportunities
ASEAN Gateway
Singapore’s trade-to-GDP ratio exceeding three times GDP underscores its role as a key regional transshipment hub. Its position as a central node in ASEAN trade, coupled with advanced port and air infrastructure, creates opportunity for logistics players to act as gateways, consolidating shipments from ASEAN into global supply chains. The rebound in merchandise trade (+4.8 percent in Q1) and robust external demand further reinforce Singapore’s strategic position where e-commerce parcels from neighboring countries can efficiently flow to global buyers, tapping regional logistics arbitrage.
B2B2C Models
Strong economic fundamentals—a 4.4 percent GDP growth in 2024 and high per capita income—have spurred both consumer and small merchant adoption of cross-border channels. Logistics providers can expand into B2B2C models, offering SMEs bundled services that integrate warehousing, customs brokers, fulfillment, and last-mile delivery across borders. This is supported by Singapore’s streamlined trade infrastructure and digital integration, offering SMEs affordable access to international markets. The macroeconomic strength provides confidence to invest in such platforms that bridge businesses to global consumers.
Future Outlook
Over the next several years, the Southeast Asia cross‑border e‑commerce logistics market is expected to continue its upward trajectory, supported by rising digital commerce penetration, investment in warehouse and port infrastructure, and increased merchant reliance on DDP-enabled shipping. Southeast Asian countries’ e‑commerce adoption—especially in mature markets like Singapore—will drive demand for fast, transparent, and compliant logistics solutions. Innovations in AI‑driven routing, automated sort hubs, and last‑mile consolidation will further optimize operational efficiency. Governmental trade facilitation policies, expanded FTZ networks, and regional trade agreements will also play pivotal roles in reducing clearance friction and enabling scalable growth.
Major Players
- Singapore Post (SingPost)
- DHL Express
- DHL eCommerce Solutions
- FedEx Express
- UPS Singapore
- Aramex Singapore
- Ninja Van
- J&T Express Singapore
- Qxpress Singapore
- SF Express (Singapore)
- Cainiao (Alibaba)
- Janio Asia
- Kerry Logistics Network
- Asendia Singapore
- Quantium Solutions
Key Target Audience
- Cross‑border e‑commerce merchants and online brands
- Logistics and fulfilment providers
- Investments and venture capitalist firms
- Freight forwarders and NIL2 operators
- Customs brokers and bonded warehouse operators
- Payment and e‑commerce platform managers
- Government and regulatory bodies (Immigration & Checkpoints Authority, Singapore Customs, Enterprise Singapore)
- Supply‑chain digital solution vendors
Research Methodology
Step 1: Identification of Key Variables
We began by constructing a detailed ecosystem map of all stakeholders—couriers, fulfilment centers, customs agents, digital platforms—via extensive desk research across secondary sources, trade data, and proprietary shipment databases to determine market-driving variables like parcel volumes, lane frequencies, and cost components.
Step 2: Market Analysis and Construction
This phase involved compiling historical data on parcel volumes, mode-specific linehaul flows, and service pricing. We assessed penetration rates of express versus consolidated services, merchant preferences, and logistics provider throughput to model revenue generation and market sizing.
Step 3: Hypothesis Validation and Expert Consultation
We developed initial market hypotheses on segment dominance and growth drivers, validated through interviews (via CATI and video calls) with operations leads from logistics firms, customs agents, and marketplace executives to refine assumptions and align with operational realities.
Step 4: Research Synthesis and Final Output
Finally, we engaged directly with select operators and customs clearance agencies to validate node-level throughput, FTZ capacities, cut-off times, and technology integration, verifying bottom-up estimates and ensuring the analysis reflects ground‑truth and is robust for strategic use.
- Executive Summary
- Research Methodology (Market Definition, Assumptions, Abbreviations, Top-Down Approach, Bottom-Up Approach, Shipment Analysis, Air Freight vs. Ocean Parcel Flow Modeling, Expert Interviews, Market Sizing Logic, Limitations)
- Market Definition and Scope
- Evolution of Cross-Border E-Commerce in Singapore
- Logistics Flow & Value Chain Mapping
- Cross-Border Trade Cycle – First Mile to Last Mile
- Market Entry Channels – DDP, DDU, Bonded & FTZ
- Integration of Fulfillment with Customs & Clearance Models
- Overview of Stakeholders – 3PLs, CEP Players, Customs Agents, Marketplaces, Freight Consolidators

- Growth Drivers (Government Support, FTAs, Digital Infrastructure)
- Market Challenges (Returns Management, Customs Complexity, Pricing Wars)
- Market Opportunities (OVR Enablement, ASEAN Gateway, B2B2C Models)
- Trends (Locker Network Expansion, Green Logistics, Carrier Aggregation)
- Regulatory Landscape (GST Policy, Controlled Goods, Import Permits, FTZ Use)
- SWOT Analysis
- Stakeholder Ecosystem
- Porter’s Five Forces Analysis
- E-Commerce Integration – Payment Gateways, Inventory Sync, APIs
- Total Market Size – By Value, 2019-2024
- Market Size – By Number of Parcels, 2019-2024
- Market Size – By Weight Band (0-2kg, 2-5kg, 5-20kg, >20kg), 2019-2024
- Market Size – By Linehaul Mode (Air, Ocean, Road), 2019-2024
- Market Size – By Delivery Model (DDP, DDU), 2019-2024
- By Origin Country (In Value %)
China
Malaysia
Indonesia
United States
South Korea
Japan
Vietnam
Australia - By Delivery Model (In Value %)
DDP (Delivered Duty Paid)
DDU (Delivered Duty Unpaid)
Zero-GST Warehouse Models
Exempted/Controlled Category Imports - By Linehaul Mode (In Value %)
Air Courier
Air Freight Consolidated
Ocean Freight (LCL/FCL)
Cross-Border Trucking via Malaysia - By Fulfillment & Warehouse Model (In Value %)
Fulfilled by Marketplace
Seller-Fulfilled International
Local Bonded Warehouse Fulfillment
FTZ + Forward Staging - By End Product Category (In Value %)
Apparel & Footwear
Electronics & Gadgets (IMDA)
Health, Beauty & Supplements (HSA)
Food, Beverages & FMCG (SFA)
Jewelry & Luxury Goods
Homeware & Appliances
- Market Share Analysis – By Value and Parcel Count
Market Share – By Origin Lane and Weight Band - Competitive Differentiation Parameters (FTZ Capability, Linehaul Access, Customs Clearance Speed, SLA Adherence, Technology Stack, Category Certifications, RTO Handling, Locker Coverage)
- SWOT Analysis of Key Players
- Pricing Matrix – Cross-Border Weight Slabs (Air vs Ocean vs Truck)
- Detailed Company Profiles
Singapore Post (SingPost)
Qxpress Singapore
Ninja Van
J&T Express Singapore
DHL Express
DHL eCommerce Solutions
FedEx Express Singapore
UPS Singapore
Aramex Singapore
Janio Asia
SF Express (Singapore)
Cainiao Logistics (Alibaba Group)
Kerry Logistics
Asendia Singapore
Ninja Direct
- Merchant Fulfillment Models
- SME and Large Seller Cross-Border Adoption
- Marketplace Expectations and SLAs
- Shipping Preferences by Segment
- D2C vs Marketplace Dynamics
- Buyer Return Behavior
- Cross-Border Checkout Preferences
- Compliance Readiness by Category Sellers
- By Value, 2025-2030
- By Parcel Count, 2025-2030
- By Origin Lane, 2025-2030
- By Delivery Model, 2025-2030
- By Service Type, 2025-2030


 Request a Sample
 Ask for Customization
 Get a Quote
 Enquire Now