 Download PDF
Market Overview
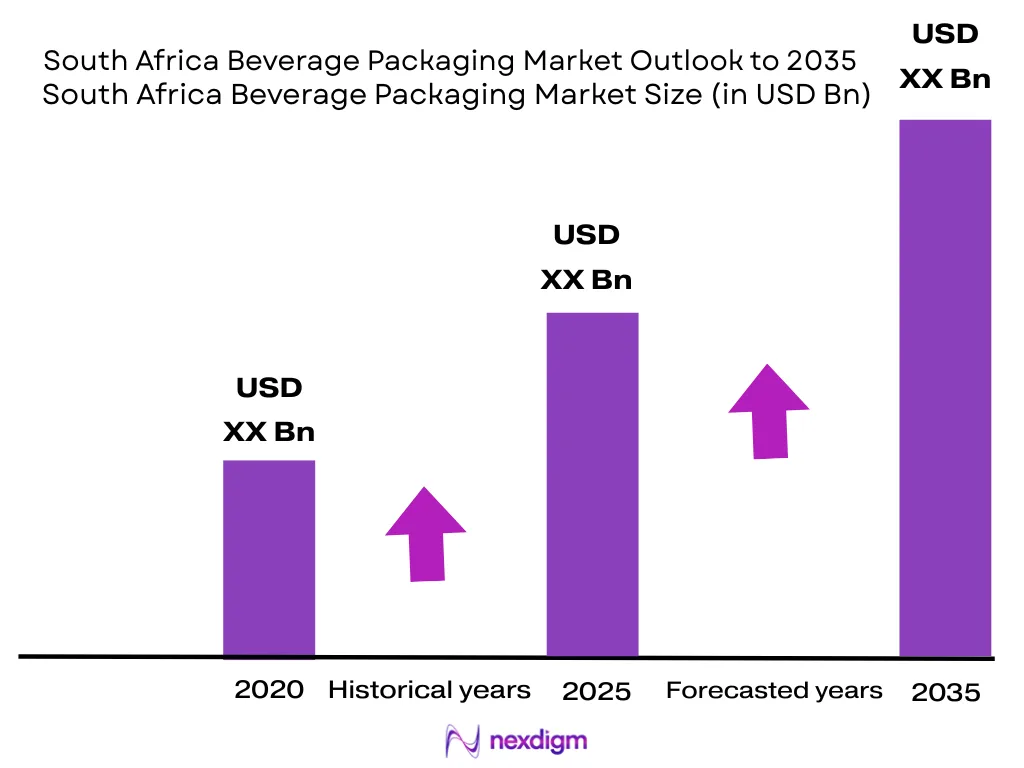
The South Africa Beverage Packaging Market is valued at approximately USD ~ billion and is forecast to expand at a CAGR of % during 2026–2035. Nominal GDP increased from approximately R7.0 trillion to R7.3 trillion across the two latest annual readings. Demand is generated by carbonated soft drinks, beer, cider, wine, packaged water, dairy beverages, juices and energy drinks requiring bottles, cans, cartons, closures, labels and transport packaging. Gauteng, the Western Cape and KwaZulu-Natal dominate South Africa’s beverage-packaging ecosystem. Gauteng combines major consumer markets, bottling operations, PET conversion, metal-can production, glass manufacturing and national distribution. The Western Cape benefits from wine, cider, juice, dairy and export-packaging activity, while KwaZulu-Natal supports beverage filling, plastics conversion, port logistics and aluminium recycling. Gqeberha, East London and Bloemfontein provide additional manufacturing and inland distribution capacity.
Market Segmentation
By Packaging Material
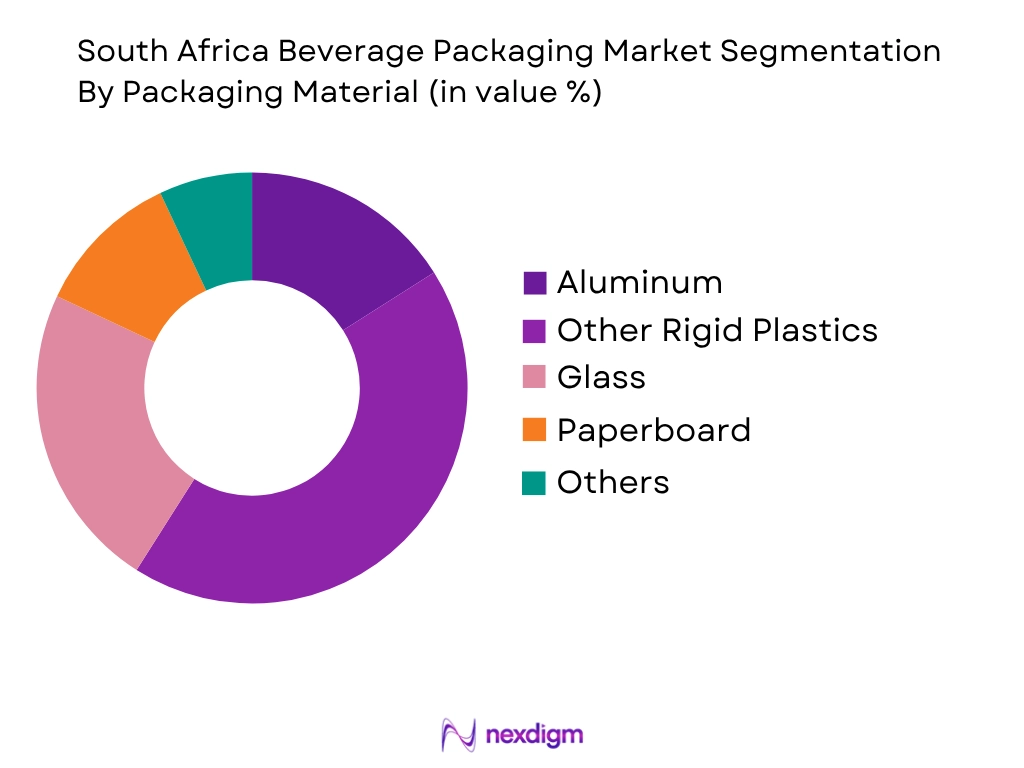
The South Africa Beverage Packaging Market is segmented into PET and other rigid plastics, glass, aluminium and steel, paperboard and liquid-board cartons, and flexible or composite packaging. PET and other rigid plastics hold the dominant indicative position because packaged water, carbonated soft drinks, juice, dairy drinks and family-size beverages rely on PET bottles, preforms, closures and labels. PET is lightweight, transparent, resealable and compatible with high-speed filling and national road distribution. Glass remains substantial because beer, cider, wine, spirits and selected soft drinks use one-way and returnable bottles. Metal cans are established across beer, energy drinks, carbonated beverages, cider and ready-to-drink alcohol. Cartons serve milk, juice and shelf-stable products, while flexible packaging is important in wine bag-in-box, concentrates, dairy pouches and powdered drinks.
By Beverage Category
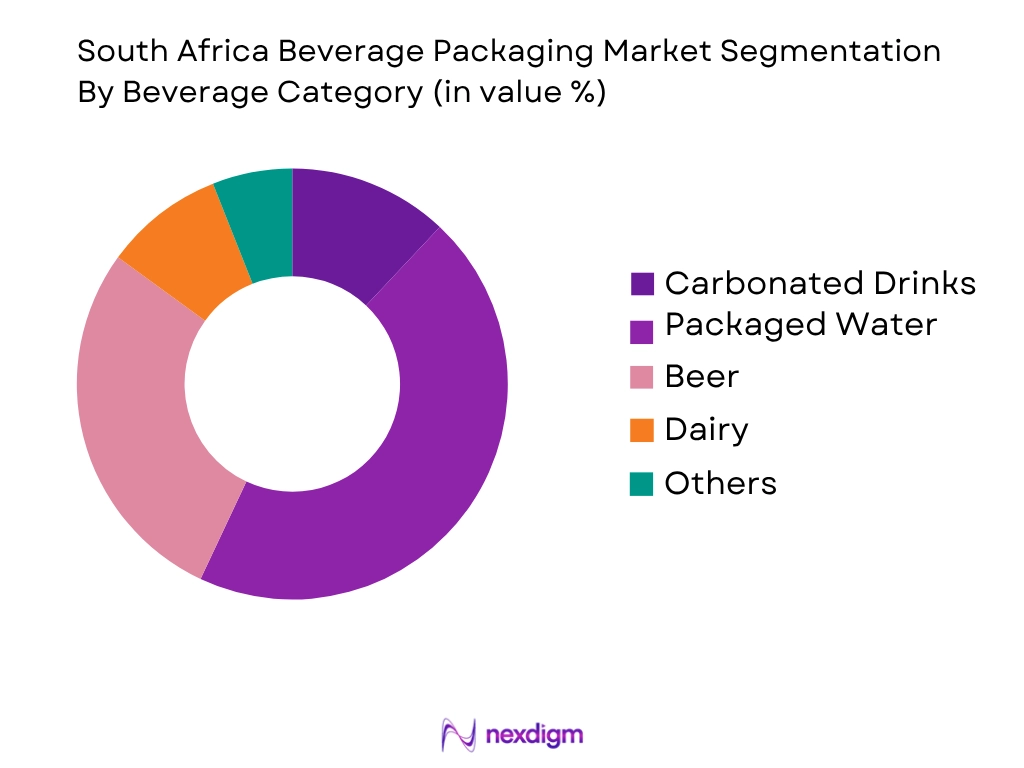
The South Africa Beverage Packaging Market is segmented into carbonated soft drinks, beer, packaged drinking water, wine and spirits, cider and ready-to-drink alcohol, dairy beverages, juices, energy drinks and functional products. Carbonated soft drinks hold the dominant indicative share because national and regional bottlers distribute single-serve and family-size PET bottles, aluminium cans, returnable glass bottles, fountain syrup packs and retail multipacks through supermarkets, wholesalers, convenience stores, petrol stations and informal retailers. Beer generates high demand for returnable glass, cans, kegs, crowns, cases and reusable crates. South Africa’s established wine industry supports glass bottles, corks, screw closures, labels, corrugated cases and bag-in-box systems. Packaged water supports lightweight PET and refillable containers, while dairy and juice products sustain demand for HDPE, PET, flexible pouches and liquid-board cartons.
Competitive Landscape
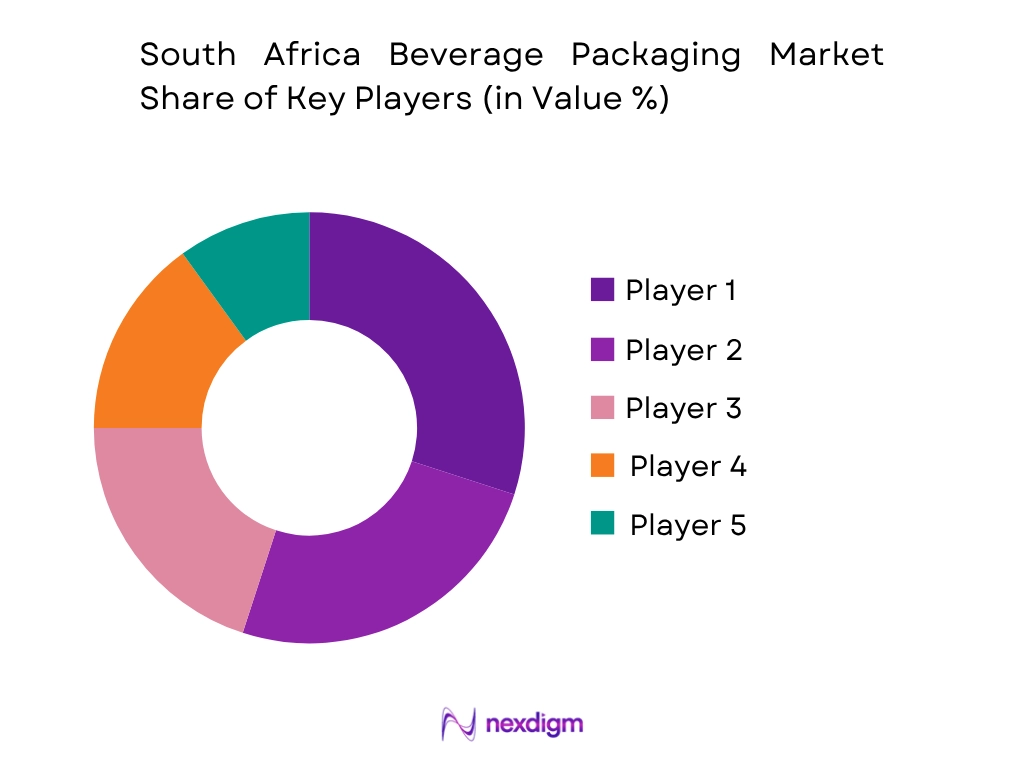
South Africa’s beverage-packaging market is led by established metal, glass, PET, paper and flexible-packaging companies with manufacturing assets near major beverage-filling corridors. Nampak holds a strong position in aluminium beverage cans, Ardagh Glass Packaging–Africa supplies glass containers, Mpact participates in PET preforms and secondary packaging, Polyoak supplies rigid plastics, and Tetra Pak serves liquid-food and beverage-carton applications. Competition centres on container capacity, plant proximity, line compatibility, lightweighting, food-grade recycled material and EPR support.
| Company | Establishment Year | Headquarters | Core Beverage Portfolio | Material Capability | Principal Applications | South Africa Footprint | Circularity Capability | Strategic Differentiation |
| Nampak | 1968 | Johannesburg, South Africa | ~ | ~ | ~ | ~ | ~ | ~ |
| Ardagh Glass Packaging–Africa | 2022 under Ardagh ownership; heritage approaching 80 years | Johannesburg area, South Africa | ~ | ~ | ~ | ~ | ~ | ~ |
| Mpact | 2004 group formation | Johannesburg, South Africa | ~ | ~ | ~ | ~ | ~ | ~ |
| Polyoak Packaging Group | 1976 operating heritage | Cape Town, South Africa | ~ | ~ | ~ | ~ | ~ | ~ |
| Tetra Pak South Africa | 1951 group heritage | Pully, Switzerland | ~ | ~ | ~ | ~ | ~ | ~ |
South Africa Beverage Packaging Market Analysis
Growth Drivers
Packaged Beverage Production and Multi-Channel Distribution
South Africa’s established beverage-manufacturing and distribution ecosystem drives demand for PET bottles, aluminium cans, returnable glass bottles, liquid-board cartons, flexible pouches, closures, labels, corrugated cases, reusable crates and high-speed filling equipment. Statistics South Africa recorded nominal GDP of R7.3 trillion in 2024, an increase of R312 billion from the preceding annual reading, while the national population reached approximately 63.02 million people. This economic and demographic base supports packaged water, carbonated soft drinks, beer, cider, wine, spirits, dairy beverages, juices, energy drinks and ready-to-drink products across formal and informal channels. Gauteng combines major bottling plants, can-making facilities, PET conversion, warehousing and national distribution. The Western Cape supports wine, cider, juice, dairy, glass-container and export-packaging activity, while KwaZulu-Natal provides beverage filling, plastics conversion, port logistics and aluminium-remelting infrastructure. Beverage packaging must serve supermarkets, cash-and-carry wholesalers, liquor stores, petrol stations, restaurants, taverns, shebeens, spaza shops, schools, workplaces, tourism establishments and direct-delivery operations. Each channel requires different package economics and handling performance. Spaza shops and informal retailers favour durable single-serve and sharing formats that fit limited shelf and refrigeration space. Breweries use aluminium cans, returnable glass bottles, crowns, reusable crates and kegs. Wine producers require glass bottles, corks, aluminium closures, labels, corrugated dividers and bag-in-box systems suitable for domestic distribution and exports. Packaged-water producers depend on lightweight PET, tamper-evident caps, shrink film and large refillable containers. Dairy processors use HDPE bottles, flexible pouches, gable-top cartons and aseptic packaging because cold-chain availability varies by region. The market also benefits from an extensive domestic converting base, including PET preform moulders, bottle blowers, glass furnaces, can-making lines, carton suppliers, closure manufacturers and paper converters. Local production reduces the need to transport empty containers over long distances and permits packaging engineers to work directly with beverage fillers on pressure resistance, cap torque, filling speed, bottle weight and pallet stability. South Africa’s economy continued recording positive quarterly momentum into 2026, while formal non-agricultural employment stood at 10.468 million positions in March 2026, indicating the scale of organised production, retail and logistics activity supporting beverage distribution. The combination of R7.3 trillion in annual output, 63.02 million consumers, multiple beverage categories and a nationwide mixed-channel retail system makes beverage packaging a structurally important industrial supply chain rather than a narrow container segment. Sources: Statistics South Africa.
Mandatory Packaging EPR and Material-Specific Recovery Systems
South Africa’s mandatory extended producer responsibility framework is shifting beverage-packaging procurement toward recyclable formats, verified recovery, recycled content and producer-funded collection infrastructure. The regulations apply to paper, plastic, glass and metal packaging and require producers and producer responsibility organisations to register, report packaging placed on the market and finance collection or recycling activities. Beverage producers must therefore account for the PET bottle, closure, label, shrink sleeve, multipack film, aluminium can, steel component, glass bottle, liquid-board carton and corrugated transport case used within each packaging system. The effect is visible in recent material-recovery results. Petco reported that its 2024 operations met legislated collection and recycling obligations for 99 out of every 100 tonnes of identified products placed on the market by participating members. MetPac-SA reported that aluminium used-beverage cans represented 54 out of every 100 tonnes declared within its relevant portfolio. Its 2024 results recorded collection of 77 cans out of every 100 placed into the measured stream, recycling of 61 cans out of every 100, and recycled material equivalent to 47 parts in every 100 parts of relevant can design. Tinplate packaging achieved collection of 61 containers out of every 100 and recycling of 63 containers out of every 100 under the organisation’s reporting framework. These figures demonstrate that EPR is influencing real material flows rather than remaining a documentation exercise. Beverage brands increasingly need suppliers that can provide precise component weights, material declarations, food-contact documentation, recyclability assessments and evidence supporting annual reports. Package design consequently becomes a compliance tool. Clear PET bottles, reduced pigmentation, smaller labels, washable adhesives and compatible caps improve sorting and bottle-to-bottle processing. Aluminium cans benefit from established scrap demand and domestic remelting capability. Returnable glass can reduce one-way container requirements where bottle deposits, washing plants and distributor backhaul are available. Liquid-board packaging requires dedicated collection and hydrapulping partnerships because its fibre, polymer and aluminium layers cannot be treated through ordinary paper recycling without suitable equipment. EPR funding also supports buy-back centres, balers, trailers, protective equipment and direct recycler relationships. One Limpopo buy-back centre supported through the packaging-recovery ecosystem collects around 82 tonnes of mixed recyclables each month, including approximately 18 tonnes of PET and 2 tonnes of liquid-board packaging, while sourcing material across a 200-kilometre radius from more than 200 waste pickers. South Africa’s R7.3 trillion economy and packaging-intensive beverage sector provide sufficient material throughput for these systems to scale. The regulatory driver therefore links beverage-container design, producer fees, waste-picker income, recycler capacity and access to secondary raw materials. Sources: Department of Forestry, Fisheries and the Environment, Petco, MetPac-SA and Statistics South Africa.
Market Challenges
Fragmented Collection and Inconsistent Beverage-Grade Feedstock
South Africa has a commercially active recycling sector, but beverage-packaging collection remains fragmented across municipal services, informal waste pickers, landfill recovery, buy-back centres, retailers, producer-funded projects, material recovery facilities and private recyclers. This fragmentation affects the quantity, quality and traceability of PET bottles, aluminium cans, steel containers, glass bottles, liquid-board cartons and secondary packaging available for reprocessing. Statistics South Africa estimated the national population at 63.02 million people in 2024, spread across large metropolitan regions, smaller towns, informal settlements and rural districts with very different waste-collection services. South Africa’s National Waste Management Strategy has identified approximately 62,000 people engaged in informal recyclable collection, illustrating how heavily the recovery system relies on workers operating outside conventional municipal employment. Waste pickers recover commercially valuable PET, aluminium, steel and cardboard, but they often face limited access to covered storage, balers, transport, protective equipment and stable purchasing agreements. Beverage-grade PET requires particularly controlled feedstock. Bottles collected from streets, landfills and mixed waste can contain liquids, oils, sand, PVC, coloured PET, labels, closures and unrelated plastics. These contaminants influence recycled resin colour, odour, intrinsic viscosity, acetaldehyde performance and suitability for new beverage bottles. PET bottles also occupy substantial vehicle volume unless they are baled, making long-distance movement from rural collection points inefficient. Glass creates another logistical challenge because it is heavy, breakable and must be separated from ceramics, stones, heat-resistant glass and metal contamination before furnace use. Clear, amber and green bottles may require colour separation depending on the intended container. Aluminium cans have strong scrap value, but informal collection data may be difficult to reconcile with brand-level EPR reporting. Liquid-board cartons have relatively low weight per package and require aggregation in meaningful volumes before transport to specialised hydrapulping facilities. Flexible beverage pouches combining plastic films, aluminium barriers, inks and adhesives are harder to recycle through conventional mechanical systems. Although Petco reported compliance for 99 out of every 100 tonnes of member material covered by its measured obligations in 2024, this does not mean every beverage package placed into the wider national market entered a closed-loop system. Collection performance differs by province, municipality, material and retail channel. South Africa’s nominal GDP of R7.3 trillion indicates substantial beverage throughput, yet packaging consumption alone cannot guarantee a stable supply of food-grade rPET, clean cullet or recovered carton fibre. Expanding regional buy-back centres, direct recycler contracts, retailer take-back, distributor backhaul and digital weighing systems would improve material traceability. Formalisation must preserve the role and income of waste pickers rather than displacing them with collection structures that ignore existing recovery networks. The primary challenge is therefore converting dispersed post-consumer packaging into consistent industrial feedstock with documented origin, predictable composition and sufficient volume for beverage-grade manufacturing. Sources: Statistics South Africa, Department of Forestry, Fisheries and the Environment and Petco.
Electricity Reliability, Capital-Intensive Conversion and Technical Compliance
Beverage-packaging production requires stable electricity, compressed air, process water, heat, cooling and precise quality control. PET preform injection, stretch-blow moulding, aluminium can forming, glass melting, paper converting, printing, closure moulding and high-speed filling are all vulnerable to utility interruptions and process instability. Glass production is particularly sensitive because furnaces must operate continuously at high temperature; an uncontrolled shutdown can damage equipment, reduce output and disrupt bottle supply to breweries, wineries and soft-drink plants. PET bottle production depends on stable heating profiles, compressed air and mould cooling. Aluminium can manufacturing requires body forming, washing, coating, printing, curing and end production under tightly controlled conditions. Beverage filling lines must synchronise depalletising, rinsing, filling, seaming or capping, coding, inspection, case packing and palletising at thousands of containers per hour. South Africa’s formal non-agricultural economy employed 10.468 million people in March 2026, while nominal GDP reached R7.3 trillion in 2024, demonstrating the scale of industrial and commercial activity exposed to operational disruptions. Packaging conversion also requires significant technical expertise. Increasing food-grade rPET content may affect preform heating, bottle clarity, colour, wall distribution and top-load strength. Reducing bottle weight can cause deformation, grip failure or pallet instability if the package is not redesigned around the filling and distribution process. Aluminium downgauging must retain seam performance and pressure resistance. Lightweight glass must remain compatible with filling equipment, bottle washers, reusable crates and repeated distribution cycles. Aseptic cartons require sterile processing, barrier integrity and accurate sealing. Bag-in-box systems must control oxygen transmission, tap performance and liner strength, especially for wine and juice. Food-contact compliance adds requirements for polymers, recycled resin, coatings, printing inks, adhesives and closure liners. Suppliers must maintain migration testing, conformity documentation, batch traceability and intended-use records. Smaller beverage producers may not have polymer scientists, glass technologists, can-seaming specialists or packaging laboratories in-house and therefore depend on converters and contract fillers. Capital intensity can widen the gap between large packaging groups and regional firms because modern inspection cameras, seam analysers, contamination-control systems, optical sorters, decontamination reactors and backup-generation equipment require substantial investment. Electricity risk also influences sustainability calculations: a package containing recycled material may still have a high operational burden if production relies on inefficient backup systems or repeated shutdowns. South Africa’s economy recorded a sixth consecutive quarter of positive momentum in the first quarter of 2026, but packaging manufacturers must translate macroeconomic activity into reliable plant utilisation. The market challenge is to maintain product safety, filling efficiency and recyclability while managing utility constraints, equipment requirements and scarce technical skills across multiple materials. Sources: Statistics South Africa, Petco and MetPac-SA.
Market Opportunities
Food-Grade rPET and Regional Bottle-to-Bottle Infrastructure
South Africa has an established PET collection network and a significant opportunity to expand food-grade bottle-to-bottle production near major beverage-filling regions. Petco has stated that collection for recycling grew from approximately 10,000 tonnes annually during the early development of the system to more than 90,000 tonnes annually in its later operating period. Current industry reporting indicates that roughly 64 bottles out of every 100 PET bottles are collected for recycling. South Africa has used food-grade recycled PET in new bottles and containers since 2009, demonstrating technical experience that many emerging markets are still developing. A new Western Cape project was designed to add 15,000 tonnes of annual food-grade rPET output capacity, bringing bottle-to-bottle capability closer to beverage and wine-related manufacturing clusters around Cape Town, Atlantis, Paarl and surrounding industrial areas. The project was associated with an investment of approximately R300 million, indicating the industrial scale required for washing, decontamination, extrusion, pelletising and quality testing. Although investment values are not a market price, the figure demonstrates the current level of physical commitment to recycling infrastructure. The opportunity is broader than adding a recycling line. Beverage companies can redesign bottles to improve material yield through clear resin, reduced pigment use, smaller labels, wash-off adhesives and closures compatible with PET recycling systems. Retailers, schools, offices, stadiums, transport facilities and hospitality operators can provide cleaner collection streams than mixed municipal waste. Distributor backhaul can move empty bottles from retail outlets to aggregation points using vehicles that would otherwise return without cargo. Digital batch records can connect collection points, bale suppliers, recyclers, resin lots, preform manufacturers and beverage fillers, improving food-contact traceability and EPR reporting. Regional bottle-to-bottle plants can reduce the distance travelled by bulky bottle bales and finished resin. Gauteng provides proximity to major soft-drink and water bottlers, while the Western Cape serves water, juice, dairy and wine-related beverage operations. KwaZulu-Natal offers port access and links to coastal filling and distribution. South Africa’s R7.3 trillion nominal economy and population of 63.02 million people provide sufficient beverage consumption to support multiple regional loops. The opportunity also extends to automated optical sorting, bale-quality certification, mobile baling, collector financing, laboratory testing, preform qualification and long-term resin offtake agreements. Food-grade rPET capacity can strengthen domestic circularity only when collection quality, decontamination technology and beverage-brand procurement are developed together. The combination of more than 90,000 tonnes of established annual PET collection, 15,000 tonnes of new regional capacity and decades of food-grade use provides a measurable current foundation for future beverage-packaging expansion. Sources: Petco and Statistics South Africa.
Aluminium Can Circularity, Returnable Glass and Informal-Trade Packaging Systems
South Africa has an opportunity to expand aluminium beverage cans, improve returnable glass systems and develop packaging specifically engineered for informal retail and on-trade distribution. MetPac-SA’s 2024 results show that aluminium used-beverage-can collection reached 77 cans out of every 100, recycling reached 61 cans out of every 100, and recycled content reached 47 parts out of every 100 parts within the measured can-design system. Its 2025 reporting indicates recycled content of 56 parts out of every 100, demonstrating continued progress in secondary-metal use. Tinplate packaging recorded collection of 61 containers out of every 100 and recycling of 63 containers out of every 100 during the 2024 reporting cycle. These results provide a strong current basis for additional can applications in energy drinks, beer, cider, ready-to-drink alcohol, sparkling water, wine and premium soft drinks. Cans offer rapid chilling, complete light protection, strong pallet efficiency and a large printable area. Smaller beverage brands can use sleeved or digitally printed cans to commercialise regional flavours and limited runs without holding large inventories of conventionally decorated containers. Domestic remelting partnerships can further improve can-to-can material loops and reduce reliance on primary aluminium. Returnable glass provides a parallel opportunity. Breweries and soft-drink companies already operate bottle deposits, reusable crates, washing plants and distributor backhaul across controlled routes. Digital crate and bottle tracking can reduce asset loss, while automated inspection can identify cracks, foreign objects and excessive scuffing before refill. Returnable systems are particularly suited to taverns, shebeens, restaurants and retailers supplied through established beverage distributors. South Africa’s informal retail network also requires packaging that differs from formats designed exclusively for supermarkets. Spaza shops may have limited refrigeration, storage and shelf space, making durable single-serve containers, sharing packs, reusable crates and low-volume case configurations commercially relevant. Cash-and-carry wholesalers need cases that withstand multiple handling stages before reaching the consumer. Fibre-based multipacks, reusable crates and lighter corrugated cases can reduce secondary plastic while preserving distribution performance. The national population of 63.02 million people and R7.3 trillion economy support high beverage throughput across both formal and informal channels. Waste-picker integration can connect consumption in these channels with aluminium, PET, cardboard and glass recovery. Buy-back centres can use balers, scales and collection vehicles funded through EPR programmes to serve locations outside metropolitan kerbside systems. The future opportunity lies in combining container design, reverse logistics, collector incentives, remelting or furnace capacity and channel-specific case configurations. Current metal-recovery results and South Africa’s established returnable-bottle networks show that circular beverage packaging can scale when the package is designed around the country’s actual retail, collection and distribution structure. Sources: MetPac-SA and Statistics South Africa.
Future Outlook
The South Africa Beverage Packaging Market is expected to develop through 2035 as beverage producers expand recycled-content use, optimise returnable systems and introduce lighter bottles, cans, cartons and secondary packs. Growth will be influenced by formal retail, informal trade, packaged-water demand, premium alcoholic beverages, food-grade rPET capacity and mandatory producer responsibility. South Africa’s EPR regulations require producers of identified packaging products and producer responsibility organisations to register with the Department of Forestry, Fisheries and the Environment. The framework moves responsibility beyond manufacturing and sales to include collection, recycling, reporting and end-of-life management. Beverage companies must classify PET bottles, caps, labels, aluminium cans, steel containers, glass bottles, liquid-board cartons, corrugated cases and flexible packs correctly. Compliance increasingly influences packaging procurement because material weight, recyclability, recycled content and recovery infrastructure affect producer obligations. The system supports specialised organisations including Petco for PET and liquid-board packaging and MetPac-SA for metal packaging. Petco reported meeting legislated collection and recycling targets for 99% of the identified-product tonnage placed on the market by its members in 2024.
Major Players
- Nampak
- Mpact
- Polyoak Packaging Group
- Ardagh Glass Packaging–Africa
- Isanti Glass
- ALPLA South Africa
- Bowler Metcalf
- Transpaco
- Tetra Pak South Africa
- SIG South Africa
- Amcor South Africa
- Constantia Flexibles South Africa
- Huhtamaki South Africa
- Bericap South Africa
- Guala Closures South Africa
Key Target Audience
- Beverage-container and packaging-material manufacturers
- Packaged-water, soft-drink, dairy, juice and energy-beverage producers
- Breweries, cider producers, wineries and distilleries
- Contract beverage fillers and co-packaging companies
- Retailers, wholesalers, liquor distributors and foodservice operators
- Investments and venture capitalist firms
- Private-equity and strategic packaging investors
- Government and regulatory bodies
Research Methodology
Step 1: Identification of Key Variables
The initial phase maps resin suppliers, container manufacturers, closures, labels, beverage fillers, breweries, wineries, retailers, producer responsibility organisations, waste pickers and recyclers. Core variables include container units, package weight, beverage volume, recycled content, returnability, filling technology, EPR category and provincial capacity.
Step 2: Market Analysis and Construction
Historical data is compiled by material, format, beverage category, pack size, distribution channel and province. Bottom-up analysis assesses packaging plants, filling capacity, container shipments, material tonnage and company revenues. Top-down analysis reviews GDP, manufacturing output, beverage production, trade, retail activity and recycling flows.
Step 3: Hypothesis Validation and Expert Consultation
Market hypotheses are validated through computer-assisted telephone interviews with packaging converters, beverage companies, recyclers, producer responsibility organisations, wholesalers and technical specialists. Consultations examine plant utilisation, package qualification, rPET availability, returnable systems, EPR fees, material recovery and customer procurement behaviour.
Step 4: Research Synthesis and Final Output
Supply-side and demand-side results are triangulated to reconcile container production, beverage filling, imports, exports and recovered-material flows. Segment shares and forecasts are tested against packaging weights, filling capacity, company disclosures, EPR results, collection statistics and primary-industry feedback.

- Executive Summary
- Research Methodology (Market Definitions and Assumptions, Beverage Packaging Inclusion and Exclusion Criteria, Abbreviations, Market Sizing Approach, Top-Down Analysis, Bottom-Up Analysis, Beverage Filling Volume Model, Container Unit Conversion Model, Packaging Material Tonnage Assessment, Domestic Production Analysis, Import and Export Assessment, Demand-Side Interviews, Supply-Side Interviews, Data Triangulation, Provincial Scenario Modelling, Forecasting Framework, Limitations and Future Conclusions)

- Definition and Scope
- Market Evolution and Industry Genesis
- Evolution of Beverage Packaging Materials
- Development of PET Beverage Bottles
- Expansion of Aluminium Beverage Cans

- Growth Drivers (Packaged-Water Demand, Soft-Drink Consumption, Beer and Cider Production, Wine Exports, Dairy Processing, Modern Retail, Informal Retail and Foodservice Expansion)
- Market Challenges (Municipal Collection Gaps, Beverage-Grade rPET Availability, Glass Freight Intensity, Electricity Reliability, Informal Collector Dependence, EPR Compliance and Flexible-Packaging Recovery)
- Market Opportunities (Food-Grade rPET, Aluminium Can Expansion, Returnable Glass Optimisation, Wine Bag-in-Box, Liquid Board Carton Recovery, Fibre-Based Multipacks, Smart Collection and Regional Co-Packing)
- Market Trends (PET Lightweighting, Can Premiumisation, Returnable Bottles, Recycled Content, Digital Printing, Lightweight Glass, Bag-in-Box Wine and Packaging Carbon Disclosure)
- SWOT Analysis
- Porter’s Five Forces Analysis
- PESTLE Analysis

- By Market Value (2020-2025)
- By Beverage Container Units (2020-2025)
- By Packaged Beverage Volume (2020-2025)

- By Packaging Material (In Value %)
PET
HDPE
Polypropylene
Polyethylene Films
Aluminium
Steel and Tinplate
Glass
Paperboard - By Beverage Category (In Value %)
Carbonated Soft Drinks
Packaged Drinking Water
Natural Mineral Water
Flavoured and Enhanced Water
Energy Drinks
Sports and Isotonic Drinks - By Distribution Channel (In Value %)
Supermarkets and Hypermarkets
Convenience Stores
Petrol-Station Stores
Independent Grocery Stores
Spaza Shops
Cash-and-Carry Wholesalers - By Province (In Value %)
Gauteng
Western Cape
KwaZulu-Natal
Eastern Cape
Free State
Limpopo

- Market Share of Major Players
- Cross Comparison Parameters (Beverage Container Material and Format Breadth, Annual Beverage Container and Closure Manufacturing Capacity, South African Plant Footprint and Proximity to Filling Clusters, Food-Grade rPET Cullet and Closed-Loop Material Capability, Filling-Line Compatibility and High-Speed Technical Support, Beverage Category and Pack-Size Coverage, Food-Contact EPR and PRO Compliance Support, Lightweighting and New-Format Commercialisation Capability)
- SWOT Analysis of Major Players
- Detailed Profiles of Major Companies
Nampak
Mpact
Polyoak Packaging Group
Ardagh Glass Packaging–Africa
Isanti Glass
ALPLA South Africa
Bowler Metcalf
Transpaco
Tetra Pak South Africa
SIG South Africa
Amcor South Africa
Constantia Flexibles South Africa
Huhtamaki South Africa
Bericap South Africa
Guala Closures South Africa

- Carbonated Soft Drink Producer Analysis
- Packaged-Water Producer Analysis
- Energy and Sports Drink Producer Analysis
- Juice and Fruit-Beverage Producer Analysis
- Dairy Beverage Producer Analysis
- Brewer Analysis

- By Market Value (2026-2035)
- By Beverage Container Units (2026-2035)
- By Packaged Beverage Volume (2026-2035)


 Request a Sample
 Ask for Customization
 Get a Quote
 Enquire Now