
 Download PDF
Market Overview
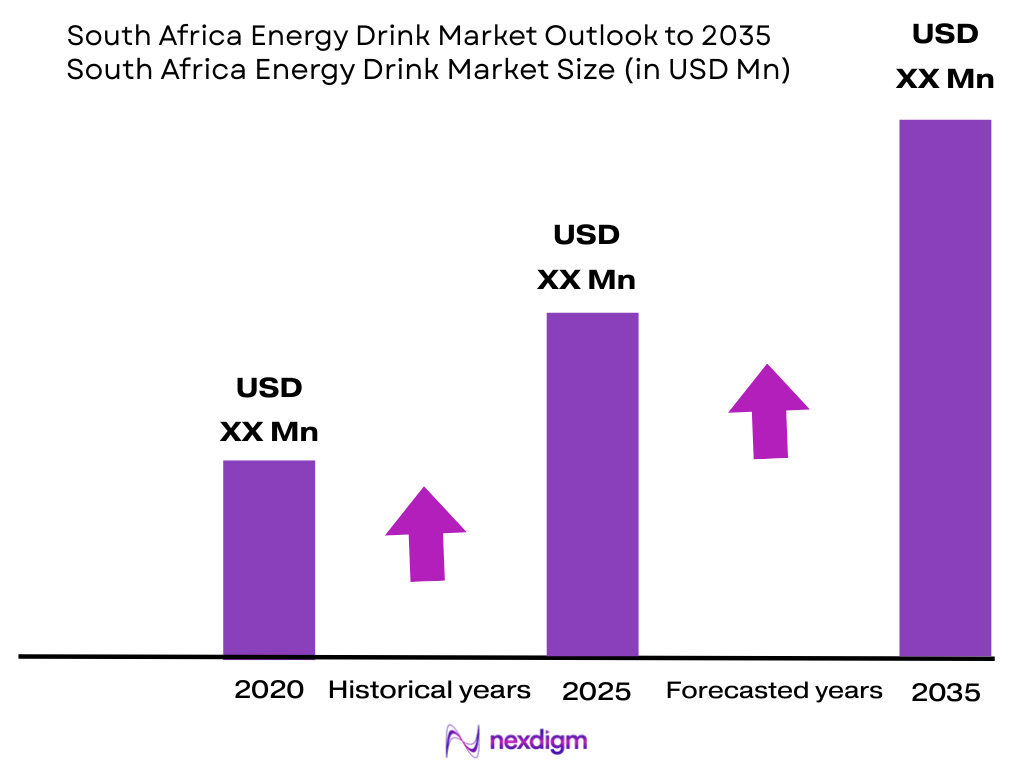
The South Africa Energy Drink Market is valued at USD ~ million, calculated from the published country benchmark of USD ~ million for the next base year and the reported growth trajectory. The forecasted CAGR for the 2026–2035 outlook is considered at 5.38%, aligned with the available South Africa energy drink forecast benchmark. Demand is driven by township retail, spaza shops, forecourts, supermarkets, students, long-shift workers, gym users and affordability-led local brands. The South Africa Energy Drink Market is concentrated in Gauteng, Western Cape and KwaZulu-Natal, led by Johannesburg, Pretoria, Cape Town and Durban due to commuter density, universities, township retail, forecourts, nightlife and organised grocery. South Africa’s population reached 63.02 million, rising by 835,513 people from the preceding base, while Gauteng had the largest provincial population share, followed by KwaZulu-Natal and Western Cape.
Market Segmentation
By Product Type
South Africa Energy Drink Market is segmented by product type into traditional energy drinks, sugar-free energy drinks, sports energy drinks, glucose or functional energy drinks, and energy shots or powdered energy mixes. Recently, traditional energy drinks have a dominant market share in South Africa under product type segmentation because they are available across the widest retail network, including supermarkets, spaza shops, cash-and-carry stores, petrol forecourts and convenience stores. Red Bull and Monster drive premium demand, while Switch, Score, Dragon, Reboost and MoFaya strengthen affordability-led mass adoption. The category is also strongly linked to work fatigue, student consumption, taxi-rank purchases, mining and logistics shifts, nightlife and gaming occasions. Sugar-free and sports-positioned formats are growing, but traditional caffeine-taurine products remain dominant due to flavour familiarity, chilled retail visibility and broad pack-size availability. Local brands such as Switch, Score, Reboost and Dragon are specifically noted as competing through affordability, availability and flavour innovation.

By Packaging Type
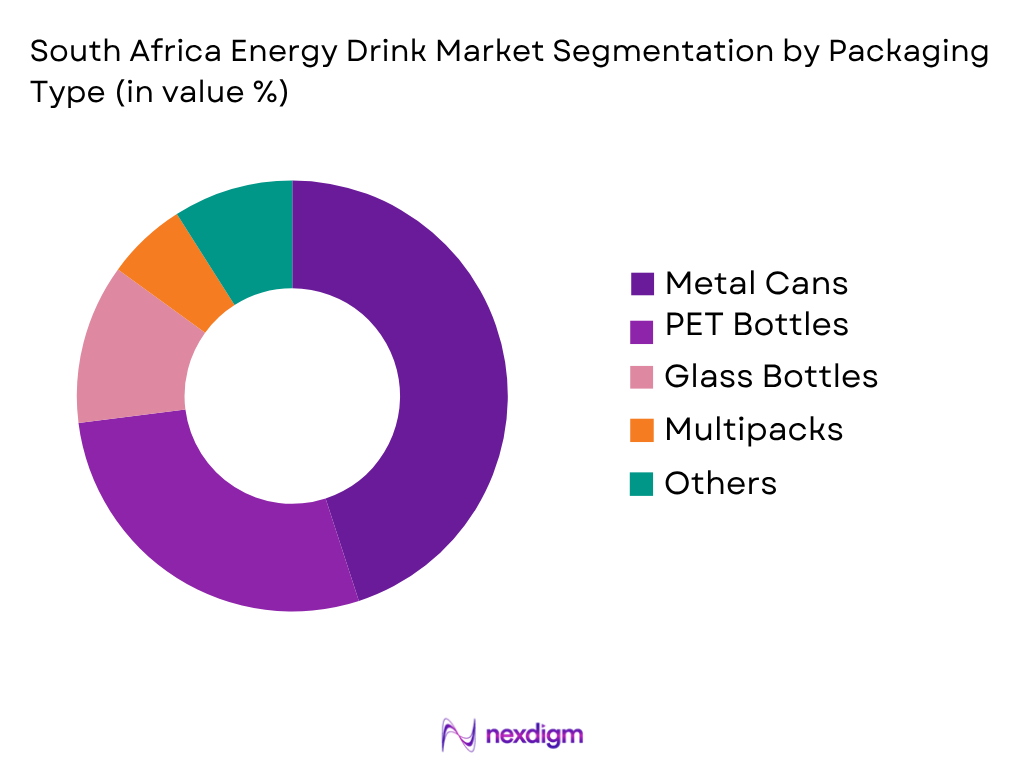
South Africa Energy Drink Market is segmented by packaging type into metal cans, PET bottles, glass bottles, multipacks, and shots, powder tubs and other formats. Recently, metal cans have a dominant market share under packaging type segmentation because the format is strongly associated with mainstream and premium energy drinks, rapid chilling, carbonated product stability, shelf visibility and single-serve impulse purchase. Red Bull, Monster, Switch, Score and Dragon rely heavily on cans across supermarkets, forecourts, convenience outlets and spaza supply chains. Metal cans also fit taxi-rank, commuter, student and worker consumption where drinks are purchased cold and consumed immediately. PET bottles remain relevant for value-led and resealable consumption, especially in township and general trade channels, while multipacks support supermarket and cash-and-carry baskets. Across Africa, metal cans commanded 57.04% of energy drink packaging, supporting the format’s regional leadership.
Competitive Landscape
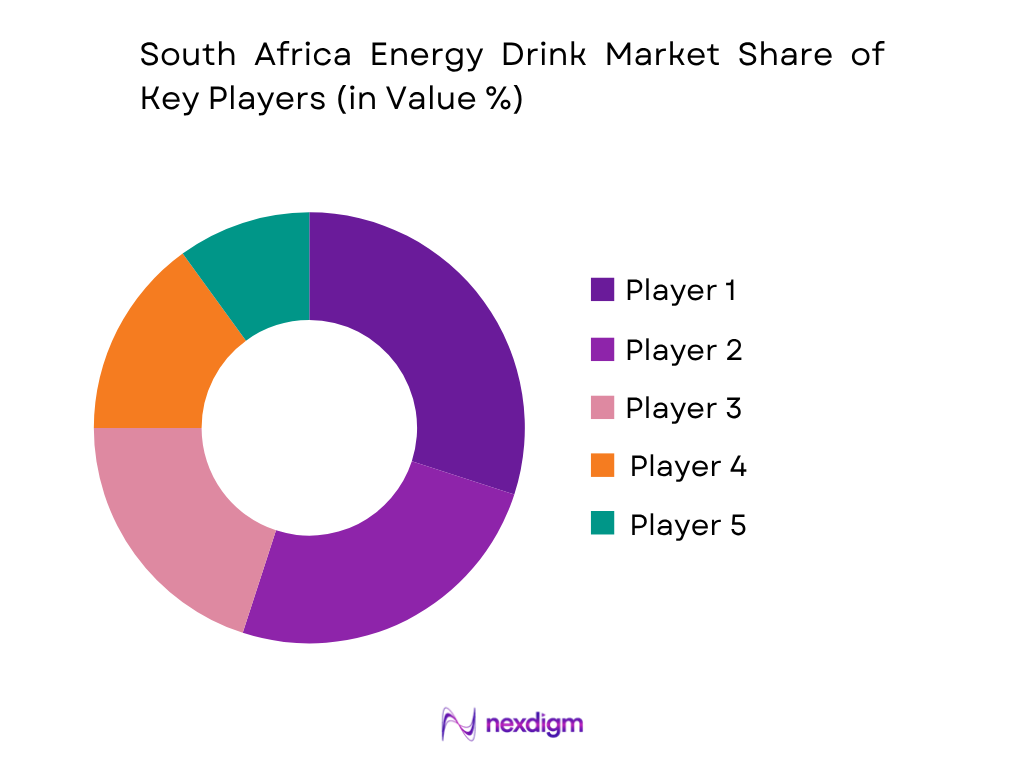
The South Africa Energy Drink Market is shaped by global premium brands and strong domestic challengers. Red Bull and Monster maintain premium recognition through sports, nightlife, forecourts and modern retail, while Switch, Score, Dragon, Reboost and MoFaya compete through affordability, township penetration, flavour variety and local brand identity. The market is highly competitive because cold-shelf space is limited and brands must defend visibility across supermarkets, cash-and-carry, petrol stations, spaza shops, gyms and e-commerce.
| Company | Establishment Year | Headquarters | Core Energy Portfolio | South Africa Positioning | Packaging Focus | Channel Strength | Product Innovation Focus | Market-Specific Edge |
| Red Bull GmbH | 1984 | Fuschl am See, Austria | ~ | ~ | ~ | ~ | ~ | ~ |
| Monster Beverage Corporation | 1935 | Corona, California, USA | ~ | ~ | ~ | ~ | ~ | ~ |
| Switch Beverage Company | 2013 | South Africa | ~ | ~ | ~ | ~ | ~ | ~ |
| Tiger Brands | 1921 | Bryanston, South Africa | ~ | ~ | ~ | ~ | ~ | ~ |
| MoFaya Beverage Company | 2014 | Johannesburg, South Africa | ~ | ~ | ~ | ~ | ~ | ~ |
South Africa Energy Drink Market Analysis
Growth Drivers
Commuter, Taxi-Rank and Forecourt Energy Drink Demand
South Africa Energy Drink Market is supported by large commuter flows that create repeat chilled-beverage occasions around taxi ranks, petrol stations, spaza shops, convenience stores and roadside retail. Statistics South Africa’s General Household Survey reported 4.539 million people using minibus taxi, sedan taxi or bakkie taxi transport to work, directly supporting impulse purchases near commuter routes and rank-side outlets. The World Bank reported South Africa’s GDP at USD 401.14 billion and GDP per capita at USD 6,267.2, supporting formal beverage distribution across supermarkets, forecourts and cash-and-carry networks. Energy drinks are relevant because they fit commuting, long-distance driving, delivery work, night shifts and immediate fatigue-management occasions.
Workforce Scale and Long-Shift Consumption Occasions
South Africa Energy Drink Market benefits from employment-linked demand across mining, logistics, security, retail, hospitality, construction, agriculture and call-centre work, where long shifts and fatigue-management needs support stimulant beverage usage. Statistics South Africa reported employment increased by 132,000 persons in the fourth quarter, reaching 17.1 million employed persons, while the number of unemployed people stood at 7.991 million, highlighting a large but price-sensitive working and job-seeking consumer base. The World Bank reported GDP per capita at USD 6,267.2, reinforcing the need for affordable pack architecture rather than only premium imported cans. Energy drinks address work fatigue, study, commuting and overnight productivity.
Market Challenges
Sugar-Levy Reformulation Pressure
South Africa Energy Drink Market faces product-formulation pressure because sugar-sweetened beverages are exposed to the Health Promotion Levy. The levy applies to sugar content exceeding 4 grams per 100 ml, with the original levy set at 2.1 South African cents for each gram above that threshold. This matters for energy drinks because many traditional variants use high-sugar formulations alongside caffeine, taurine and flavour systems. South Africa’s GDP growth was only 0.5 in the World Bank’s latest country profile, increasing pressure on manufacturers to protect affordability while reformulating products. Brands must balance taste, caffeine performance, lower-sugar claims, retailer acceptance and consumer repeat purchase.
Affordability Pressure and Informal-Retail Execution
South Africa Energy Drink Market faces affordability and execution pressure because large parts of demand are routed through spaza shops, cash-and-carry wholesalers, taxi-rank outlets and forecourts where consumers are highly value-sensitive. Statistics South Africa reported 7.991 million unemployed persons in the fourth quarter, while the expanded unemployment rate remained elevated, creating a difficult environment for premium-only energy drink portfolios. The World Bank reported GDP per capita at USD 6,267.2, far below high-income energy-drink markets, making pack size and value positioning critical. Brands also need reliable chiller placement, wholesaler replenishment, spaza availability and stock rotation across fragmented township retail routes.
Market Opportunities
Township, Spaza and Cash-and-Carry Channel Expansion
South Africa Energy Drink Market has future growth opportunity in township retail, spaza shops and cash-and-carry supply chains because these outlets align with commuter, student, worker and taxi-rank beverage occasions. South Africa’s population reached 63.02 million, adding 835,513 people from the prior base, increasing the consumer pool for affordable FMCG products. The World Bank reported GDP at USD 401.14 billion, supporting national packaged-beverage manufacturing, distribution and wholesale networks. Energy drink companies can use current demand clusters around minibus taxi use, township shopping, school-to-work transitions and informal retail to expand large cans, value cans, PET formats and local-flavour variants.
Tourism, Nightlife and Event-Led Energy Drink Demand
South Africa Energy Drink Market has future growth opportunity through tourism, nightlife, festivals, hotels, forecourts and coastal retail because energy drinks fit mixer occasions, late-night consumption, travel fatigue and event-based sampling. The Department of Tourism reported total arrivals of 8.92 million in South Africa during 2024, supporting beverage demand in Cape Town, Johannesburg, Durban, Kruger-linked corridors and coastal destinations. Statistics South Africa later reported 10.5 million tourists in 2025, showing a larger travel base for hospitality and retail consumption. With GDP at USD 401.14 billion, brands can target hotels, convenience stores, forecourts, music events, sports venues and nightlife outlets.
Future Outlook
The South Africa Energy Drink Market is expected to grow steadily through the forecast period, supported by affordability-led consumption, township retail penetration, forecourt demand, gaming, sports nutrition, student usage, long-shift work and local brand innovation. The market’s future will be shaped by wider availability of value cans, large cans, PET formats, multipacks and sugar-free variants.
The forecasted CAGR for the 2026–2035 period is benchmarked at 5.38%, based on the available South Africa energy drinks outlook. Growth will not rely only on premium imports; domestic brands are expected to remain central because they are better positioned for price-sensitive consumers and informal retail distribution.
Zero-sugar and low-sugar energy drinks will gain importance as the Health Promotion Levy keeps pressure on sugar-heavy beverages. Sports energy, amino-energy, glucose-energy and focus-positioned products can also grow through gyms, pharmacies, student hubs and online platforms. Forecourts and township retail will remain strategic because energy drinks are frequently purchased for commuting, taxi travel, security work, mining shifts, logistics and late-night activity.
Major Players
- Red Bull South Africa
- Monster Energy South Africa
- The Coca-Cola Company South Africa
- PepsiCo South Africa
- Switch Beverage Company
- Tiger Brands
- Dragon Energy Drink
- MoFaya Beverage Company
- Reboost Energy
- Play Energy Drink
- Power Play Energy Drink
- BOS Brands
- USN South Africa
- Biogen South Africa
- HELL Energy South Africa
Key Target Audience
- Energy drink manufacturers and brand owners
- Functional beverage companies
- Carbonated soft drink and packaged beverage companies
- Supermarket, hypermarket and cash-and-carry retail chains
- Spaza, wholesale, forecourt and township retail operators
- Sports nutrition, gym and pharmacy channel operators
- Investments and venture capitalist firms
- Government and regulatory bodies (South African Revenue Service, Department of Health, National Consumer Commission, National Regulator for Compulsory Specifications, South African Bureau of Standards, Competition Commission South Africa)
Research Methodology
Step 1: Identification of Key Variables
The initial phase involves constructing an ecosystem map for the South Africa Energy Drink Market, covering brand owners, bottlers, importers, co-packers, ingredient suppliers, packaging companies, wholesalers, supermarkets, spaza shops, forecourts, gyms, pharmacies and regulators. The objective is to identify key variables such as product type, pack size, sugar profile, caffeine positioning, channel reach and regional demand.
Step 2: Market Analysis and Construction
In this phase, historical data for the South Africa Energy Drink Market is compiled through company portfolios, public market sources, retail listings, SKU-level benchmarking, channel checks and packaging format analysis. The assessment reviews traditional energy drinks, sugar-free variants, metal cans, PET bottles, multipacks, forecourts, supermarkets, spaza shops and online availability.
Step 3: Hypothesis Validation and Expert Consultation
Market hypotheses are validated through computer-assisted telephone interviews with beverage distributors, supermarket buyers, forecourt managers, cash-and-carry operators, spaza suppliers, gym retailers, e-commerce sellers and co-packers. These consultations provide operational insights into SKU movement, chiller availability, consumer switching, value-pack performance and informal retail execution.
Step 4: Research Synthesis and Final Output
The final phase triangulates top-down market benchmarks with bottom-up brand, SKU, pack and channel evidence. Direct engagement with beverage manufacturers, distributors and retail stakeholders helps verify product segmentation, competitive positioning, regional demand, pricing architecture, Health Promotion Levy exposure and future opportunity areas in the South Africa Energy Drink Market.
- Executive Summary
- Research Methodology [market definitions and assumptions, RTD energy drink classification, stimulant beverage scope, carbonated functional beverage inclusion, Health Promotion Levy adjustment, top-down sizing, bottom-up sizing, retail audit checks, distributor interviews, SKU-level price-pack benchmarking]
- Definition and Scope
- Overview Genesis
- Timeline of Major Players
- Business Cycle
- Supply Chain and Value Chain Analysis

- Growth Drivers (young consumers, township retail, affordability, forecourts, long shifts, gaming, sport, local brand innovation)
- Market Challenges (Health Promotion Levy, sugar scrutiny, unemployment pressure, informal retail opacity, load-shedding legacy, shelf competition)
- Market Opportunities (zero sugar, low sugar, township distribution, PET formats, sports energy, gaming energy, e-commerce, local flavours)
- Market Trends(value energy, sugar reduction, local challengers, flavour diversification, gaming activation, township merchandising, forecourt bundles)
- SWOT Analysis
- Porter’s Five Forces [supplier power, buyer power, substitute threat, new entrant threat, competitive rivalry]
- By Value (2020-2025)
- By Volume (2020-2025)
- By Unit Sales (2020-2025)
- By Product Type (In Value %)
Traditional Energy Drinks
Sugar-Free Energy Drinks
Sports Energy Drinks
Glucose Energy Drinks
Energy Shots
- By Packaging Type (In Value %)
Aluminum Cans
PET Bottles
Glass Bottles
Multipacks
Large Cans
- By Distribution Channel (In Value %)
Supermarkets and Hypermarkets
Cash-and-Carry and Wholesale
Spaza Shops and Informal Retail
Convenience Stores
Petrol Stations and Forecourts
Pharmacies and Health Retail
- By Region (In Value %)
Gauteng
Western Cape
KwaZulu-Natal
Eastern Cape
- Market Share of Major Players on the Basis of Value and Volume
- Cross Comparison Parameters (caffeine mg per litre, sugar grams per 100 ml, zero-sugar SKU mix, Health Promotion Levy exposure, spaza and cash-and-carry distribution depth, forecourt chiller presence, local flavour portfolio, music-sport-gaming activation intensity)
- SWOT Analysis of Major Players
- Detailed Profiles of Major Companies
Red Bull South Africa
Monster Energy South Africa
The Coca-Cola Company South Africa
PepsiCo South Africa
Switch Beverage Company
Tiger Brands
Dragon Energy Drink
MoFaya Beverage Company
Reboost Energy
Play Energy Drin
Power Play Energy Drink
BOS Brands
USN South Africa
Biogen South Africa
HELL Energy South Africa
- Market Demand and Utilization
- Purchasing Power and Budget Allocation
- Regulatory and Compliance Requirements
- Needs, Desires and Pain Point Analysis
- By Value (2026-2035)
- By Volume (2026-2035)
- By Unit Sales (2026-2035)


 Request a Sample
 Ask for Customization
 Get a Quote
 Enquire Now