
 Download PDF
 Download PDF
Market Overview
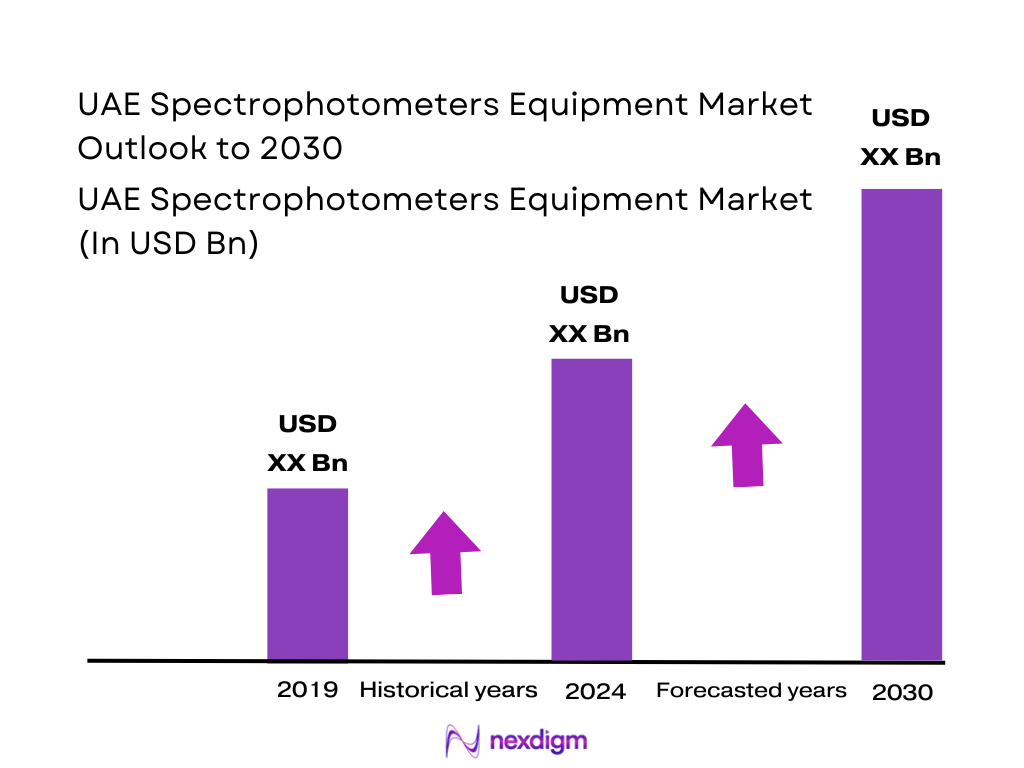
The UAE spectrophotometers equipment market sits within a broader global spectrophotometer industry valued at about USD ~ billion, based on a recent global spectrophotometer study that tracks growth from earlier years to 2032. Across the Middle East, spectrometers and spectrophotometers together account for roughly USD 236 million in revenue at current wholesale prices, with the last two reported data points stabilising around this level after an earlier peak near USD ~ million. This stabilisation reflects maturing demand in pharma, diagnostics, environmental testing and industrial labs, while unit imports into the UAE continue to grow.
Within the regional landscape, the UAE, Turkey and Saudi Arabia are the dominant markets by consumption volume, jointly accounting for more than four-fifths of spectrometer and spectrophotometer units used in the Middle East. The UAE stands out as the single largest consumer in unit terms and has the highest per-capita use, at about 979 instruments per million people versus a global average of roughly 76.l This dominance is underpinned by its role as a regional trade hub, dense clusters of hospital and reference laboratories, strong pharma and biotech R&D ambitions, and public investment in environmental, food safety and materials testing infrastructure.
Market Segmentation
By Instrument Type
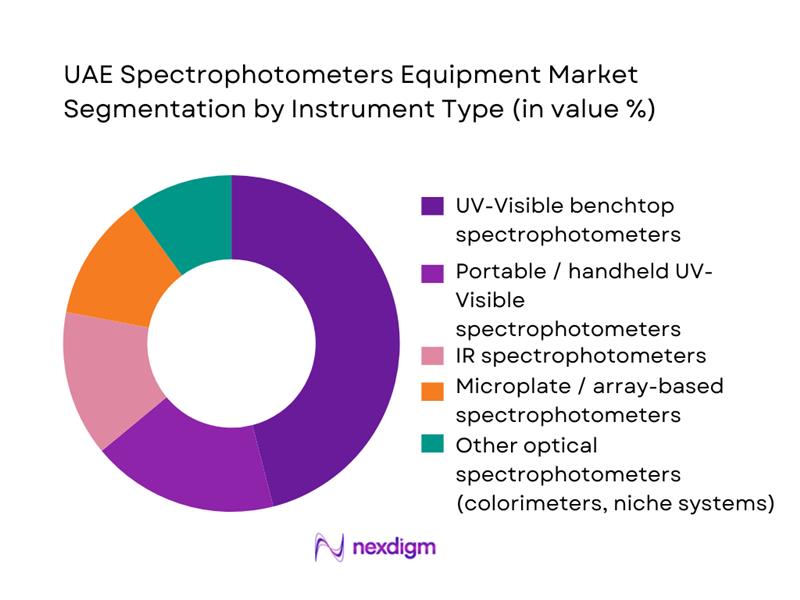
The UAE spectrophotometers equipment market is segmented into UV-Visible benchtop systems, portable UV-Visible devices, IR spectrophotometers, microplate/array-based instruments and other optical spectrophotometers. Recently, UV-Visible benchtop spectrophotometers have a dominant market share in this segmentation due to their central role in routine quantitative analysis for pharmaceuticals, clinical chemistry, food quality and academic research. Global demand patterns show UV-Visible instruments are the most widely deployed spectrophotometer type and account for the bulk of installed units worldwide, which maps closely to UAE practice: QC and R&D labs standardise on benchtop UV-Vis platforms for assay validation, stability studies and method transfer, making them the default procurement choice when labs expand or upgrade.
By End User
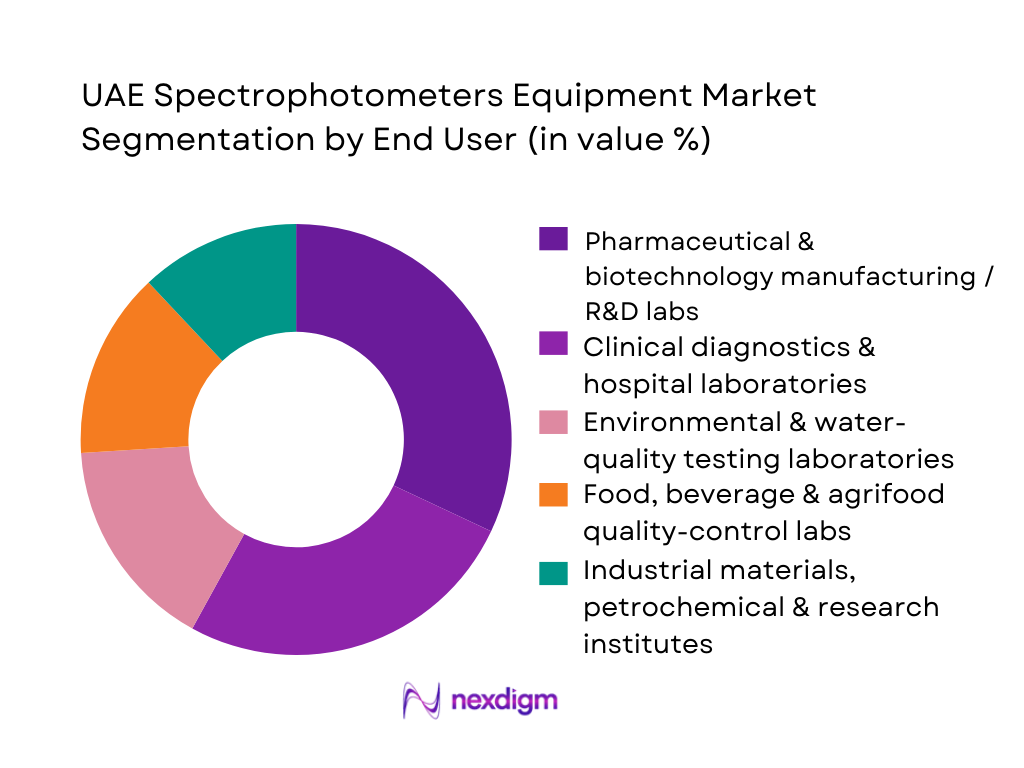
The UAE spectrophotometers equipment market is segmented into pharmaceutical and biotechnology labs, clinical diagnostics and hospital laboratories, environmental and water-quality testing labs, food and beverage quality-control facilities, and industrial materials and research institutes. Pharmaceutical and biotech labs currently dominate value share, reflecting the heavy use of UV-Visible and microplate spectrophotometers in API assay, dissolution, impurity profiling and biologics characterisation. Global data indicates that pharmaceutical applications account for a major share of new spectrophotometer installations, and the UAE’s strategic push to attract life-science manufacturing and clinical research results in higher instrument specifications, larger multi-unit projects and more frequent replacement cycles. This raises the ticket size per installation, keeping pharma-biotech at the top of the end-user hierarchy despite rapid growth in diagnostic and environmental testing capacity.
Competitive Landscape
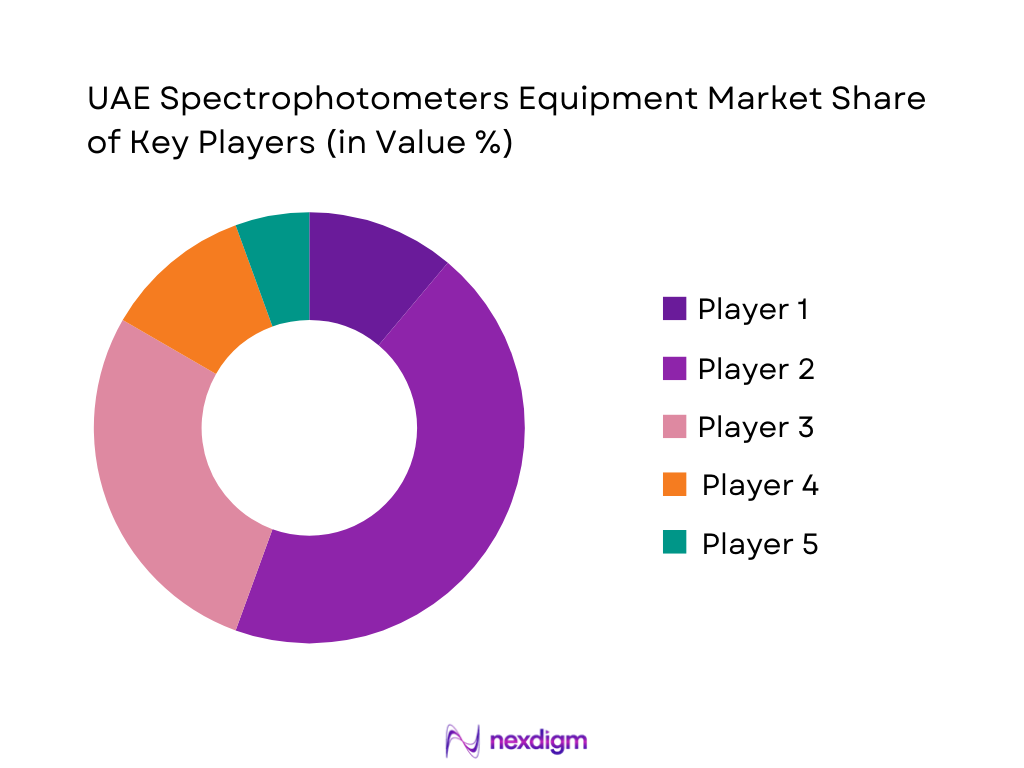
The UAE spectrophotometers equipment market is shaped by a concentrated set of global analytical-instrument manufacturers working through specialised local distributors and service partners. Companies such as Thermo Fisher Scientific, Agilent Technologies, Shimadzu, PerkinElmer and Bruker anchor the broader spectrometry market in the UAE, supplying UV-Visible, IR and hybrid platforms through hospital, pharma, environmental and academic channels. Competition is less about basic availability and more about application support, qualification and validation services, connectivity to LIMS and regulatory-grade documentation, which collectively drive switching costs and long-term account stickiness.
| Company | Establishment Year | Headquarters | Core Spectrophotometer Focus in UAE | Key Product Lines (Spectrophotometers) | Primary UAE End-User Focus | Local Channel / Presence Model | Service & Calibration Footprint in UAE | Differentiating Edge in UAE Spectrophotometer Space |
| Thermo Fisher Scientific | 2006 (current form) | Waltham, USA | ~ | ~ | ~ | ~ | ~ | ~ |
| Agilent Technologies | 1999 | Santa Clara, USA | ~ | ~ | ~ | ~ | ~ | ~ |
| Shimadzu Corporation | 1875 | Kyoto, Japan | ~ | ~ | ~ | ~ | ~ | ~ |
| PerkinElmer (Revvity) | 1937 | Waltham, USA | ~ | ~ | ~ | ~ | ~ | ~ |
| Bruker Corporation | 1960 | Billerica, USA | ~ | ~ | ~ | ~ | ~ | ~ |
UAE Spectrophotometers Market Dynamics & Analysis
Growth Drivers
Increasing demand for analytical accuracy
The UAE’s healthcare and life-science ecosystem is a major engine for high-precision analytical equipment. The Ministry of Health & Prevention reports 172 operating hospitals and 5,770 healthcare facilities, including 5,021 private facilities, serving 23,298,220 hospital visits and 825,864 inpatient admissions in a single year, supported by 145,981 health workers and 30,347 technicians in 2022. Such scale drives heavy reliance on precise biochemical and hematology testing, where UV-Vis and microplate spectrophotometers are core. At the macro level, the UAE’s GDP reached USD 514,130,000,000 and current health expenditure stood at 4.68 of GDP, anchoring sustained investment in quality-assured diagnostics and research workflows that demand higher analytical accuracy.
Growing environmental monitoring and regulatory focus
Spectrophotometers are increasingly embedded in UAE air, water and wastewater monitoring systems as the country tightens environmental governance. UAE official climate documentation notes plans to invest USD ~ in clean energy over three decades under the Net Zero by 2050 initiative, reflecting a structural pivot toward low-carbon infrastructure and stringent emissions oversight. Environment Agency – Abu Dhabi has built dense air-quality networks; national wastewater statistics show treated effluent production on the order of hundreds of millions of cubic metres annually, with UAE-level volumes recorded at 711,008.9 and 733,067.2 (thousand m³) in recent years, each batch requiring continuous spectrophotometric COD, BOD and nutrient testing before reuse or discharge. This combination of climate-investment scale, water scarcity and industrial diversification sharply lifts demand for robust environmental spectrophotometry.
Challenges
High cost of advanced spectrophotometers
Capital-intensive instruments such as double-beam UV-Vis, ICP-OES and high-end multi-mode plate readers remain difficult purchases for smaller private labs, food producers and municipal utilities. The UAE’s GDP of USD ~ and high income status support healthcare and R&D spend, yet current health expenditure stands at 4.68 of GDP, and general government expenditure already accounts for 29.04 of GDP, constraining room for rapid capex expansion in all sectors simultaneously. Healthcare alone handles 23,298,220 hospital visits and 3,393,896 emergency visits per year, putting pressure on budgets for beds, staff and IT. In this environment, the total installed base of spectrophotometers grows, but many buyers defer upgrades to top-end platforms, prefer refurbished units, or rationalize instruments across multi-hospital networks, slowing uptake of the most advanced—and expensive—systems.
Technical complexity, maintenance and skills constraints
Spectrophotometers in UAE labs are embedded in increasingly complex workflows—automated sample prep, LIMS connectivity and multi-matrix methods—which raises calibration and maintenance demands. MOHAP data for 2022 show a total health workforce of 145,981, including 29,860 doctors, 63,366 nurses and 30,347 technicians, while licensed healthcare facilities number 5,770. These figures underscore strong human-capital depth but also highlight how clinical and technical staff are spread thin across hospitals, polyclinics, imaging centres and specialized labs. At the same time, hospital beds total 19,102, with 2,763,883 inpatient days of stay, driving demand for reliable instruments with minimal downtime. Maintaining traceable calibrations for hundreds of units across multiple emirates—and ensuring technicians remain trained on advanced diagnostics software, validation protocols and regulatory documentation—adds complexity and internal cost for hospitals, CROs and industrial labs.
Opportunities
Growing emphasis on environmental compliance, sustainability and pollution control
The UAE’s strategic climate posture opens multi-year opportunities for spectrophotometer manufacturers, especially in water and air-quality monitoring. Official climate-action communication highlights a plan to invest USD ~ in clean energy and climate-aligned projects over 30 years, under the Net Zero by 2050 initiative. In parallel, the COP28-launched Altérra climate fund carries an initial USD ~ commitment and aims to mobilize USD ~ in climate investments by 2030, positioning Abu Dhabi as a green-finance hub. Wastewater datasets from the Federal Competitiveness and Statistics Centre show UAE-level treated volumes above 700,000 thousand cubic metres per year, while Environment Agency – Abu Dhabi’s air-quality programmes monitor 275 parameters and generate over 130,086,000 minute-data records annually. Each of these climate and environment pillars converts directly into long-term demand for UV-Vis and specialized spectrophotometers in desalination plants, wastewater labs, stack-emissions testing and environmental reference laboratories.
Rising pharmaceutical manufacturing and clinical-research investments
Pharma manufacturing, biologics, clinical research and reference-lab growth in the UAE all favour more extensive spectrophotometer fleets. MOHAP’s 2022 report shows 825,864 hospital admissions, 2,763,883 inpatient days and 3,393,896 emergency-department visits, underscoring high diagnostic throughput where spectrophotometric assays for therapeutic drug monitoring, liver and kidney panels, and microbiology remain staples. Industrial policy also supports life-science manufacturing: the national industrial strategy targets a significant rise in manufacturing value added, with food, chemicals and pharmaceuticals among priority sectors; manufacturing value added in “manufacture of food products” alone is recorded above AED ~ in recent statistical releases. Alongside this, the UAE hosts expanding clinical-research activity, as evidenced by increasing biomedical publication counts and research-productivity analyses for GCC countries, which identify the UAE as one of the fastest-improving research performers. All these factors point toward sustained uptake of both benchtop and microplate spectrophotometers in QC labs, formulation development, bioequivalence studies and hospital research centres.
Future Outlook
Over the next six years, the UAE spectrophotometers equipment market is expected to expand steadily, supported by rising healthcare expenditure, localisation of pharmaceutical manufacturing, and ongoing investments in environmental and food-safety monitoring. Global forecasts point to the spectrophotometer market growing from USD ~ billion in 2024 to about USD ~ billion by 2032, a CAGR of roughly 10.6 percent, while the broader Middle East spectrometers and spectrophotometers market is projected to lift from USD 236 million to around USD ~ million by 2035 at 2.7 percent annually. Within this band, UAE demand should track towards the higher end, reflecting its status as the largest importer by volume, the region’s highest per-capita use and a sustained pipeline of new lab projects in Dubai, Abu Dhabi and key free-zones.
Major Players
- Thermo Fisher Scientific
- Agilent Technologies
- Shimadzu Corporation
- PerkinElmer
- Bruker Corporation
- JASCO Corporation
- Analytik Jena
- Hach Company
- Biochrom
- Hitachi High-Tech Corporation
- Metrohm AG
- PG Instruments Ltd
- BioTek Instruments
- INESA Scientific Instrument Co.
Key Target Audience
- Pharmaceutical and biotechnology manufacturers
- Hospital and clinical diagnostic laboratory chains
- Independent environmental and water-quality testing laboratories
- Food, beverage and agrifood processing companies
- Industrial materials, petrochemical and specialty-chemicals producers
- Scientific and analytical-equipment distributors and value-added resellers
- Investments and venture capitalist firms
- Government and regulatory bodies
Research Methodology
Step 1: Identification of Key Variables
The initial phase involves constructing an ecosystem map encompassing all major stakeholders within the UAE spectrophotometers equipment market. This map includes instrument OEMs, regional distributors, calibration labs, hospital and independent laboratories, industrial QC facilities and regulators. Extensive desk research, using secondary sources is employed to identify variables such as installed-base growth, import volumes, price bands, end-user mix and replacement cycles.
Step 2: Market Analysis and Construction
In this phase, historical data on global spectrophotometer revenues, Middle East spectrometer/spectrophotometer value and regional consumption by country are compiled and normalised. We analyse penetration levels across pharma, diagnostics, environmental, food and industrial segments, cross-checking with UAE import volumes, per-capita instrument use and healthcare and R&D spending. Where country-level revenue splits are not disclosed, we construct indicative ranges by triangulating unit imports, typical instrument price points and end-user mix, and then reconcile these with global and regional benchmarks to avoid over- or under-estimation.
Step 3: Hypothesis Validation and Expert Consultation
Market hypotheses on growth drivers, dominant instrument types and end-user behaviour are validated through computer-assisted telephone interviews and virtual consultations with UAE-based lab managers, QA heads, biomedical engineers and distributors. These discussions provide granular insight into specification trends, service expectations, budget cycles and procurement trade-offs (e.g., new vs refurbished, premium vs value brands). Feedback from global OEM sales and service teams covering the Gulf is also incorporated, ensuring that high-level data is aligned with on-the-ground realities in both public and private-sector labs.
Step 4: Research Synthesis and Final Output
The final phase synthesises quantitative and qualitative findings into a coherent market narrative and forecast. We iterate between bottom-up (unit imports, installed-base growth, replacement cycles) and top-down (global and regional market trajectories) views to cross-validate market-size ranges and growth assumptions. Outputs include segmentation by instrument type and end user, an assessment of competitive positioning, and scenario-based outlooks for 2024–2030. Particular emphasis is placed on identifying actionable opportunities for vendors and investors, such as underserved segments (field-deployable units, rental models), value-added service gaps and regulatory inflection points that could accelerate instrument demand in the UAE.
- Executive Summary
- Research Methodology (Market Definitions and Scope, Assumptions and Definitions, Market Sizing Approach, Data Sources & Research Framework, Consolidated Research Approach & Validation, Limitations and Future Considerations)
- Definition and Scope
- Market Genesis & Evolution in UAE
- Timeline of Major Developments & Milestones
- Value Chain & Supply Chain Analysis
- Regulatory, Standards & Compliance Landscape in UAE

- Growth Drivers
Increasing demand for analytical accuracy
Growing environmental monitoring and regulatory focus
Expansion of food & beverage sector and stricter food safety standards
Increasing number of academic, research institutions, and expansion of higher-education and research infrastructure in UAE
Adoption of portable spectrophotometers - Challenges
High cost of advanced spectrophotometers
Technical complexity, maintenance requirements, calibration needs, and availability of qualified personnel
Dependence on imports
Competition from alternative analytical technologies
Regulatory, compliance and calibration standardization requirements for labs - Opportunities
Growing emphasis on environmental compliance, sustainability, pollution control
Rising pharmaceutical manufacturing & clinical-research investments
Potential for local distribution networks
Adoption of portable and rugged spectrophotometers
Integration of digital interfaces, remote diagnostics, IoT / networked lab equipment - Trends
Shift towards portability and field-deployable spectrophotometers
Instrument miniaturization, ease of use, automation, digital connectivity
Rising preference for double-beam UV-Vis spectrophotometers
Growth in demand for multi-functional instruments
Growing role of calibration, after-sales services, maintenance contracts, instrument lifecycle management in purchase decisions - Competitive Forces & Ecosystem Analysis
- SWOT Analysis
- Stakeholder Ecosystem
- By Value, 2019-2024
- By Volume, 2019-2024
- By Average Selling Price, 2019-2024
- By Instrument Type (in Value %)
UV–Visible (UV-Vis) Spectrophotometers
Infrared (IR) Spectrophotometers
Portable Spectrophotometers
Benchtop Spectrophotometers
Double-beam vs Single-beam spectrophotometers - By End-User / Industry Application (in Value %)
Pharmaceuticals & Biotechnology Laboratories
Environmental Testing & Monitoring
Food & Beverage Quality Analysis Labs
Industrial Chemistry Laboratories
Academic & Research Institutions - By Mode (in Value %)
New instruments
Refurbished
Spare parts & calibration services - By Distribution Channel (in Value %)
Direct import by labs
Through local distributors or representatives
Through online medical-scientific equipment suppliers
Through reseller networks - By Geography (in Value %)
Dubai & Northern Emirates
Abu Dhabi
Sharjah & Other Emirates
Free Zones vs On-shore distribution routes
- Market Share Analysis
- Cross-Comparison (Company Overview & Headquarters, Product Portfolio, Distribution Network in UAE & GCC, Recent Developments & Strategic Moves, Strengths & Weaknesses, Revenue & Estimated UAE Revenue Share, Market Coverage, After-sales Service Capability & Calibration Infrastructure, Unique Value Proposition)
- Company-by-Company Detailed Profiles
Agilent Technologies
Thermo Fisher Scientific
Shimadzu Corporation
PerkinElmer Inc.
JASCO Inc.
Biochrom Ltd.
Hach Company
Beckman Coulter
PG Instruments
B&W Tek
Analytik Jena
VWR International
Hitachi HighTech
INESA Scientific Instrument Co. - SWOT / Competitive Strength–Weakness Analysis
- Pricing Profiles & SKU-level Pricing Analysis
- Service & After-Sales Comparison
- Demand Patterns & Utilization across End-User Segments
- Procurement & Budget Allocation Behavior
- Key Purchase Drivers & Pain Points
- Decision-Making Process & Buying Cycle
- Future Demand Trends & Forecasted Replacement Cycles
- By Value, 2025-2030
- By Volume, 2025-2030
- By Average Selling Price, 2025-2030


 Request a Sample
 Ask for Customization
 Get a Quote
 Enquire Now