
 Download PDF
 Download PDF
Market Overview
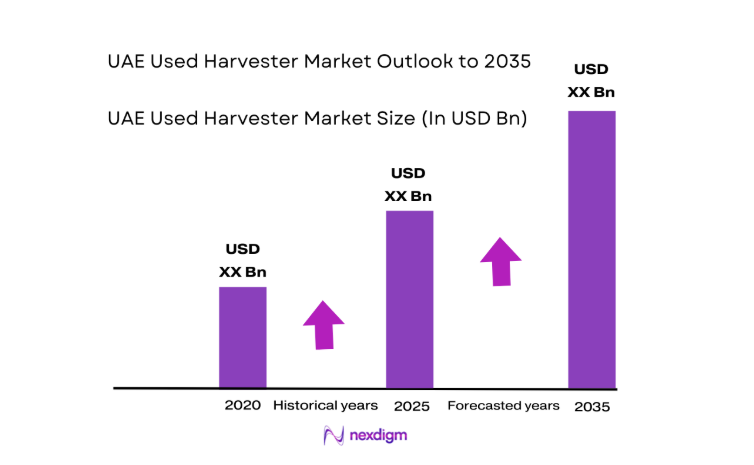
The UAE Used Harvester market current size stands at around USD ~ million, reflecting steady transactional activity across secondary equipment channels supported by refurbishment networks and dealer-backed resale programs. Demand is anchored by replacement cycles among commercial farms and service contractors, with supply shaped by import flows of late-model equipment and local reconditioning capacity. Transactional liquidity is reinforced by financing access and warranty-backed offerings, while quality grading and service coverage influence buyer confidence and purchasing velocity across the ecosystem.
Activity concentrates in Abu Dhabi, Al Ain, and Sharjah due to higher density of commercial farms, proximity to logistics corridors, and access to service depots and parts hubs. Dealer clusters around industrial zones enable refurbishment throughput and faster turnaround times. Contract harvesting operators create localized demand spikes during peak seasons, while policy support for mechanization and water-efficient cropping practices shapes equipment preferences. Mature dealer networks and port-linked import channels strengthen availability across inland farming belts.
Market Segmentation
By Harvester Type
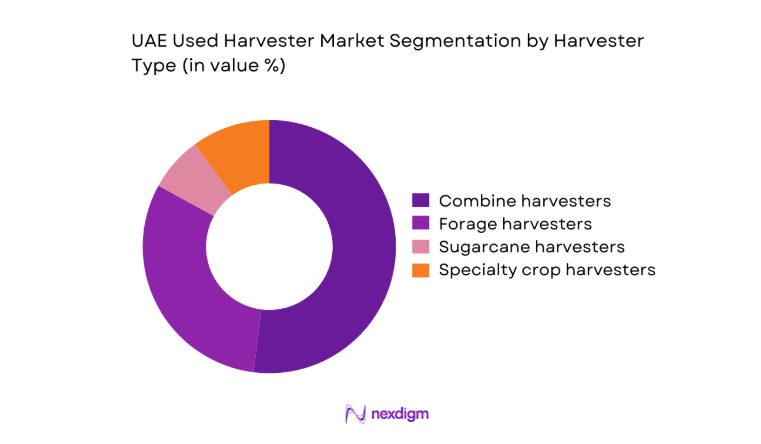
Combine harvesters dominate used equipment transactions as cereal and fodder production scales through mechanized operations supported by contractor fleets. Buyers favor mid-to-high horsepower combines due to multi-crop adaptability, widespread parts availability, and technician familiarity across service hubs. Forage harvesters follow, driven by livestock feed demand and contract harvesting schedules that value uptime and rapid maintenance. Specialty crop harvesters remain niche, reflecting orchard concentration and customization needs that complicate resale liquidity. The dominance of combines is reinforced by refurbishment economics, faster resale cycles, and stronger financing eligibility relative to specialized machines with narrower application profiles.
By Sales Channel
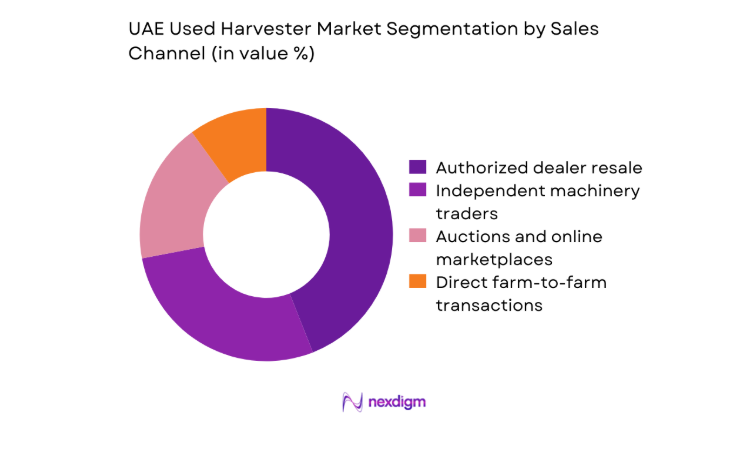
Authorized dealer resale leads due to certified refurbishment, warranty coverage, and structured financing that reduce buyer risk. Independent machinery traders contribute meaningful liquidity through price-led deals and flexible sourcing from regional fleets, though service depth varies. Auctions and online marketplaces are expanding as digital listings improve discovery and transparency, compressing negotiation cycles. Direct farm-to-farm transactions persist for known-condition assets within local networks, typically during fleet upgrades. Dealer-led channels retain dominance as buyers prioritize uptime assurance, verified maintenance histories, and access to parts inventories that reduce operational downtime during peak harvesting windows.
Competitive Landscape
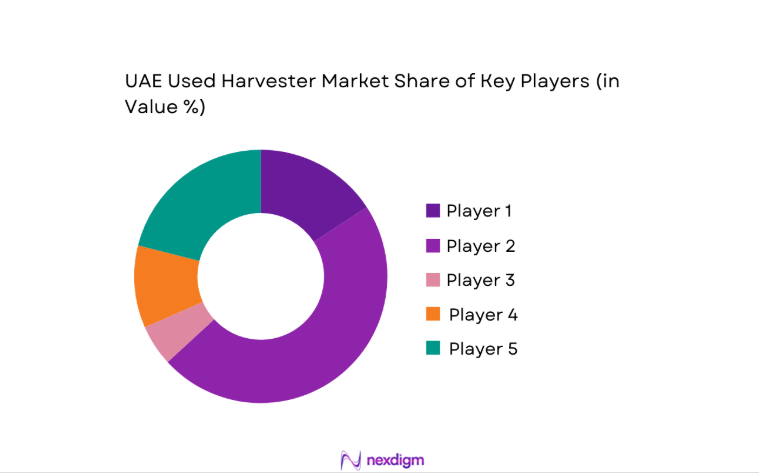
The competitive environment is shaped by OEM-affiliated dealer networks, regional heavy equipment distributors, and global auction platforms facilitating secondary equipment circulation. Competitive differentiation centers on refurbishment depth, parts availability, service coverage across Emirates, and financing enablement that lowers buyer friction.
| Company Name | Establishment Year | Headquarters | Formulation Depth | Distribution Reach | Regulatory Readiness | Service Capability | Channel Strength | Pricing Flexibility |
| AGCO Corporation | 1990 | Duluth, Georgia, USA | ~ | ~ | ~ | ~ | ~ | ~ |
| John Deere | 1837 | Moline, Illinois, USA | ~ | ~ | ~ | ~ | ~ | ~ |
| CNH Industrial | 2013 | Amsterdam, Netherlands | ~ | ~ | ~ | ~ | ~ | ~ |
| CLAAS Group | 1913 | Harsewinkel, Germany | ~ | ~ | ~ | ~ | ~ | ~ |
| Kubota Corporation | 1890 | Osaka, Japan | ~ | ~ | ~ | ~ | ~ | ~ |
UAE Used Harvester Market Analysis
Growth Drivers
Rising cost of new agricultural machinery driving demand for used equipment
New equipment procurement cycles tightened as interest rate benchmarks increased by 125 basis points across 2022 to 2024, elevating financing burdens for capital assets. Farm operators responded by extending fleet life, with average replacement intervals moving from 5 to 7 years, intensifying demand for certified pre-owned units. Import approvals for used machinery rose by 410 units in 2024 versus 2023, reflecting affordability-driven substitution. Public procurement thresholds emphasized cost containment across 2024, favoring secondary equipment for service contractors. Logistics throughput at Jebel Ali handled 3 additional RoRo berths in 2025, supporting inbound used equipment volumes and reducing lead times.
Expansion of mechanized farming in arid and semi-arid regions
Mechanization advanced as irrigated acreage expanded by 1,800 hectares across 2022 to 2025 through water-efficient schemes, lifting equipment utilization requirements. Government-supported desert agriculture pilots scaled to 24 sites by 2024, normalizing mechanized harvesting in controlled-environment farms. Labor availability tightened with seasonal worker permits declining by 2,400 in 2023, accelerating mechanization adoption. Extension services trained 1,200 operators in combine operation across 2024, improving fleet readiness. Power reliability upgrades added 320 kilometers of rural distribution lines by 2025, enabling consistent equipment use across inland belts, reinforcing sustained demand for used harvesters.
Challenges
Limited availability of suitable models for desert conditions
High-temperature operations above 45 degrees Celsius during peak months stress cooling systems, causing failure rates to rise by 18 incidents per 100 machines reported across 2023 and 2024. Dust ingress elevates filter replacement cycles from 250 to 140 operating hours, increasing downtime risk. Limited availability of desertized configurations constrains supply; only 96 late-model units with reinforced cooling entered the secondary channel in 2024. Inland service depots covered 9 hubs in 2025, leaving 4 farming clusters underserved, extending repair lead times by 6 days on average and reducing buyer confidence in used equipment suitability.
High maintenance and spare parts lead times
Spare parts replenishment cycles lengthened as regional inventories turned 5.2 times in 2022 but slowed to 3.6 times in 2024 due to logistics congestion. Airfreight capacity constraints cut weekly inbound parts consignments by 14 flights during 2023, extending critical component lead times to 21 days. Technician availability lagged demand, with certified mechanics per 100 machines declining from 7 to 5 across 2022 to 2025. Service appointment backlogs reached 11 days in peak season 2024, elevating downtime risks for contract harvesters and discouraging purchases of older units with higher parts failure probability.
Opportunities
Growth in certified refurbishment programs by OEM dealers
Dealer-led refurbishment throughput expanded as workshop bays increased by 12 across 2023 to 2025, enabling standardized overhauls with documented maintenance histories. Certification protocols adopted 28-point inspection checklists aligned to safety compliance, reducing post-sale failure incidents by 19 cases per 100 machines in 2024. Technician upskilling programs certified 260 mechanics by 2025, lifting service capacity and warranty coverage confidence. Digital service records integrated with telematics on 410 refurbished units in 2024 improved uptime monitoring. Institutional buyers increasingly mandated certification, expanding addressable demand for dealer-backed used harvesters.
Digital marketplaces improving price discovery and trust
Verified listing platforms onboarded 1,900 sellers by 2024, expanding searchable inventory and reducing information asymmetry. AI-based condition scoring processed 6,400 inspection reports in 2025, standardizing quality signals for buyers. Transaction cycle times shortened from 21 to 13 days across 2023 to 2025 as escrow-enabled payments reduced counterparty risk. Logistics integrations with 14 regional carriers enabled door-to-door delivery scheduling, compressing fulfillment windows by 4 days. Complaint resolution units closed 82 percent of disputes within 10 days in 2024, strengthening buyer confidence and accelerating marketplace adoption.
Future Outlook
The market is expected to benefit from continued mechanization initiatives, stronger refurbishment standards, and expanding digital trade infrastructure across the Emirates. Policy emphasis on efficient agriculture and service-sector professionalization should reinforce certified resale channels. Over the medium term, improved parts localization and service coverage will likely stabilize uptime expectations, supporting broader adoption of certified pre-owned harvesters.
Major Players
- AGCO Corporation
- John Deere
- CNH Industrial
- CLAAS Group
- Kubota Corporation
- Al-Futtaim Engineering
- Al-Bahar
- Gulf Mechanical Company
- Ritchie Bros. Auctioneers
- Machinery Trader
- Mascus
- TradeMachines
- Titan Machinery
- Al Faris Group
- United Motors & Heavy Equipment
Key Target Audience
- Commercial farm operators and agribusiness groups
- Contract harvesting and farm service providers
- Equipment dealers and refurbishment workshops
- Agricultural cooperatives and producer organizations
- Banks and asset finance providers
- Investments and venture capital firms
- Government and regulatory bodies with agency names such as Ministry of Climate Change and Environment and Abu Dhabi Agriculture and Food Safety Authority
- Logistics and heavy equipment transport providers
Research Methodology
Step 1: Identification of Key Variables
Core variables included equipment age bands, refurbishment depth, service coverage density, import clearance timelines, and utilization intensity across farming belts. Policy enablers for mechanization and compliance requirements shaped variable selection. Dealer network footprint and parts localization readiness were prioritized to reflect operational realities. Data capture frameworks aligned variables to transaction workflows.
Step 2: Market Analysis and Construction
Supply flows were mapped across import channels, dealer refurbishment capacity, and secondary listings. Demand centers were constructed around crop clusters, contractor fleets, and service depots. Channel performance was assessed through transaction velocity, service lead times, and warranty penetration. Operational constraints were incorporated to reflect downtime risks and seasonal peaks.
Step 3: Hypothesis Validation and Expert Consultation
Hypotheses on channel dominance and refurbishment value were validated through structured interviews with farm managers, service heads, and logistics operators. Regulatory compliance interpretations were verified with port clearance practitioners. Service bottleneck assumptions were stress-tested with workshop supervisors and parts coordinators. Iterative validation refined causal linkages.
Step 4: Research Synthesis and Final Output
Findings were synthesized into coherent narratives linking policy, infrastructure, and service capacity to adoption dynamics. Cross-lens triangulation ensured consistency across channels and applications. Scenario framing tested sensitivity to logistics throughput and technician availability. Final outputs emphasized actionable insights for operators, dealers, and financiers.
- Executive Summary
- Research Methodology (Market Definitions and classification of used harvesters in UAE, Primary interviews with farm owners and machinery dealers, Transaction data tracking from equipment resellers and auctions, Import-export and customs data triangulation, Field surveys on machinery utilization and replacement cycles, Pricing intelligence from dealer listings and financing partners)
- Definition and Scope
- Market evolution
- Usage and refurbishment pathways
- Ecosystem structure
- Supply chain and dealer network structure
- Regulatory environment

- Growth Drivers
Rising cost of new agricultural machinery driving demand for used equipment
Expansion of mechanized farming in arid and semi-arid regions
Growth of contract harvesting services across Emirates
Availability of refurbished machines with dealer warranties
Access to asset financing and leasing for SMEs
Import inflows of used harvesters from Europe and Asia - Challenges
Limited availability of suitable models for desert conditions
High maintenance and spare parts lead times
Lack of standardized quality grading in secondary market
Regulatory compliance for emissions and safety retrofits
Fragmented dealer network with uneven aftersales coverage
Low resale transparency and price volatility - Opportunities
Growth in certified refurbishment programs by OEM dealers
Digital marketplaces improving price discovery and trust
Partnerships with financing institutions for used equipment loans
Fleet renewal cycles from large agribusinesses releasing used assets
Localization of spare parts and service hubs
Demand from emerging agritech and mechanized service providers - Trends
Rising preference for certified pre-owned harvesters
Adoption of telematics-enabled used equipment
Shift toward higher horsepower used combines for large farms
Online auction platforms gaining traction in the UAE
Bundled service contracts with used equipment sales
Increased imports of late-model used harvesters - Government Regulations
- SWOT Analysis
- Stakeholder and Ecosystem Analysis
- Porter’s Five Forces Analysis
- Competition Intensity and Ecosystem Mapping
- By Value, 2020–2025
- By Volume, 2020–2025
- By Installed Base, 2020–2025
- By Average Selling Price, 2020–2025
- By Harvester Type (in Value %)
Combine harvesters
Forage harvesters
Sugarcane harvesters
Specialty crop harvesters - By Power Output (in Value %)
Below 200 HP
200–300 HP - By Age of Equipment (in Value %)
Below 5 years
5–10 years
Above 10 years - By Condition Grade (in Value %)
Refurbished and certified
Operational used
As-is condition - By Sales Channel (in Value %)
Authorized dealer resale
Independent machinery traders
Auctions and online marketplaces
Direct farm-to-farm transactions - By Application (in Value %)
Cereal and grains
Forage and fodder
Dates and orchard crops
Contract harvesting services
- Market structure and competitive positioning
Market share snapshot of major players - Cross Comparison Parameters (harvester portfolio breadth, refurbishment capability, dealer network coverage, spare parts availability, pricing competitiveness, financing partnerships, warranty offerings, digital sales presence)
- SWOT Analysis of Key Players
- Pricing and Commercial Model Benchmarking
- Detailed Profiles of Major Companies
AGCO Corporation
John Deere
CNH Industrial
CLAAS Group
Kubota Corporation
Al-Futtaim Engineering
Al-Bahar
Gulf Mechanical Company
Ritchie Bros. Auctioneers
Machinery Trader
Mascus
TradeMachines
Titan Machinery
Al Faris Group
United Motors & Heavy Equipment
- Demand and utilization drivers
- Procurement and tender dynamics
- Buying criteria and vendor selection
- Budget allocation and financing preferences
- Implementation barriers and risk factors
- Post-purchase service expectations
- By Value, 2026–2035
- By Volume, 2026–2035
- By Installed Base, 2026–2035
- By Average Selling Price, 2026–2035


 Request a Sample
 Ask for Customization
 Get a Quote
 Enquire Now