
 Download PDF
 Download PDF
Market Overview
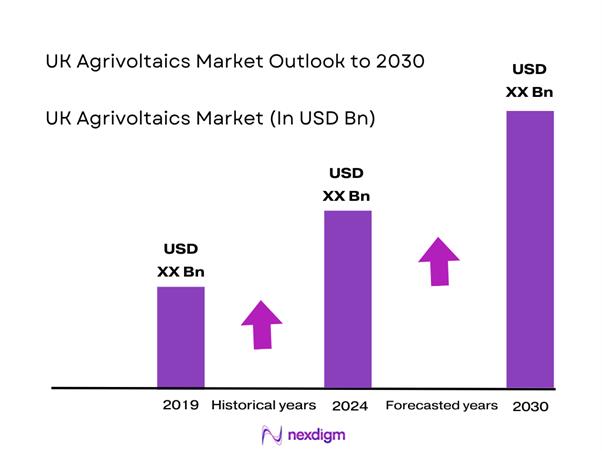
The UK agrivoltaics market is valued at USD ~ million in the base year and USD ~ million in the subsequent year. The revenue base is being pulled up by three demand-side “stacked value” levers: (i) utility-scale solar acceleration targets and grid-connection reforms pushing more shovel-ready projects forward, (ii) landowner appetite for long-duration, index-linked lease income alongside continued farm activity, and (iii) planning strategies that increasingly reward biodiversity, soil, and water outcomes when solar is paired with grazing or crop-compatible layouts.
Within the UK, project origination and capital deployment tends to concentrate around London (infrastructure investors, utilities, corporate PPAs, and legal/financing ecosystems) and the South East / East of England development corridor (dense grid nodes, developer clusters, and mature planning/consultancy capacity), while Scotland remains influential through renewable-led policy momentum and large land holdings suited to grazing-compatible solar. Internationally, the UK market’s technology, EPC, and investment playbooks are most strongly shaped by Germany, the Netherlands, and France, where agri-PV pilots, standards work, and design archetypes (elevated arrays, horticulture shading, and dual-use compliance frameworks) have matured earlier and transfer well into UK planning narratives.
Market Segmentation
By Placement
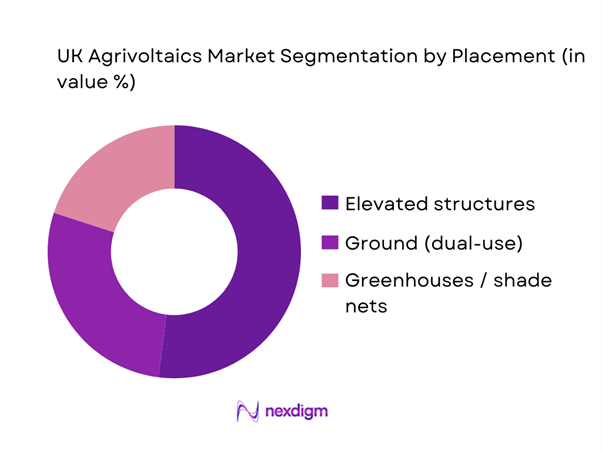
The UK agrivoltaics market is segmented by placement into elevated structures, greenhouses/shade nets, and ground-mounted dual-use layouts. In the UK context, elevated structures dominate because they best reconcile the planning requirement to keep land in agricultural use with the operational reality of farm machinery access, livestock movement, and maintenance safety. Elevated designs also enable “soft land-use” narratives—sheep grazing, meadow planting, and biodiversity net gain—that can de-risk permitting, especially where local stakeholders are sensitive to food-security and landscape arguments. Greenhouse/shade-net agrivoltaics is growing but remains narrower due to capex intensity and crop specificity, while ground dual-use competes with conventional solar farms unless the agricultural co-activity is robustly evidenced.
By Application
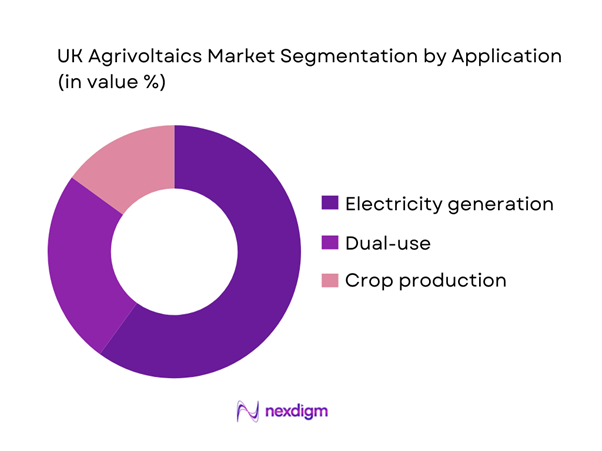
The UK agrivoltaics market is segmented by application into electricity generation, crop production, and dual-use (power + farming). Electricity generation leads because near-term procurement is still anchored in power economics: grid access, offtake certainty, and portfolio-scale returns. Developers often begin with a solar-first financial model and then “upgrade” into agrivoltaics by redesigning spacing, height, and ground management to improve planning outcomes and community acceptance without eroding bankability. Dual-use is the fastest-moving strategic posture (especially grazing + biodiversity + battery co-location), but project financiers still underwrite power revenues first. Crop-production-led agrivoltaics remains smaller in the UK due to variability in horticulture economics and the limited number of long-running, UK-climate-specific yield datasets accepted by lenders.
Competitive Landscape
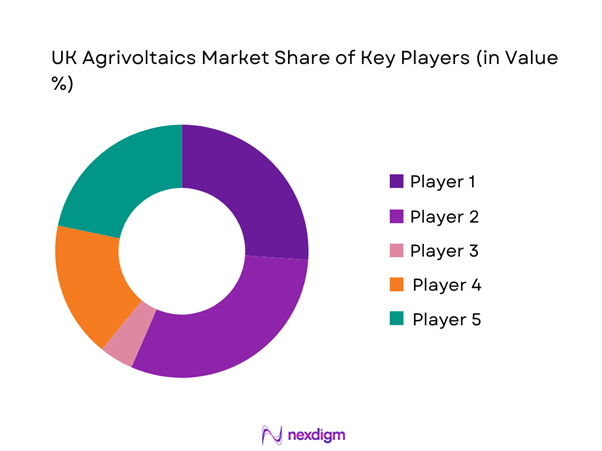
The UK agrivoltaics market is developer-led and increasingly finance-driven, with competitive advantage clustering around (i) land origination and community engagement, (ii) grid-connection capability and queue strategy, (iii) planning navigation (including NSIP/DCO pathways for larger assets), and (iv) bankable “agri + ecology” operating models that satisfy lenders while protecting farm activity. The most scalable players are those that can industrialize dual-use templates (grazing, biodiversity groundcover, drainage, fencing, and O&M access) while pairing them with strong offtake routes and storage co-location optionality.
| Company | Est. year | HQ | UK development model | Agrivoltaic pathway | Grid & offtake strength | Delivery capability | Land & agri partnerships | Planning & compliance focus |
| Lightsource bp | 2010 | London, UK | ~ | ~ | ~ | ~ | ~ | ~ |
| RES Group | 1981 | Kings Langley, UK | ~ | ~ | ~ | ~ | ~ | ~ |
| EDF Renewables | 2004 | Nanterre, France | ~ | ~ | ~ | ~ | ~ | ~ |
| BayWa r.e. | 1923* | Munich, Germany | ~ | ~ | ~ | ~ | ~ | ~ |
| RWE Renewables | 1898* | Essen, Germany | ~ | ~ | ~ | ~ | ~ | ~ |
UK Agrivoltaics Market Analysis
Growth Drivers
Energy security and domestic generation priorities
The UK agrivoltaics case is strengthened by the macro and system backdrop: the United Kingdom’s GDP is at US$ ~ trillion with GDP per capita at US$ ~, anchoring a large electricity-consuming economy that is sensitive to supply volatility. On the energy-balance side, total energy production was ~ million tonnes of oil equivalent and net imports were ~ million tonnes of oil equivalent, with net import dependency at ~ (as a share measure) and imports at ~ million tonnes of oil equivalent—a structural signal that domestically generated low-carbon electricity is strategically valued. Agrivoltaics fits this security narrative because it scales domestic solar supply while keeping land in agricultural use, and the land footprint is now quantified: ground-mount solar PV covered ~ hectares and had ~ operational ground-mount installations recorded in REPD by end-~, with confirmed ground-mount capacity of ~ MW (and an estimated ground-mount total of ~ MW when including unaccredited capacity assumptions). These system numbers matter for dual-use siting: when domestic production is at a record low and imports rise, project pipelines that can be consented, connected and operated on working farms become more investable—especially where storage, demand flexibility and embedded generation can reduce exposure to national balancing constraints without needing new land take beyond the solar footprint already evidenced at the UK level.
Corporate decarbonisation and long-term offtake demand
Corporate offtake demand in the UK is ultimately tied to the scale of the national economy and its energy throughput. The macro baseline of US$ ~ trillion GDP and US$ ~ GDP per capita implies a large commercial and industrial load base that seeks long-duration electricity supply certainty. Data underline that underlying consumption is not trivial: total primary energy consumption was ~ million tonnes of oil equivalent and final energy consumption (including non-energy use) was ~ million tonnes of oil equivalent, while domestic and services sector consumption each rose by ~ (share measure) and transport demand rose by ~ (share measure). For agrivoltaics, the relevance is that UK corporate decarbonisation strategies increasingly value “additionality” and “deliverability”: solar projects that can show credible land access, planning progress, grid milestones and operational resilience. The solar footprint evidence base is improving in a way that supports contractability: ~ operational ground-mount solar installations were recorded in REPD at end-~ and an estimated ~ hectares of panel coverage for ground-mount solar provides lenders and offtakers a clearer land-use reference point when evaluating dual-use proposals versus conventional solar layouts. Meanwhile, the system constraint is visible in the connections queue: the electricity connections queue stood at ~ GW (and could rise to ~ GW) — a material driver for corporates to prioritize offtake from projects that are “shovel-ready” and more likely to secure timely grid access.
Challenges
Best and most versatile land planning scrutiny
In the UK, agricultural land scrutiny is not abstract: productive land categories have scale, and planning bodies increasingly expect clear evidence on why a given site and layout is appropriate. Land-use statistics show arable cropping at ~ million hectares (level), which frames why decision-makers focus on protecting high-performing agricultural land where possible. Simultaneously, solar land footprint is now quantified in a way that raises the bar for siting narratives: ground-mount solar PV covered ~ hectares by end-~ and documented a median footprint of ~ hectares per MW across ~ operational REPD sites with recorded land-use, alongside ~ operational ground-mount installations in total. This combination creates a planning challenge for agrivoltaics: if an applicant claims “dual use” but cannot show credible agricultural co-activity (machinery access, stocking density feasibility, crop selection, shading tolerance, and agronomy monitoring), planners may treat it as standard solar land-take and apply stronger scrutiny where land quality concerns are raised. The challenge is intensified by the UK’s grid context: the electricity connections queue stood at ~ GW (with potential to rise to ~ GW), which means developers are under pressure to secure sites quickly—sometimes leading to land choice decisions that increase scrutiny risk rather than reduce it. The macro backdrop also matters: with GDP at US$ ~ trillion, the UK has competing land demands for housing, infrastructure and food supply chains, so agrivoltaic proposals must be unusually “evidence heavy” on land justification.
Grid connection queues and curtailment exposure
Grid access is one of the most material UK constraints for agrivoltaics because it shapes timing, revenue certainty and the economics of on-farm electrification. The electricity connections queue stood at ~ GW, and could rise to ~ GW, underscoring the scale of pipeline congestion relative to what the system ultimately needs. Energy statistics reinforce why grid access is strategic: net imports were ~ million tonnes of oil equivalent and the UK’s net import dependency was ~ (share measure), while imports were ~ million tonnes of oil equivalent and exports were ~ million tonnes of oil equivalent. For agrivoltaics, this context creates a paradox: the system needs more domestic low-carbon generation, but the queue delays and connection conditions can force projects to accept constraint risk or longer timelines. The “curtailment exposure” is not just theoretical: net imports rose by ~ (share measure) within primary electricity consumption dynamics, boosted by the Denmark-UK interconnector operating for its first full year—showing system balancing and cross-border flows are actively used to manage supply-demand, which can heighten constraint management needs when domestic renewable output spikes. On the delivery side, nearly ~ GW of energy projects were plugged in during the year, which is meaningful progress but small compared to a queue measured in the hundreds of gigawatts.
Opportunities
Design standardisation and repeatable deployment models
The UK opportunity for agrivoltaics is to turn “bespoke pilot projects” into repeatable deployment models that reduce planning friction, shorten lender diligence, and improve delivery certainty in a grid-constrained environment. The need for speed is visible in the connections queue, which stood at ~ GW and could rise to ~ GW, meaning only projects with strong readiness signals will progress efficiently. Standardisation helps readiness by making agricultural co-activity legible to planners and financiers—consistent racking heights, machinery access corridors, livestock-safe fencing, drainage protections and monitored agronomy outcomes. The land-use evidence base already exists to benchmark layouts: ~ operational ground-mount solar installations, a median land-use of ~ hectares per MW across ~ sites with recorded land use, and an estimated ~ hectares of ground-mount panel coverage. A standardised agrivoltaic “kit” can show how it meets or improves on these benchmarks while preserving farm outputs. Standardisation also aligns with biodiversity compliance: BNG is mandatory in England from ~, so templates that embed habitat design and maintenance into the O&M plan can reduce consenting ambiguity. On the farm economy side, England figures—£~ billion TIFF and £~ billion agricultural GVA—show the sector scale and the practical value of stable diversification structures; repeatable contracts and operating playbooks make it easier for farms to evaluate participation without protracted bespoke negotiation.
Retrofit of existing solar assets into agrivoltaic formats
A highly actionable UK opportunity is retrofitting existing ground-mount solar sites to deliver agrivoltaic outcomes—especially where original layouts underutilise the land beneath and between arrays. The retrofit rationale is supported by the scale of existing assets: ~ operational ground-mount installations recorded in REPD by end-~, with ~ hectares of panel coverage estimated for ground-mount solar and a confirmed ground-mount capacity of ~ MW (plus an estimated ground-mount total of ~ MW using published assumptions on unaccredited capacity). This is a large installed base where relatively modest physical and operational changes—fence redesign, vegetation management shifts, grazing access, raised racking in selective zones, biodiversity habitat plans—can create “dual-use” outcomes without new land acquisition or fresh grid connection applications in many cases. Grid pressure makes retrofit particularly attractive: with the connections queue at ~ GW, avoiding a brand-new connection journey can be strategically valuable for developers and offtakers, even if retrofits still require consents and operational changes. Retrofit also links to statutory biodiversity expectations: BNG is mandatory in England from ~, which can motivate landowners and asset operators to pursue habitat improvements that are measurable and maintainable; agrivoltaic retrofits can package biodiversity delivery with ongoing agricultural activity rather than leaving land in a narrow “solar-only” management mode.
Future Outlook
The UK agrivoltaics market is expected to expand as solar deployment accelerates toward national capacity ambitions and as grid-connection processes increasingly prioritize viable clean-energy projects. The winning project archetypes are likely to be bankable dual-use templates: elevated/grazing-first layouts, biodiversity-groundcover packages, and storage-ready interconnection designs that improve asset utilization. Meanwhile, planning narratives are shifting from “solar vs farmland” to “solar + food resilience + nature recovery,” which strengthens the business case for agrivoltaics over conventional ground-mount in sensitive counties.
Major Players
- Lightsource bp
- RES Group
- EDF Renewables
- BayWa r.e.
- RWE Renewables
- Solarcentury
- NextEnergy Capital
- Low Carbon
- Octopus Energy Generation
- British Solar Renewables
- Elements Green
- SSE Renewables
- ScottishPower Renewables
- TotalEnergies Renewables UK
Key Target Audience
- Utility-scale solar & storage developers / IPPs
- Landowners and estate managers
- Corporate power buyers
- Renewable asset owners and infrastructure funds
- EPC contractors and O&M platform operators
- Agribusiness operators (
- Investments and venture capitalist firms
- Government and regulatory bodies
Research Methodology
Step 1: Identification of Key Variables
We begin by building a UK agrivoltaics ecosystem map covering developers, landowners, DNO/TSO interfaces, planning bodies, and farm operators. Secondary research is executed across official statistics, policy publications, and industry disclosures to define variables such as grid accessibility, land suitability, and dual-use compliance thresholds.
Step 2: Market Analysis and Construction
We compile historic and current-year revenue signals using a bottom-up approach: project pipeline screening, commissioning/connection timelines, and typical commercial structures (development fees, EPC margins where visible, and O&M value pools). This is cross-checked against published market baselines to keep the sizing anchored to reputable references.
Step 3: Hypothesis Validation and Expert Consultation
Hypotheses (e.g., placement dominance, bankability constraints, planning friction points) are validated via structured interviews with developers, agronomists, land agents, and grid specialists. We use interview-driven triangulation to stress-test adoption barriers such as yield uncertainty, insurance and liability, and operational access constraints.
Step 4: Research Synthesis and Final Output
Findings are synthesized into segment-level opportunity maps, competitor benchmarking, and investment-readiness scoring. We then validate conclusions against the latest government roadmap and grid-connection reform direction to ensure strategic relevance for near-term go-to-market decisions.
- Executive Summary
- Research Methodology (Market Definitions and Assumptions, Agrivoltaics Qualification Criteria, Abbreviations, Data Triangulation Logic, Primary Interview Mix, Bottom-Up Project Pipeline Build, Top-Down Capacity and Land-Use Reconciliation, Validation Checks, Limitations)
- Definition and Scope
- Market Genesis and Adoption Pathways
- Business Cycle and Decision Journey
- Stakeholder Ecosystem Map
- UK Deployment Archetypes

- Growth Drivers
Energy security and domestic generation priorities
Corporate decarbonisation and long-term offtake demand
Farm income diversification requirements
Land-use conflict mitigation between food and energy
Biodiversity and ecosystem service integration - Challenges
Best and most versatile land planning scrutiny
Grid connection queues and curtailment exposure
Tenant and landlord alignment complexity
Operational complexity of dual-use land management
Financing and bankability concerns - Opportunities
Design standardisation and repeatable deployment models
Retrofit of existing solar assets into agrivoltaic formats
Vertical bifacial and high-clearance system adoption
Co-located energy storage integration
On-farm microgrids and electrification use cases - Trends
Biodiversity net gain integration into project design
Community benefit and shared-value frameworks
Digital agronomic monitoring and data validation
Precision agriculture and robotics compatibility - Regulatory & Policy Landscape
- SWOT Analysis
- Stakeholder & Ecosystem Analysis
- Porter’s Five Forces Analysis
- Competitive Intensity & Ecosystem Mapping
- By Value, 2019–2024
- By Installed and Operational Capacity, 2019–2024
- By Land Area Under Dual Use, 2019–2024
- By Project Count, 2019–2024
- By Revenue Type, 2019–2024
- By Fleet Type (in Value %)
Elevated fixed-tilt systems
Elevated tracker systems
Vertical bifacial systems
Semi-transparent and greenhouse PV systems
Wide-pitch crop-compatible arrays - By Application (in Value %)
Sheep grazing systems
Cattle and rotational grazing systems
Arable row crops
Horticulture and vegetables
Orchards and soft fruit systems - By Technology Architecture (in Value %)
On-farm behind-the-meter projects
Community and local grid projects
Utility-scale grid-export projects - By End-Use Industry (in Value %)
Owner-occupied farms
Tenanted farms
Large agricultural estates
Mixed-tenure landholdings
Community and cooperative land models - By Region (in Value %)
Southern England
Midlands
Eastern England
Northern England
Scotland and Wales
- Competitive intensity mapping by developer archetype
- Cross Comparison Parameters (agrivoltaic design capability, planning approval success rate, agricultural land classification strategy, grid connection positioning, co-activity operating depth, biodiversity net gain delivery model, offtake and PPA structuring capability, storage and curtailment mitigation strategy)
- Company strategy benchmarking
- Detailed Profiles of Major Companies
Lightsource bp
EDF Renewables UK
Statkraft UK
RWE Renewables
RES
SSE Renewables
Octopus Energy Generation
BayWa r.e. UK
British Solar Renewables
Low Carbon
Anesco
NextEnergy Capital
ib vogt UK
Quinbrook Infrastructure Partners
- Offtaker requirements and procurement criteria
- Landowner and tenant decision drivers
- Approval, contracting, and diligence processes
- Pain points and unmet needs across stakeholders
- By Value, 2025–2030
- By Installed and Operational Capacity, 2025–2030
- By Land Area Under Dual Use, 2025–2030
- By Project Count, 2025–2030


 Request a Sample
 Ask for Customization
 Get a Quote
 Enquire Now