
 Download PDF
 Download PDF
Market Overview
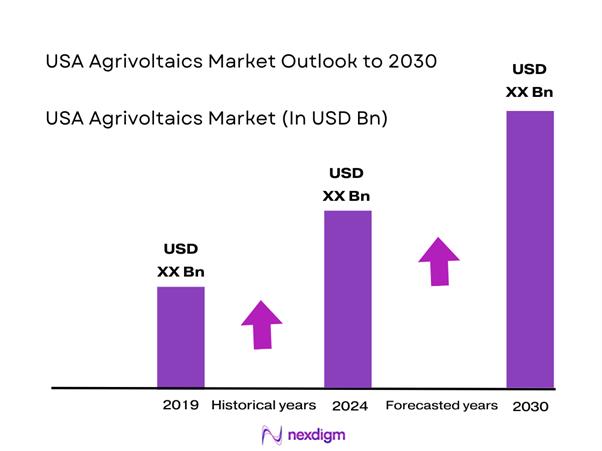
The USA agrivoltaics market is valued at USD ~ million, moving up from USD ~ million on a recent historical baseline. This is supported by the rapid scaling of U.S. solar deployment, which expands the addressable base of sites where dual-use practices (grazing, habitat, and crop trials) can be layered into project design and O&M contracts. At the project evidence level, DOE/NREL had already tracked ~ agrivoltaic projects representing over ~ GW in the national pipeline, reinforcing commercialization momentum.
Dominance concentrates in solar-leading states and metros where interconnection throughput, land availability, and agricultural operations overlap—especially Texas, California, Florida, and the Mid-Atlantic/Northeast corridor. Texas benefits from large-scale utility solar growth and wide pasture availability that fits solar grazing operations; California’s leadership ties to agricultural intensity, water/heat stress considerations, and mature renewable procurement; Florida’s growth is linked to accelerating solar buildout and land-use compatibility in select counties. These locations also attract integrators and grazing/habitat partners because permitting narratives can be strengthened through dual-use community benefits.
Market Segmentation
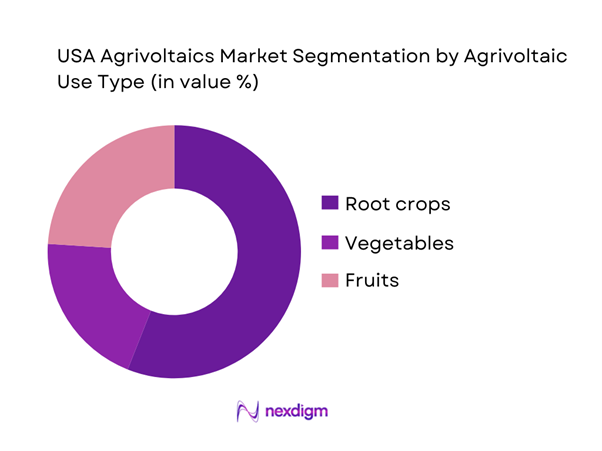
By Agrivoltaic Use Type
The USA agrivoltaics market is segmented by agrivoltaic use type into root crops, vegetables, and fruits (used by many datasets as a proxy for crop-driven design requirements such as clearance, shading tolerance, and mechanization). In recent reporting, root crops hold a dominant share under this segmentation. The primary reason is operational compatibility: root crop systems typically tolerate partial shade while benefiting from reduced evaporation and more stable soil moisture microclimates, making them easier to pair with common PV layouts. This reduces agronomic performance risk for developers and financiers who prioritize predictable outcomes, and it simplifies farm-equipment access planning compared with some specialty crops. The dominance also reflects how early agrivoltaics projects prioritize low-disruption cropping profiles while the sector builds bankability.
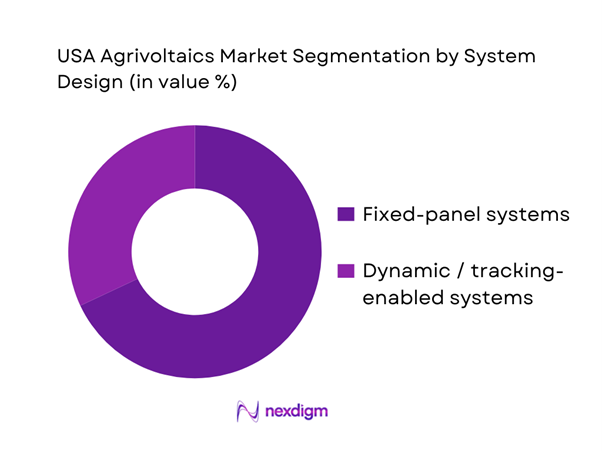
By System Design
The USA agrivoltaics market is also segmented by system design into fixed-panel systems and dynamic / tracking-enabled systems. In recent reporting, fixed-panel systems dominate because they are simpler to permit, engineer, and maintain while reducing mechanical complexity that can interfere with farming operations and safety workflows. Fixed designs also fit many early agrivoltaics deployments where the primary dual-use objective is vegetation management or habitat stewardship (including pollinator/native habitat), rather than maximizing crop yield response to variable shading. For developers, fixed systems can shorten build schedules and reduce O&M uncertainty—important where interconnection and procurement timelines are already long. Dynamic systems are still strategically important, especially for higher-value crops where shade control is a differentiator, but fixed remains the mainstream baseline for scale.
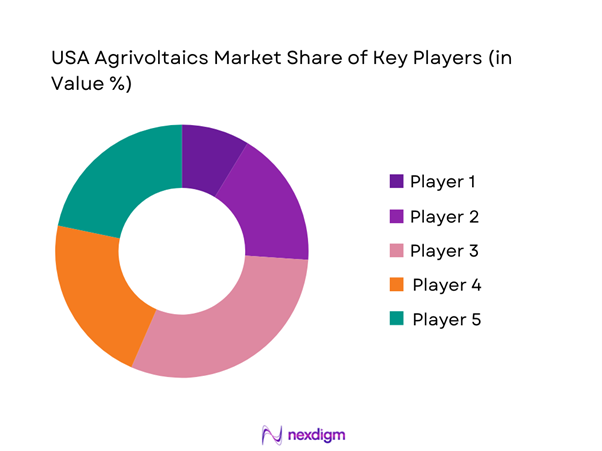
Competitive Landscape
The USA agrivoltaics market remains “developer-led,” with adoption often implemented as a project-level layer on top of large solar portfolios rather than a standalone industry of pure-play agrivoltaics companies. Consolidation is visible through the influence of major IPPs and developers that control land origination, interconnection queue positions, EPC contracting, and long-term O&M—allowing them to standardize dual-use practices such as solar grazing and habitat management across multi-site portfolios. At the same time, regional specialists and community solar platforms help expand agrivoltaics where local permitting, landowner structures, and community benefits are decisive.
| Company | Est. Year | HQ | Primary agrivoltaics pathway | Typical project scale bias | Land / community approach | O&M “dual-use” lever | Interconnection posture | ESG / reporting angle |
| NextEra Energy Resources | 1984 | USA | ~ | ~ | ~ | ~ | ~ | ~ |
| Lightsource bp | 2010 | UK (US ops) | ~ | ~ | ~ | ~ | ~ | ~ |
| Enel North America | 1997 | USA/Italy (group) | ~ | ~ | ~ | ~ | ~ | ~ |
| Silicon Ranch | 2011 | USA | ~ | ~ | ~ | ~ | ~ | ~ |
| Nexamp | 2007 | USA | ~ | ~ | ~ | ~ | ~ | ~ |
USA Agrivoltaics Market Analysis
Growth Drivers
Farmer income diversification logic
US agrivoltaics is pulled forward by farm-income volatility and the scale of farm operations that can host long-duration land-use contracts. USDA’s farm income outlook shows net cash farm income of ~ billion alongside net farm income of ~ billion, highlighting why producers look for diversified revenue stability beyond crop and livestock cycles. At the base of the addressable land pool, the US has ~ farms and a large national land-in-farms footprint that supports co-location models where production continues alongside PV. On the macro side, agriculture remains a meaningful real-economy contributor: agriculture, forestry and fishing value added of ~ and a rural population share of ~, reinforcing why on-farm resilience strategies matter in a distributed, rural-heavy operating environment.
Land-use conflict mitigation
Agrivoltaics is increasingly positioned as a “keep land working” pathway in a country where farmland availability and siting acceptance are strategic constraints. Census highlights show ~ acres of land in farms, and annual farms-and-land summaries place current operational farm counts at ~, which frames the scale of agricultural land where energy siting debates occur. At the same time, grid-side buildout pressure is very real: operating solar generating capacity in the Lower ~ increasing from ~ GW to ~ GW (capacity operating in the referenced months), expanding the number of rural counties encountering solar permitting decisions. Macro conditions reinforce the stakes: GDP per capita of ~ and inflation of ~, which increases sensitivity to food-system stability and multi-use land strategies rather than land conversion narratives.
Challenges
Permitting constraints on prime farmland
Permitting friction is a major constraint when projects intersect high-quality agricultural land and county-level zoning politics. The scale of the stake is large: Census highlights show ~ acres of land in farms, and the latest annual farms summary estimates ~ farms, meaning many jurisdictions have direct agricultural constituencies that weigh in on conditional-use permits. On the energy side, rapid solar expansion increases the frequency of local permitting confrontations: operating solar capacity rising from ~ GW to ~ GW in the Lower ~ in the cited period, intensifying land-use debate density. Macro indicators amplify the political sensitivity: inflation of ~ and unemployment of ~, which can raise local expectations that new energy projects demonstrate durable community benefits; agrivoltaics can help, but only when the permit narrative is credible and measurable.
Agronomic yield uncertainty
Agronomic uncertainty remains a key technical challenge because shading patterns, microclimates, and access constraints can affect outcomes differently by crop type and region. Even in conventional farming, yield outcomes move materially year to year: corn yield of ~ bushels per acre and then ~ bushels per acre in the subsequent annual summary, while harvested corn area is reported at ~ acres for the later period—illustrating how large the production base is and how small per-acre shifts translate into massive system-level changes. For agrivoltaics, that uncertainty interacts with PV layout decisions, which is why bankability often requires conservative agronomy assumptions until multi-season evidence is established. Macro indicators frame the consequence of yield variability: agriculture value added of ~ and rural population share of ~, meaning a meaningful rural economic segment remains exposed to agricultural performance swings that agrivoltaics must not worsen.
Opportunities
Standardization of agrivoltaic design templates
A major opportunity is to turn agrivoltaics from “custom engineering every time” into standardized templates that reduce permitting friction, construction variability, and operational disputes between solar O&M teams and farm operators. The US already has a meaningful evidence base to standardize against: tracking identified ~ projects totaling over ~ GW, which provides enough diversity across geographies and use cases to codify repeatable design rules (clearance, row spacing, fencing/water, access lanes, safety SOPs, monitoring). Standardization is also enabled by the broader solar manufacturing and deployment ecosystem: PV module production of ~ GW in the first half of the referenced period, and operating solar capacity reaching ~ GW in the Lower ~, creating a large “learning system” where templates can be replicated at scale. Macro conditions support implementation: GDP per capita of ~, indicating capacity for industrialization of best practices across large portfolios.
Retrofit conversion of existing solar assets
Retrofit conversion—adding grazing, habitat, or farm-compatible access improvements to existing solar sites—is a scalable growth pathway because it leverages an already-large installed base rather than depending only on new-build projects. The installed base is expanding fast: operating solar capacity in the Lower ~ at ~ GW in the cited month versus ~ GW in the prior comparison, implying a growing inventory of sites where vegetation strategies and land-use narratives can be upgraded after commissioning. Retrofit is further supported by the scale of the interconnection queue: solar at ~ GW in queues, meaning many developers will manage long lead times—creating incentive to extract more value from already-operational assets through dual-use enhancements while new projects wait for grid access. From the agricultural operations side, the US livestock base relevant to solar grazing is measurable, supporting availability for expanded grazing programs tied to operating sites. Macro context from agriculture value added of ~ supports the logic of integrating agriculture into operating energy assets where feasible.
Future Outlook
Over the next five to six years, the USA agrivoltaics market is expected to expand as solar continues to be built at scale and as developers increasingly integrate “dual-use” elements to improve permitting outcomes, reduce vegetation O&M costs, and strengthen community acceptance. Growth will be reinforced by maturing agronomic evidence (crop suitability, grazing performance), better measurement and verification of agricultural outcomes, and standardization of design templates (clearance, row spacing, fencing, water access). Continued interconnection constraints will keep portfolio developers advantaged, while community solar programs will remain a key channel for local dual-use adoption.
Major Players
- NextEra Energy Resources
- Lightsource bp
- Enel North America
- AES Clean Energy
- Invenergy
- EDF Renewables North America
- RWE Clean Energy
- Ørsted (Onshore North America)
- Avangrid Renewables
- Silicon Ranch
- Nexamp
- Cypress Creek Renewables
- Ørsted / partner development platforms
- Leeward Renewable Energy
Key Target Audience
- Utility-scale solar developers and IPPs
- Community solar developers and subscription platform operators
- Renewable energy infrastructure funds and strategic investors
- Investments and venture capitalist firms
- Electric utilities and corporate offtakers
- EPC contractors and racking / tracker providers serving high-clearance and dual-use designs
- Agricultural landowners, farmland REITs, and land-lease aggregators
- Government and regulatory bodies
Research Methodology
Step 1: Identification of Key Variables
The research begins by mapping the U.S. agrivoltaics ecosystem across developers, landowners, agricultural operators, EPC/racking suppliers, and regulators. Desk research consolidates definitions of “dual-use” and classifies projects into grazing, crops, and habitat pathways. The output is a variable framework covering capacity, land footprint, design specs, and O&M models.
Step 2: Market Analysis and Construction
Historical market construction uses a bottom-up approach anchored to published market sizing, complemented with evidence from national agrivoltaics tracking and solar deployment statistics. The analysis connects project growth drivers (interconnection, land availability) with adoption enablers (permitting narratives, vegetation economics) to explain scale-up pathways.
Step 3: Hypothesis Validation and Expert Consultation
Hypotheses on dominant use-cases (e.g., solar grazing/habitat overlays), system design preferences, and commercial models are validated through structured interviews with developers, O&M contractors, grazing operators, and county-level stakeholders. Consultations emphasize operational feasibility, risk allocation, and bankability requirements to refine segment logic.
Step 2: Research Synthesis and Final Output
All findings are synthesized into an integrated market view linking market size, segment benchmarks, and competitive positioning. Cross-checks reconcile reported market values with adoption indicators (project counts/capacity tracking) and with broader U.S. solar deployment momentum. The final deliverable includes segment tables, competitor benchmarking, and buyer-ready recommendations.
- Executive Summary
- Research Methodology (Market definitions and boundary conditions, Inclusion and exclusion for dual-use, Acronyms, Data triangulation logic, Bottom-up project census build, Top-down capacity and land-use reconciliation, Primary interviews mix, Data validation rules, Limitations and confidence scoring)
- Definition and Scope
- Evolution of Agrivoltaics in the U.S.
- Agrivoltaics Adoption Census Snapshot
- Agrivoltaics Business Cycle
- Stakeholder and Decision Chain

- Growth Drivers
Farmer income diversification logic
Land-use conflict mitigation
Corporate ESG-driven siting decisions
Vegetation management cost optimization
Grid-scale solar buildout alignment - Challenges
Permitting constraints on prime farmland
Agronomic yield uncertainty
Equipment access limitations
Wildlife and fencing complexities
Financing and lender bankability concerns - Opportunities
Standardization of agrivoltaic design templates
Retrofit conversion of existing solar assets
Scale-up of grazing and habitat-based models
Integration with climate-smart agriculture initiatives
Premium siting and community acceptance outcomes - Trends
Shift toward grazing and habitat-dominant agrivoltaic deployments
Measurement and verification of agricultural outcomes
Biodiversity scorecard adoption
Integration of agronomic monitoring technologies - Regulatory & Policy Landscape
- SWOT Analysis
- Stakeholder & Ecosystem Analysis
- Porter’s Five Forces Analysis
- Competitive Intensity & Ecosystem Mapping
- Technology and Design Framework for Agrivoltaics
- By Value, 2019–2024
- By Installed Capacity, 2019–2024
- By Land Footprint, 2019–2024
- By Project Count, 2019–2024
- By Agrivoltaics Use Type, 2019–2024
- By Application (in Value %)
Livestock grazing
Row crops and mechanized field crops
Specialty crops
Pollinator and native habitat co-location
Greenhouse and shade-structure PV - By Technology Architecture (in Value %)
High-clearance fixed-tilt systems
High-clearance single-axis tracker systems
Vertical bifacial PV systems
Canopy and trellis agrisolar structures
Greenhouse-integrated PV systems - By End-Use Industry (in Value %)
Owner-operated farms and ranches
Leased agricultural landholdings
Community solar developers
Utility-scale independent power producers
Agricultural cooperatives - By Connectivity Type (in Value %)
Standalone PV with manual agronomic management
PV with sensor-enabled agronomic monitoring
SCADA-integrated agrivoltaic systems
Cloud-based performance and crop analytics platforms - By Region (in Value %)
Northeast and Mid-Atlantic
Midwest
South and Southeast
Southwest and Mountain West
Pacific Coast
- Market concentration and positioning analysis
- Cross Comparison Parameters (Dual-use operating and contracted capacity, Co-located land footprint, Agrivoltaic modality mix, Design specification index, Vegetation management economics, Farmer partnership and contracting model, Permitting and community engagement strength, Measurement and verification stack)
- SWOT Analysis of Major Players
- Partnership and ecosystem benchmarking
- Detailed Company Profiles
NextEra Energy Resources
Lightsource bp
Enel North America
AES Clean Energy
Invenergy
EDF Renewables North America
RWE Clean Energy
Ørsted Onshore North America
Avangrid Renewables
Silicon Ranch
Nexamp
BlueWave
Ameresco
Leeward Renewable Energy
- Landowner and farmer segments
- Developer and IPP procurement lens
- Utility and offtaker perspectives
- Capital provider and tax equity assessment
- Decision-making journey and approval workflows
- By Value, 2025–2030
- By Installed Capacity, 2025–2030
- By Land Footprint, 2025–2030
- By Project Count, 2025–2030
- By Agrivoltaics Use Type Mix, 2025–2030


 Request a Sample
 Ask for Customization
 Get a Quote
 Enquire Now