
 Download PDF
 Download PDF
Market Overview
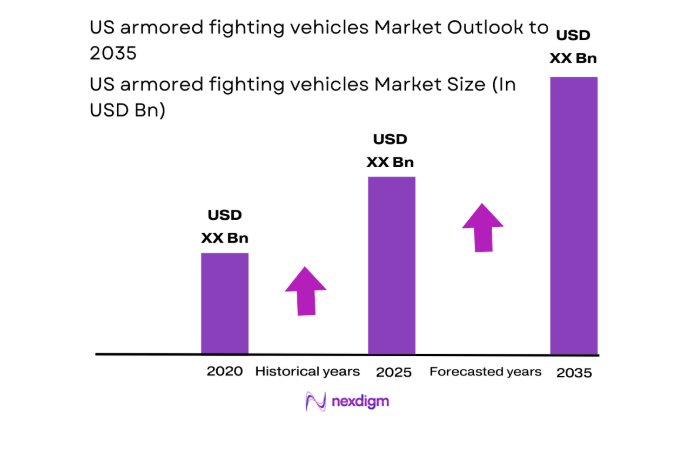
The US armored fighting vehicles market current size stands at around USD ~ million, reflecting sustained procurement and modernization activity across tracked and wheeled combat platforms supporting maneuver, reconnaissance, and protected mobility missions. Demand is anchored in fleet sustainment cycles, life-extension programs, and incremental capability upgrades spanning survivability, lethality, and digital integration. Capital allocation remains concentrated in multi-year platform roadmaps, depot-level recapitalization, and subsystem modernization across powertrain, protection suites, and mission electronics, supported by long-term operational readiness objectives.
Demand concentration is strongest around major Army and Marine Corps installation clusters, test and evaluation ranges, and depot ecosystems that anchor maintenance, integration, and training throughput. Industrial ecosystems mature around established defense manufacturing corridors with deep-tier supplier networks for armor materials, propulsion, and vetronics. Policy environments emphasize domestic manufacturing resilience, security compliance, and interoperability standards, reinforcing localized production footprints, qualification pipelines, and sustainment capacity near operational hubs and logistics nodes supporting expeditionary readiness.
Market Segmentation
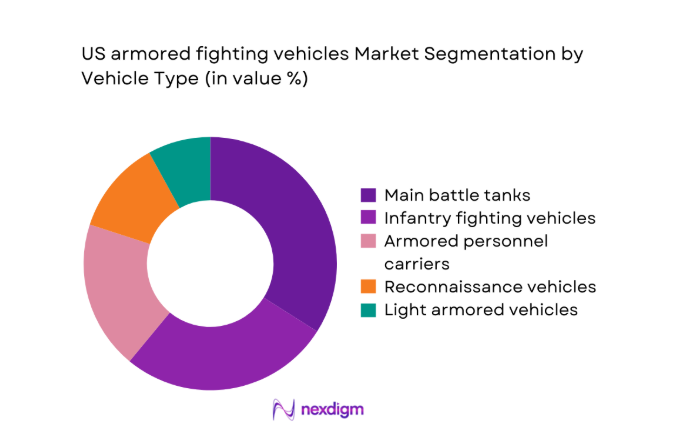
By Vehicle Type
Main battle tanks, infantry fighting vehicles, and armored personnel carriers dominate procurement priorities due to their centrality to combined arms maneuver and force protection requirements across diverse terrains. Reconnaissance variants and light armored vehicles are increasingly prioritized for mobility in dispersed operations, while MRAP platforms retain relevance for route clearance and protected mobility in permissive environments. Fleet mix decisions are shaped by survivability upgrades, digital architecture compatibility, and modular mission configurations enabling rapid role conversion. Lifecycle considerations favor platforms with upgradeable protection suites and common powertrain components, supporting depot-level sustainment efficiencies. Interoperability requirements and mission tailoring further reinforce balanced portfolios across heavy, medium, and light categories.
By Program Status
Modernization and recapitalization programs dominate spending priorities as fleets transition through mid-life upgrades, service life extensions, and subsystem refresh cycles. New production remains selective, focused on bridging capabilities aligned to next-generation platform roadmaps. Remanufacturing and depot recapitalization benefit from established industrial capacity and standardized kits, accelerating fielding timelines while managing sustainment risks. Upgrade-driven demand emphasizes survivability, network integration, and power generation improvements compatible with open-architecture electronics. Program sequencing reflects readiness mandates, unit rotation schedules, and depot throughput constraints, favoring phased upgrades that minimize operational disruption while sustaining availability across formations and prepositioned stocks.
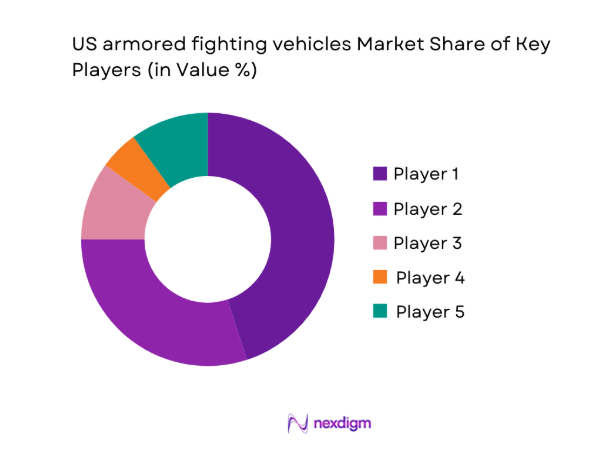
Competitive Landscape
The competitive landscape is characterized by platform integrators coordinating complex supply chains for armor, propulsion, electronics, and mission systems, with competition shaped by program awards, sustainment capacity, and compliance readiness. Long-term service capability and domestic manufacturing footprints influence positioning alongside delivery performance and lifecycle support depth.
| Company Name | Establishment Year | Headquarters | Formulation Depth | Distribution Reach | Regulatory Readiness | Service Capability | Channel Strength | Pricing Flexibility |
| General Dynamics Land Systems | 1952 | Sterling Heights, MI | ~ | ~ | ~ | ~ | ~ | ~ |
| BAE Systems Inc. | 1999 | Falls Church, VA | ~ | ~ | ~ | ~ | ~ | ~ |
| Oshkosh Defense | 1917 | Oshkosh, WI | ~ | ~ | ~ | ~ | ~ | ~ |
| AM General | 1961 | South Bend, IN | ~ | ~ | ~ | ~ | ~ | ~ |
| Leonardo DRS | 1969 | Arlington, VA | ~ | ~ | ~ | ~ | ~ | ~ |
US armored fighting vehicles Market Analysis
Growth Drivers
Increased funding for armored brigade combat team modernization
Sustained modernization of armored brigade combat teams accelerated between 2022 and 2025, driven by readiness mandates across 11 active brigades and 8 National Guard brigades. Annual rotations supported equipment refresh cycles for battalion sets numbering 58 platforms per brigade, with depot throughput expanding across 3 major sustainment facilities. Training center instrumentation upgrades across 2 maneuver centers increased digital integration requirements, while 24 combined exercises annually reinforced survivability and network interoperability needs. Congressional authorization cycles approved multiyear contracting authority in 2023, reducing program slippage. Force posture reviews in 2024 elevated prepositioned equipment sets across 6 locations, intensifying recapitalization tempo.
Replacement cycles for aging Bradley and Abrams fleets
Platform age profiles across Bradley and Abrams fleets reached service milestones between 2022 and 2025, with median hull ages exceeding 32 years for IFV variants and 36 years for MBT variants across active units. Depot-level reset cycles increased from 18 to 24 months per platform to address fatigue, corrosion, and obsolescence. Powerpack refurbishment capacity expanded at 2 organic depots, raising annual induction slots by 120 units. Field failure reports recorded 410 drivetrain incidents in 2024, prompting accelerated recapitalization schedules. Army materiel directives in 2025 prioritized turret electronics refresh for 9 brigade sets, aligning sustainment with readiness thresholds.
Challenges
High lifecycle cost and sustainment burden of heavy platforms
Sustainment complexity intensified from 2022 to 2025 as heavy platforms required higher maintenance man-hours per operating hour, averaging 19 in training environments and 27 during high-tempo rotations. Parts obsolescence affected 14 critical subsystems, with lead times extending beyond 180 days for specialized armor components. Depot workforce vacancies reached 9 percent in 2024, constraining throughput across 3 facilities. Fuel logistics burdens increased convoy requirements by 22 percent during multi-domain exercises, stressing support units. Environmental compliance inspections across 5 states imposed additional retrofit mandates for emissions controls, lengthening maintenance cycles and reducing fleet availability during peak training windows.
Long procurement cycles and budgetary uncertainties
Procurement lead times lengthened between 2022 and 2025 due to multistage approvals across 7 oversight bodies and extended testing requirements at 4 evaluation ranges. Contract award cycles averaged 14 months, delaying fielding schedules for brigade sets scheduled for rotation. Continuing resolutions in 2023 constrained obligation authority for 2 quarters, deferring component orders and disrupting supplier production planning. Engineering change proposals averaged 63 days for approval, slowing integration of protection and network upgrades. Program re-baselining in 2024 required revalidation of 5 performance thresholds, introducing schedule risk and complicating synchronized delivery across depots and unit training pipelines.
Opportunities
Next-generation combat vehicle development programs
Next-generation combat vehicle initiatives progressed from 2022 to 2025 through technology maturation at 3 proving grounds, with prototype test events totaling 126 mobility and survivability trials. Power and energy demonstrations achieved 20 percent endurance gains during 2024 cold-weather testing, supporting electrified subsystems integration. Open-architecture vetronics standards validated interoperability across 4 mission systems, accelerating modular upgrades. Soldier touchpoints involved 18 operational units providing feedback loops that shortened iteration cycles to 90 days. Institutional backing increased through 2 capability development documents approved in 2025, positioning scalable production pathways aligned to brigade modernization timelines and depot integration readiness.
Retrofit demand for active protection systems and digital vetronics
Active protection system retrofits expanded from 2022 to 2025 across 6 brigade sets, with 312 platforms instrumented for threat detection trials and 84 validated intercept events during live-fire exercises. Digital vetronics upgrades standardized data buses across 9 vehicle families, enabling faster integration of sensors and battle management systems. Cyber-hardening assessments conducted across 4 test ranges reduced vulnerability findings by 31 items per platform iteration. Fielding schedules synchronized with 2 major training center rotations annually, ensuring operational validation. Institutional guidance in 2025 endorsed modular retrofit kits, accelerating depot installations and minimizing operational downtime.
Future Outlook
Through 2035, the market is expected to track phased modernization roadmaps, aligning fleet refresh cycles with next-generation platform transitions. Emphasis on survivability, digital architectures, and energy resilience will shape procurement sequencing. Industrial base resilience and depot throughput will remain pivotal as platforms evolve alongside multi-domain operational concepts.
Major Players
- General Dynamics Land Systems
- BAE Systems Inc.
- Oshkosh Defense
- AM General
- Leonardo DRS
- Rheinmetall Vehicles LLC
- Elbit Systems of America
- L3Harris Technologies
- Honeywell Aerospace
- Curtiss-Wright Defense Solutions
- Northrop Grumman
- SAIC
- Teledyne FLIR Defense
- Raytheon Technologies
- Textron Systems
Key Target Audience
- US Department of Defense acquisition offices
- US Army Program Executive Offices
- US Marine Corps Systems Command
- State National Guard procurement directorates
- Defense depot and sustainment organizations
- Prime defense integrators and platform OEMs
- Tier-1 subsystem and electronics suppliers
- Investments and venture capital firms
Research Methodology
Step 1: Identification of Key Variables
Program roadmaps, fleet age profiles, depot throughput constraints, and platform upgrade pathways are mapped across operational units and sustainment hubs. Capability requirements, survivability standards, and digital architecture dependencies are scoped to define variable interdependencies.
Step 2: Market Analysis and Construction
Program-level procurement schedules, modernization pathways, and sustainment pipelines are synthesized with institutional planning cycles. Platform family mapping and subsystem upgrade cadence inform demand construction and scenario framing.
Step 3: Hypothesis Validation and Expert Consultation
Operational planners, depot engineers, and integration specialists validate assumptions on readiness drivers, integration feasibility, and sustainment bottlenecks. Iterative validation aligns analysis with fielding realities and institutional constraints.
Step 4: Research Synthesis and Final Output
Findings are consolidated into coherent narratives across procurement, sustainment, and capability evolution. Scenario implications are structured to support decision pathways for modernization sequencing and industrial base alignment.
- Executive Summary
- Research Methodology (Market Definitions and vehicle class taxonomy alignment, Primary interviews with US DoD program offices and defense integrators, Analysis of Army budget justifications and Congressional appropriations, Platform-level fleet tracking across ABCT and IBCT formations, Contract award and modernization program mapping, OEM shipment and backlog triangulation)
- Definition and Scope
- Market evolution
- Usage pathways across maneuver formations
- Ecosystem structure
- Supply chain and channel structure
- Regulatory and export control environment

- Growth Drivers
Increased funding for armored brigade combat team modernization
Replacement cycles for aging Bradley and Abrams fleets
Shift toward multi-domain operations requiring protected mobility
Heightened force protection requirements against anti-armor threats
Congressional support for domestic armored vehicle production
Interoperability upgrades aligned with NATO standards - Challenges
High lifecycle cost and sustainment burden of heavy platforms
Long procurement cycles and budgetary uncertainties
Supply chain constraints for armor steel and propulsion systems
Integration complexity of advanced sensors and active protection systems
Industrial base capacity limitations and workforce shortages
Regulatory and export compliance constraints impacting component sourcing - Opportunities
Next-generation combat vehicle development programs
Retrofit demand for active protection systems and digital vetronics
Hybrid-electric propulsion and fuel efficiency upgrades
Modular mission package adoption across fleets
Public-private partnerships for depot-level sustainment
Allied co-development and interoperability-driven upgrades - Trends
Digitization of armored platforms with open-architecture electronics
Adoption of active protection systems as standard fit
Increased use of autonomous and optionally manned capabilities
Weight reduction through advanced composite armor materials
Integration of networked battlefield management systems
Emphasis on survivability upgrades for urban combat environments - Government Regulations
- SWOT Analysis
- Stakeholder and Ecosystem Analysis
- Porter’s Five Forces Analysis
- Competition Intensity and Ecosystem Mapping
- By Value, 2020–2025
- By Volume, 2020–2025
- By Active Systems, 2020–2025
- By Average Selling Price, 2020–2025
- By Vehicle Type (in Value %)
Main battle tanks
Infantry fighting vehicles
Armored personnel carriers
Reconnaissance and scout vehicles
Mine-resistant ambush protected vehicles
Light armored vehicles - By Mobility and Weight Class (in Value %)
Tracked heavy platforms
Tracked medium platforms
Wheeled medium platforms
Wheeled light platforms - By Program Status (in Value %)
New production programs
Mid-life upgrades and modernization
Remanufactured and recapitalized platforms
Service life extension programs - By Application and Mission Role (in Value %)
Combined arms maneuver
Urban operations and force protection
Reconnaissance and surveillance
Command and control platforms
Combat support and engineering variants - By End User Branch (in Value %)
US Army
US Marine Corps
National Guard
Reserve components
- Market structure and competitive positioning
Market share snapshot of major players - Cross Comparison Parameters (Platform portfolio breadth, Program win rate, Active protection system integration capability, Domestic manufacturing footprint, Lifecycle sustainment capacity, R&D investment intensity, Compliance with US DoD standards, Delivery lead time performance)
- SWOT Analysis of Key Players
- Pricing and Commercial Model Benchmarking
- Detailed Profiles of Major Companies
General Dynamics Land Systems
BAE Systems Inc.
Oshkosh Defense
AM General
Textron Systems
Leonardo DRS
Rheinmetall Vehicles LLC
Elbit Systems of America
L3Harris Technologies
Honeywell Aerospace
Curtiss-Wright Defense Solutions
Northrop Grumman
SAIC
Teledyne FLIR Defense
Raytheon Technologies
- Demand and utilization drivers
- Procurement and tender dynamics
- Buying criteria and vendor selection
- Budget allocation and financing preferences
- Implementation barriers and risk factors
- Post-purchase service expectations
- By Value, 2026–2035
- By Volume, 2026–2035
- By Active Systems, 2026–2035
- By Average Selling Price, 2026–2035


 Request a Sample
 Ask for Customization
 Get a Quote
 Enquire Now