
 Download PDF
 Download PDF
Market Overview
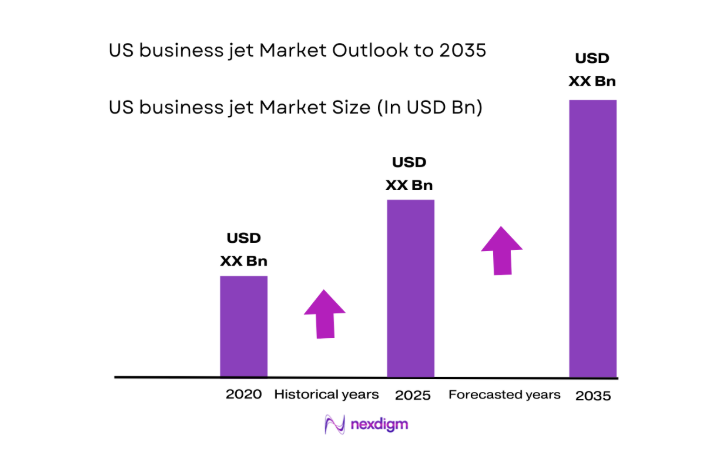
The US business jet market current size stands at around USD ~ million, reflecting sustained demand from corporate flight departments, high-net-worth individuals, and charter operators seeking time efficiency and network flexibility. Fleet renewal activity and upgrades to long-range platforms continue to shape procurement cycles, while completion centers and MRO ecosystems support lifecycle value creation. Transaction intensity across new deliveries and pre-owned exchanges sustains asset liquidity, reinforcing the market’s structural resilience amid evolving operating constraints and compliance requirements.
Operational concentration is strongest across major business corridors anchored by New York, Los Angeles, Dallas, Miami, Chicago, and San Francisco, supported by dense airport infrastructure and advanced FBO networks. Demand clusters around financial services, technology, energy, and healthcare hubs, where executive mobility and mission-critical travel are entrenched. The ecosystem benefits from mature completion centers, parts distribution networks, and maintenance clusters, reinforced by regulatory clarity, safety oversight, and consistent airspace management frameworks that enable dependable utilization.
Market Segmentation
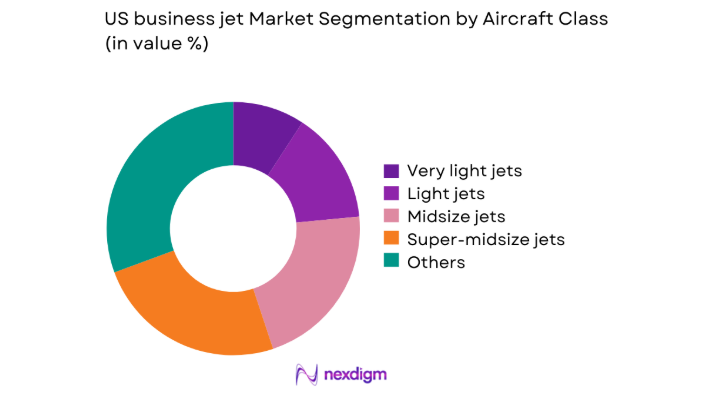
By Aircraft Class
Large cabin and ultra-long-range platforms dominate value concentration due to extended range capability, intercontinental non-stop missions, and premium cabin configurations demanded by corporate and principal travel. Super-midsize aircraft retain strong relevance for coast-to-coast connectivity, while light and very light jets remain integral for short-haul regional missions and charter fleets optimizing turnaround. Fleet mix decisions are shaped by operating profiles, runway access constraints, crew duty cycles, and connectivity requirements. Buyers increasingly prioritize platform versatility, cabin productivity, and upgrade pathways, leading to higher specification adoption across avionics, connectivity, and interior completion standards within higher-value segments.
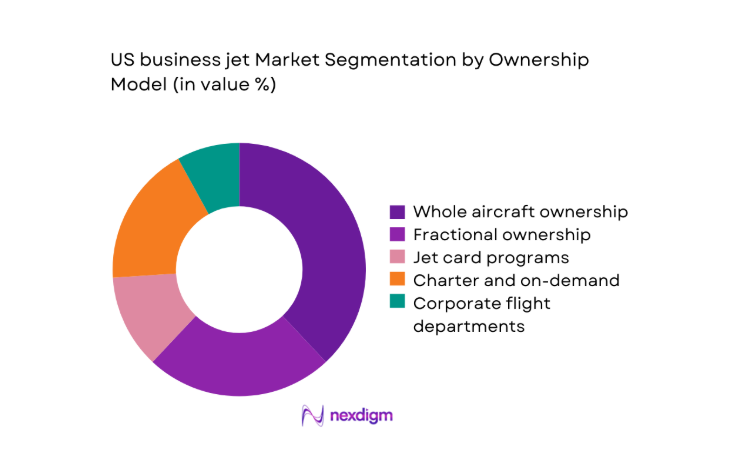
By Ownership Model
Whole aircraft ownership remains dominant for corporates requiring schedule control, data security, and bespoke cabin configurations. Fractional ownership and jet cards continue to expand among executives seeking access flexibility and predictable utilization without full operational burden. Charter operators benefit from network density and fleet standardization, enabling dynamic scheduling and route optimization. Corporate flight departments leverage managed services to optimize crew, maintenance planning, and compliance oversight. Decision frameworks weigh utilization intensity, mission variability, tax treatment, and balance sheet considerations, with hybrid access models increasingly adopted to optimize cost exposure and availability across peak demand periods.
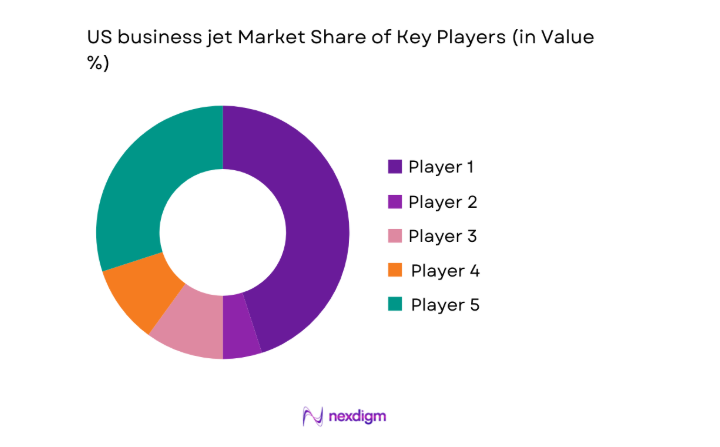
Competitive Landscape
The competitive landscape is shaped by OEM platform breadth, completion depth, aftermarket coverage, and service network density across major US aviation corridors. Differentiation centers on delivery lead times, reliability records, customization capability, and lifecycle support integration across MRO, parts distribution, and connectivity upgrades.
| Company Name | Establishment Year | Headquarters | Formulation Depth | Distribution Reach | Regulatory Readiness | Service Capability | Channel Strength | Pricing Flexibility |
| Gulfstream Aerospace | 1958 | Savannah, Georgia | ~ | ~ | ~ | ~ | ~ | ~ |
| Bombardier Aerospace | 1942 | Montreal, Quebec | ~ | ~ | ~ | ~ | ~ | ~ |
| Textron Aviation | 2014 | Wichita, Kansas | ~ | ~ | ~ | ~ | ~ | ~ |
| Embraer Executive Jets | 1969 | São José dos Campos, Brazil | ~ | ~ | ~ | ~ | ~ | ~ |
| Dassault Aviation | 1929 | Paris, France | ~ | ~ | ~ | ~ | ~ | ~ |
US business jet Market Analysis
Growth Drivers
Rising corporate travel efficiency requirements
Corporate travel efficiency requirements continue rising as executives prioritize time compression across multi-city itineraries within compressed schedules. In 2024, FAA towered airport movements exceeded 42000000, reflecting congestion pressure at primary hubs, while business aviation flights supported schedule certainty. In 2025, US listed companies reported 180 board meetings per quarter on average, sustaining demand for direct access to secondary airports exceeding 5000 facilities nationwide. The Bureau of Transportation Statistics recorded 720 nonstop city pairs underserved by commercial carriers in 2024, reinforcing private access value. Expanding regional corporate campuses across Texas, Florida, and Arizona increased mission frequency, strengthening utilization resilience.
Time-sensitive executive mobility needs
Time-sensitive executive mobility needs intensified as supply chains diversified and executive oversight expanded across distributed operations. In 2024, US industrial production index readings averaged 102 across manufacturing months, requiring rapid site access for compliance and quality audits. The Department of Energy reported 2100 critical energy facilities nationwide in 2025, many distant from hub airports, elevating point-to-point travel necessity. In 2024, federal inspection cycles for infrastructure programs exceeded 48000 site visits, reinforcing demand for flexible access. Increased merger integrations across technology and healthcare created multi-state leadership itineraries, supporting frequent, short-notice missions across secondary airports.
Challenges
High acquisition and operating costs
High acquisition and operating costs constrain fleet expansion amid inflationary pressure on inputs and services. In 2024, the Producer Price Index for aircraft parts averaged 238, while scheduled maintenance events increased with aging fleets exceeding 24 years average age. The FAA reported 3200 certified repair stations in 2025, creating competition for scarce labor, as licensed A&P mechanics numbered 290000 in 2024, with retirements accelerating. Hangar space constraints across 35 major metropolitan airports limited basing options, increasing ferry distances and downtime. Financing approvals tightened as commercial lending standards index readings reached 55 in 2024.
Volatile fuel prices and operating expense inflation
Volatile fuel prices and operating expense inflation elevate planning uncertainty for operators and charter networks. In 2024, US refinery utilization averaged 92, amplifying sensitivity to outages during peak travel seasons. The Energy Information Administration recorded 120 weather-related disruptions affecting regional supply in 2025, increasing variability in procurement logistics. Crew compensation pressures rose as pilot certificates issued annually fell to 18000 in 2024, while training throughput capacity remained constrained by 1200 approved simulators nationwide. Airport fee adjustments across 60 large commercial service airports in 2024 increased landing and handling charges, compressing operator margins and scheduling flexibility.
Opportunities
Sustainable aviation fuel adoption and incentives
Sustainable aviation fuel adoption and incentives present a near-term pathway to decarbonization while preserving operational performance. In 2024, ASTM approved 7 SAF pathways for jet fuel blending, enabling compatibility across existing turbine platforms. The Environmental Protection Agency certified 85 production facilities nationwide in 2025 to supply low-carbon fuels for aviation-adjacent logistics. In 2024, 54 US airports offered SAF availability, expanding to 76 in 2025 through public–private logistics programs. Federal clean fuel standards aligned with 2030 emissions benchmarks, creating procurement certainty for operators integrating SAF into routine uplift schedules.
Next-generation avionics and connectivity upgrades
Next-generation avionics and connectivity upgrades unlock productivity gains through real-time weather routing, compliance automation, and cabin connectivity. In 2024, the FAA NextGen program deployed 19 new performance-based navigation procedures across high-density airspace, reducing reroute frequency. The FCC authorized 4 additional Ka-band satellite constellations in 2025, expanding bandwidth availability for in-flight applications. In 2024, 68 percent of Part 135 operators reported integrating predictive maintenance platforms, supported by 140 approved avionics STCs nationwide. Enhanced data links improved dispatch reliability across 240 high-traffic secondary airports, supporting tighter scheduling and improved utilization.
Future Outlook
The outlook through 2035 reflects sustained fleet modernization, deeper penetration of long-range platforms, and wider adoption of connectivity and sustainability initiatives. Regulatory clarity, infrastructure investments at secondary airports, and expanding managed services models are expected to reinforce utilization resilience. OEM backlog management and completion capacity will shape delivery cadence across the period.
Major Players
- Gulfstream Aerospace
- Bombardier Aerospace
- Textron Aviation
- Embraer Executive Jets
- Dassault Aviation
- Honda Aircraft Company
- Cirrus Aircraft
- Pilatus Aircraft
- Piper Aircraft
- L3Harris Technologies
- StandardAero
- Jet Aviation
- Gama Aviation
- Wheels Up
- NetJets
Key Target Audience
- Corporate flight departments
- Charter and on-demand operators
- Fractional ownership program managers
- High-net-worth individuals and family offices
- Aircraft leasing and asset management firms
- Investments and venture capital firms
- Federal Aviation Administration and Department of Transportation
- State aviation authorities and airport commissions
Research Methodology
Step 1: Identification of Key Variables
Key variables were defined across fleet composition, mission profiles, utilization intensity, infrastructure access, and regulatory compliance requirements. Demand drivers were mapped to regional business corridors and secondary airport accessibility. Supply-side capacity indicators included completion throughput, MRO coverage, and workforce availability.
Step 2: Market Analysis and Construction
The analytical framework integrated fleet lifecycle stages, delivery pipelines, retrofit cycles, and utilization dynamics. Scenario construction incorporated infrastructure readiness, airspace modernization milestones, and SAF availability. Cross-regional corridor mapping assessed access to secondary airports and FBO network density.
Step 3: Hypothesis Validation and Expert Consultation
Operational assumptions were validated through structured consultations with operators, maintenance leaders, and completion specialists. Regulatory alignment was cross-checked against certification pathways and airspace modernization programs. Utilization patterns were stress-tested against congestion metrics and crew availability indicators.
Step 4: Research Synthesis and Final Output
Findings were synthesized into coherent demand, supply, and ecosystem narratives. Scenario implications were translated into actionable insights for operators, lessors, and service providers. Outputs were quality-checked for internal consistency and regulatory alignment.
- Executive Summary
- Research Methodology (Market Definitions and fleet classification standards, OEM production and backlog tracking, FAA registry and airworthiness data analysis, charter and fractional fleet utilization surveys, operator and completion center interviews, aircraft delivery and retirement modeling, pricing and transaction benchmark analysis)
- Definition and Scope
- Market evolution
- Usage and mission profiles
- Ecosystem structure
- Supply chain and channel structure
- Regulatory environment

- Growth Drivers
Rising corporate travel efficiency requirements
Time-sensitive executive mobility needs
Expansion of on-demand charter and jet card programs
Fleet replacement cycles for aging business jets
Increased demand for non-stop long-range connectivity
Operational resilience preferences post-disruption - Challenges
High acquisition and operating costs
Volatile fuel prices and operating expense inflation
Pilot shortages and training bottlenecks
Supply chain constraints for avionics and components
Airspace congestion and slot availability at major hubs
Increasing regulatory compliance costs - Opportunities
Sustainable aviation fuel adoption and incentives
Next-generation avionics and connectivity upgrades
Fleet modernization toward fuel-efficient platforms
Growth in regional business hubs and secondary airports
Managed services and outsourced flight department models
Premium charter growth for experiential travel - Trends
Shift toward ultra-long-range and large cabin jets
Increased cabin connectivity and digitalization
Rising retrofit and refurbishment demand
Growth of hybrid ownership and flexible access models
Emphasis on sustainability reporting by operators
Data-driven maintenance and predictive analytics adoption - Government Regulations
- SWOT Analysis
- Stakeholder and Ecosystem Analysis
- Porter’s Five Forces Analysis
- Competition Intensity and Ecosystem Mapping
- By Value, 2020–2025
- By Shipment Volume, 2020–2025
- By Active Fleet, 2020–2025
- By Average Selling Price, 2020–2025
- By Aircraft Class (in Value %)
Light jets
Very light jets
Midsize jets
Super-midsize jets
Large cabin jets
Ultra-long-range jets - By Ownership Model (in Value %)
Whole aircraft ownership
Fractional ownership
Jet card programs
Charter and on-demand
Corporate flight departments - By End Use (in Value %)
Corporate and enterprise travel
High-net-worth individual travel
Charter and air taxi operations
Government and special mission
Medical and emergency services - By Range Capability (in Value %)
Short-range
Medium-range
Long-range
Ultra-long-range - By Cabin Configuration (in Value %)
Standard executive cabin
High-density shuttle configuration
VIP and head-of-state configuration
Medical evacuation configuration
- Market structure and competitive positioning
Market share snapshot of major players - Cross Comparison Parameters (product portfolio breadth, delivery lead times, range and payload performance, total cost of ownership, after-sales service coverage, global MRO network strength, customization and completion capabilities, financing and leasing options)
- SWOT Analysis of Key Players
- Pricing and Commercial Model Benchmarking
- Detailed Profiles of Major Companies
Gulfstream Aerospace
Bombardier Aerospace
Textron Aviation
Embraer Executive Jets
Dassault Aviation
Honda Aircraft Company
Cirrus Aircraft
Pilatus Aircraft
Piper Aircraft
L3Harris Technologies
StandardAero
Jet Aviation
Gama Aviation
Wheels Up
NetJets
- Demand and utilization drivers
- Procurement and tender dynamics
- Buying criteria and vendor selection
- Budget allocation and financing preferences
- Implementation barriers and risk factors
- Post-purchase service expectations
- By Value, 2026–2035
- By Shipment Volume, 2026–2035
- By Active Fleet, 2026–2035
- By Average Selling Price, 2026–2035


 Request a Sample
 Ask for Customization
 Get a Quote
 Enquire Now