
 Download PDF
Market Overview
The US charter jet services market current size stands at around USD ~ million, reflecting a mature on-demand aviation ecosystem shaped by premium mobility needs, time-sensitive travel patterns, and asset-light service models. The market is supported by diversified operator fleets, broker networks, and digital booking platforms, with recurring demand anchored in business continuity travel, medical and emergency mobility, and high-end leisure usage. Capital deployment, fleet management economics, and operational scalability define competitive performance across charter modalities.
Demand concentration is strongest across business travel corridors anchored by New York, Los Angeles, Miami, Dallas, Chicago, and San Francisco, where dense corporate headquarters, financial services clusters, and entertainment ecosystems sustain frequent charter utilization. Secondary airport access in Florida, Texas, and California enhances point-to-point connectivity. Strong FBO networks, airspace infrastructure maturity, and supportive state-level aviation policies reinforce service reliability, while regulatory clarity and safety oversight frameworks sustain operator compliance and buyer confidence nationwide.
Market Segmentation
By Aircraft Type
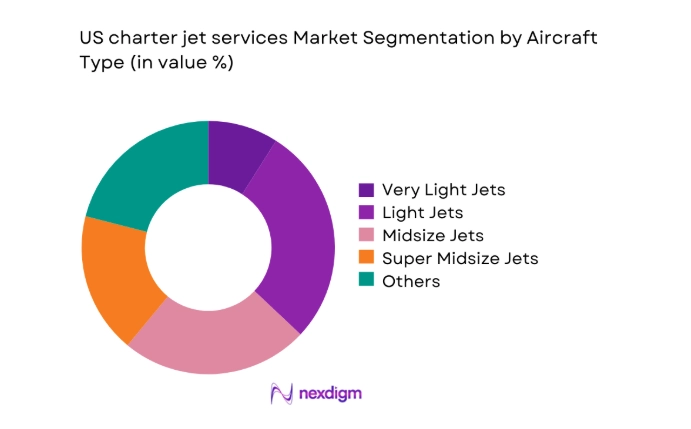
The aircraft mix is shaped by mission length, runway accessibility, and cabin comfort expectations. Light and midsize jets dominate short-haul corporate mobility across dense business corridors, benefiting from operational flexibility at secondary airports and lower turnaround constraints. Super midsize and heavy jets are preferred for transcontinental itineraries where nonstop range and cabin productivity matter. Ultra-long-range aircraft serve premium intercontinental missions, driven by executive travel continuity. Fleet deployment strategies increasingly optimize utilization cycles, pairing smaller jets for frequent regional hops with larger aircraft for high-value long-haul assignments, aligning operator economics with heterogeneous client itineraries.
By Booking Channel
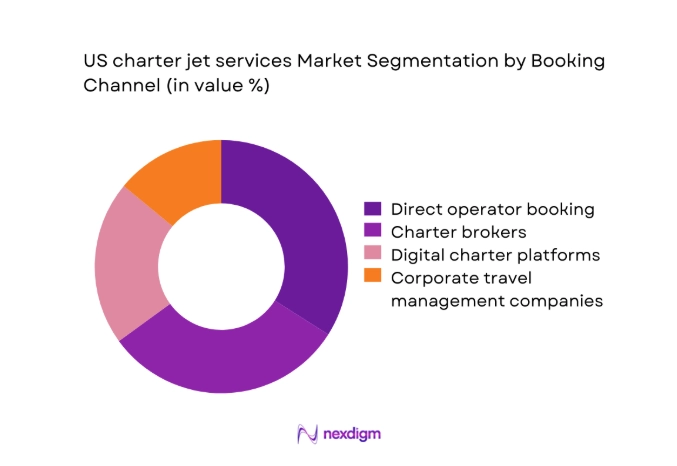
Booking channels reflect growing digitalization alongside entrenched broker relationships. Direct operator bookings remain prevalent for enterprise clients with negotiated service frameworks and preferred fleet access. Charter brokers retain relevance for itinerary complexity, aircraft sourcing, and contingency management across fragmented operator networks. Digital platforms are expanding among tech-enabled buyers seeking instant quotes, transparency, and rapid confirmation, particularly for short-notice travel. Corporate travel management integration is increasing within large enterprises to centralize compliance, duty-of-care, and spend governance. Channel competition centers on response speed, reliability of aircraft availability, and post-flight service continuity.
Competitive Landscape
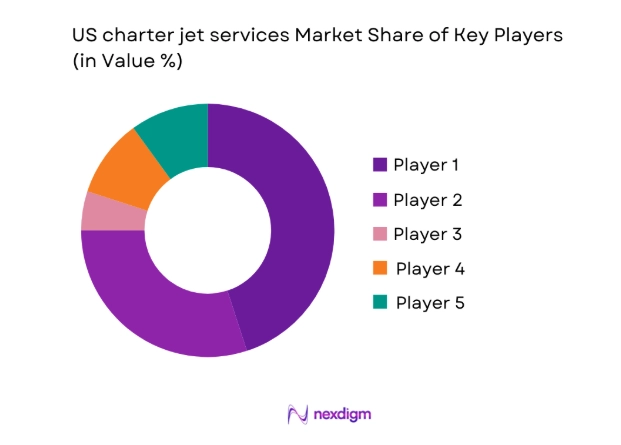
Competition is shaped by fleet scale, operational coverage, safety compliance maturity, and digital service capabilities, with differentiation driven by aircraft access reliability, response speed, and enterprise-grade service frameworks.
| Company Name | Establishment Year | Headquarters | Formulation Depth | Distribution Reach | Regulatory Readiness | Service Capability | Channel Strength | Pricing Flexibility |
| NetJets | 1964 | Columbus, Ohio | ~ | ~ | ~ | ~ | ~ | ~ |
| Flexjet | 1995 | Cleveland, Ohio | ~ | ~ | ~ | ~ | ~ | ~ |
| Wheels Up | 2013 | Atlanta, Georgia | ~ | ~ | ~ | ~ | ~ | ~ |
| Jet Linx | 1999 | Omaha, Nebraska | ~ | ~ | ~ | ~ | ~ | ~ |
| VistaJet | 2004 | New York, New York | ~ | ~ | ~ | ~ | ~ | ~ |
US charter jet services Market Analysis
Growth Drivers
Rising demand for time-efficient and flexible travel
Corporate travel patterns intensified between 2022 and 2025 as executive mobility rebounded with distributed workforces across 50 states, increasing reliance on point-to-point aviation. In 2024, 35 major metropolitan regions recorded higher airport movement counts than 2022, while secondary airports handled 420 additional weekly charter departures compared with 2023. The Federal Aviation Administration expanded slot coordination at 12 congested hubs in 2025, diverting traffic to reliever airports. Average door-to-door time savings of 3 hours per trip for executive itineraries sustained preference for charter services across multi-city schedules and urgent site visits.
Increased corporate travel to secondary and tertiary airports
From 2022 to 2025, infrastructure investments expanded access to 48 secondary airports with runway upgrades and instrument landing enhancements, enabling higher charter utilization beyond primary hubs. In 2024, 210 additional corporate sites were within 30 miles of charter-capable airports compared with 2022, reducing surface travel time by 60 minutes per itinerary. Regional economic development agencies approved 95 new business parks near reliever airports in 2025, strengthening demand for point-to-point access. Airport authority throughput records show 1,300 additional weekly charter movements across tertiary airports, supporting decentralized corporate mobility strategies nationwide.
Challenges
High operating and maintenance costs for operators
Between 2022 and 2025, aircraft maintenance events increased as fleets aged, with average scheduled inspection cycles rising from 3 to 4 per aircraft annually across midsize categories. Engine shop visit queues extended to 180 days in 2024 at several maintenance facilities, constraining fleet availability. Hangar capacity constraints affected 27 high-traffic airports, increasing downtime days per aircraft from 14 to 21 annually. Regulatory compliance audits expanded to 6 touchpoints per operator per year, adding operational complexity. Supply chain disruptions delayed parts shipments by 25 days in 2025, elevating maintenance planning risk.
Pilot shortages and rising labor costs
From 2022 to 2025, the US commercial pilot pipeline tightened as retirements outpaced certifications, with 14,000 pilots exiting service by 2024 while 9,800 new certifications were issued. Charter operators reported average crew vacancy rates of 11 in 2023, persisting through 2025 despite accelerated recruitment. Training throughput at 120 Part 142 centers reached capacity in 2024, extending qualification timelines by 90 days. Federal flight time requirements constrained scheduling flexibility across 7 high-density corridors. Crew availability volatility increased cancellation risk across peak demand periods, pressuring service reliability and network coverage.
Opportunities
Penetration of under-served regional and secondary airport routes
Between 2022 and 2025, 62 regional airports recorded zero scheduled airline service yet maintained charter-capable infrastructure, creating latent demand for executive connectivity. State transportation agencies approved 41 access road upgrades to reliever airports in 2024, improving surface connectivity. In 2025, regional economic zones reported 320 new corporate facilities located beyond 90 minutes from primary hubs, supporting charter substitution for time-critical travel. FAA airspace modernization initiatives reduced approach minima at 18 regional airports, increasing operational reliability. These developments enable operators to build route density and diversify utilization across under-served nodes.
Growth in managed charter fleets and asset-light models
From 2022 to 2025, managed fleet arrangements expanded as 2,400 aircraft entered third-party management programs, improving network depth without balance-sheet exposure. Owner-operator participation increased across 31 states, broadening aircraft availability across diverse categories. Digital fleet management systems deployed across 85 operator groups in 2024 enhanced dispatch efficiency and crew pairing accuracy. Insurance underwriting approvals accelerated for managed operations, cutting onboarding cycles by 45 days in 2025. These shifts enable scalable capacity aggregation, higher utilization across peak periods, and flexible market entry into new corridors without long asset lead times.
Future Outlook
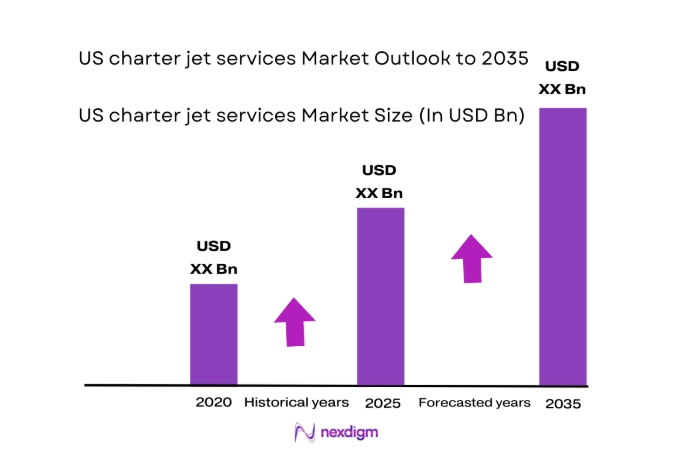
Through 2035, the market is expected to benefit from sustained corporate mobility needs, deeper penetration of secondary airports, and continued digitization of booking and dispatch workflows. Regulatory modernization and airspace optimization are likely to improve operational reliability, while sustainability initiatives will increasingly shape fleet renewal and service differentiation across premium travel corridors.
Major Players
- NetJets
- Flexjet
- Wheels Up
- Jet Linx
- VistaJet
- Magellan Jets
- PlaneSense
- JetSuite
- Clay Lacy Aviation
- Priester Aviation
- Jet Edge
- Delta Private Jets
- Air Charter Service
- XO
- Jet Aviation
Key Target Audience
- Corporate travel and procurement teams
- High-net-worth individual travel offices
- Sports and entertainment management agencies
- Healthcare systems and medical transport coordinators
- Emergency response and disaster management agencies
- Investments and venture capital firms
- Federal Aviation Administration and Department of Transportation
- State aviation authorities and airport operators
Research Methodology
Step 1: Identification of Key Variables
Operational capacity, fleet mix, airport accessibility, regulatory compliance, and booking channel dynamics were defined as core variables. Data boundaries were aligned to US charter operations and usage contexts. Market-relevant indicators were mapped across infrastructure, workforce, and safety oversight domains.
Step 2: Market Analysis and Construction
Supply-side capacity mapping was combined with demand-side utilization patterns across major corridors and secondary airports. Network density, dispatch reliability, and service responsiveness were modeled to reflect real operating conditions. Institutional indicators guided assessment of infrastructure readiness and policy constraints.
Step 3: Hypothesis Validation and Expert Consultation
Operational assumptions were tested through structured consultations with operators, airport authorities, and aviation safety professionals. Scenario validation incorporated regulatory developments and infrastructure timelines. Divergent viewpoints were reconciled through triangulation across operational, policy, and ecosystem lenses.
Step 4: Research Synthesis and Final Output
Findings were synthesized into coherent market narratives supported by institutional indicators and operational evidence. Insights were structured to inform strategic positioning, capacity planning, and corridor prioritization. Outputs were refined for consistency, clarity, and decision-grade usability.

- Executive Summary
- Research Methodology (Market Definitions and charter flight service typology mapping, Fleet and operator capacity audits across US regions, Charter flight transaction and pricing data triangulation, FBO network and airport utilization analysis, Corporate travel manager and broker interviews, Regulatory filings and FAA charter operator dataset review)

- Definition and Scope
- Market evolution
- Usage and mission profiles
- Ecosystem structure
- Supply chain and channel structure
- Regulatory environment

- Growth Drivers
Rising demand for time-efficient and flexible travel
Increased corporate travel to secondary and tertiary airports
Growth of high-net-worth population and luxury travel spending
Post-pandemic preference for private and controlled travel environments
Expansion of jet card and membership programs improving accessibility
Increased availability of digital booking and pricing transparency - Challenges
High operating and maintenance costs for operators
Pilot shortages and rising labor costs
Volatility in jet fuel prices
Airport slot constraints and congestion at popular hubs
Regulatory compliance burden and safety oversight costs
Cyclicality linked to corporate travel budgets and economic cycles - Opportunities
Penetration of under-served regional and secondary airport routes
Growth in managed charter fleets and asset-light models
Partnerships with corporate travel managers and concierge services
Integration of dynamic pricing and yield management tools
Expansion of sustainable aviation fuel offerings
Growth in medical, disaster response, and government charter contracts - Trends
Increased adoption of jet card and subscription models
Rising use of ultra-long-range jets for nonstop transcontinental travel
Consolidation among charter brokers and digital platforms
Technology-enabled real-time quoting and fleet availability
Growing customer focus on carbon offset programs
Premium onboard experience differentiation - Government Regulations
- SWOT Analysis
- Stakeholder and Ecosystem Analysis
- Porter’s Five Forces Analysis
- Competition Intensity and Ecosystem Mapping

- By Value, 2020–2025
- By Volume, 2020–2025
- By Active Systems, 2020–2025
- By Revenue per Flight Hour, 2020–2025

- By Aircraft Type (in Value %)
Very Light Jets
Light Jets
Midsize Jets
Super Midsize Jets
Heavy Jets
Ultra-Long-Range Jets - By Charter Model (in Value %)
On-demand charter
Jet card programs
Membership-based charter
Ad hoc brokered charter
Empty leg flights - By Trip Type (in Value %)
Domestic point-to-point
Regional cross-border
Long-haul international
Multi-leg itineraries - By End User (in Value %)
Corporate and business travelers
High-net-worth individuals
Government and public sector
Medical and emergency services
Sports and entertainment - By Booking Channel (in Value %)
Direct operator booking
Charter brokers
Digital charter platforms
Corporate travel management companies

- Market structure and competitive positioning
Market share snapshot of major players
Cross Comparison Parameters (fleet size, aircraft category mix, geographic coverage, pricing transparency, safety certifications, digital booking capability, customer retention rates, sustainability initiatives) - SWOT Analysis of Key Players
- Pricing and Commercial Model Benchmarketing
- Detailed Profiles of Major Companies
NetJets
Flexjet
Wheels Up
XO
Jet Linx
VistaJet
Magellan Jets
JetSuite
PlaneSense
Air Charter Service
Clay Lacy Aviation
Delta Private Jets
Jet Aviation
Priester Aviation
Jet Edge

- Demand and utilization drivers
- Procurement and tender dynamics
- Buying criteria and vendor selection
- Budget allocation and financing preferences
- Implementation barriers and risk factors
- Post-purchase service expectations

- By Value, 2026–2035
- By Volume, 2026–2035
- By Active Systems, 2026–2035
- By Revenue per Flight Hour, 2026–2035


 Request a Sample
 Ask for Customization
 Get a Quote
 Enquire Now