
 Download PDF
 Download PDF
Market Overview
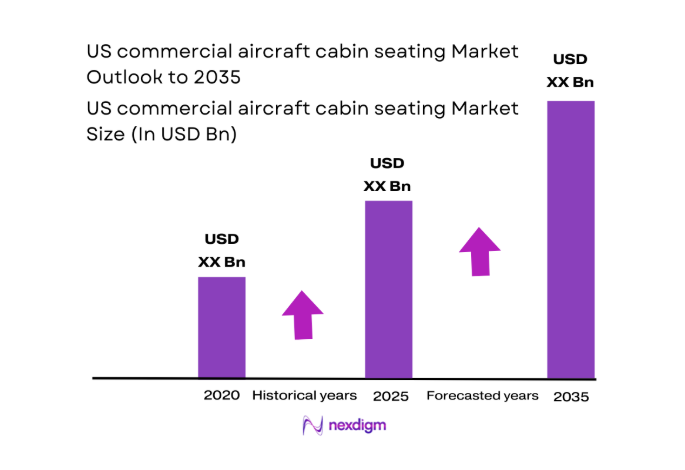
The US commercial aircraft cabin seating market current size stands at around USD ~ million, reflecting sustained replacement cycles driven by fleet utilization intensity and configuration refresh needs. Procurement momentum is shaped by airline branding programs, evolving cabin density strategies, and weight-optimization mandates that favor lightweight seating architectures. Demand concentrates around linefit programs aligned with narrowbody deliveries and retrofit programs tied to cabin refresh cycles, while aftermarket support and certification readiness continue to influence supplier selection and contract stability.
Demand concentrates around major aviation hubs and airline operational centers where fleet planning, engineering, and MRO ecosystems are mature. Infrastructure density around aircraft assembly sites, certified modification centers, and supplier clusters supports faster certification workflows and logistics coordination. Policy frameworks governing certification and continued airworthiness shape adoption timelines, while the maturity of local engineering talent pools accelerates customization programs. Concentrated airline headquarters and network planning offices also centralize procurement decisions and long-term fleet configuration strategies.
Market Segmentation
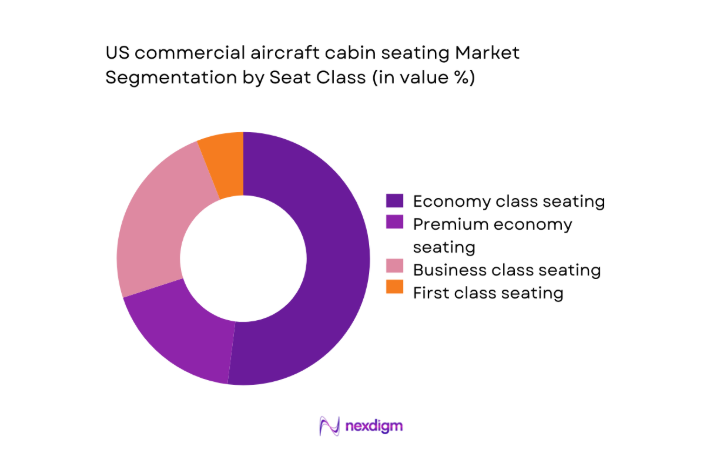
By Seat Class
Premium cabins dominate value contribution due to higher engineering content, certification complexity, and customization depth across recline mechanisms, privacy shells, and integrated power architectures. Business and premium economy classes absorb disproportionate program resources because airlines deploy them as revenue differentiators on trunk routes. Economy class remains volume-led, but value share is constrained by commoditization pressures and standardization across narrowbody fleets. The shift toward densified layouts increases seat counts per aircraft, yet value concentration persists in premium programs tied to brand refresh cycles and cabin consistency mandates across fleets.
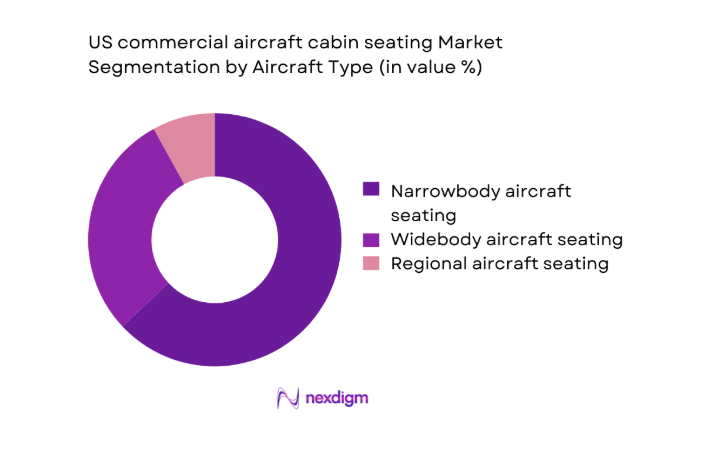
By Aircraft Type
Narrowbody aircraft dominate seating demand in the US due to high-frequency domestic operations, rapid fleet renewal, and standardized cabin layouts that accelerate linefit and retrofit cycles. Short-haul utilization intensifies wear rates, increasing replacement frequency and driving recurring retrofit programs. Widebody seating contributes higher per-shipset value through premium configurations and monument integration but is constrained by lower delivery volumes and longer refresh intervals. Regional aircraft seating remains niche, shaped by network optimization and scope clause dynamics that limit configuration complexity and cabin investment intensity.
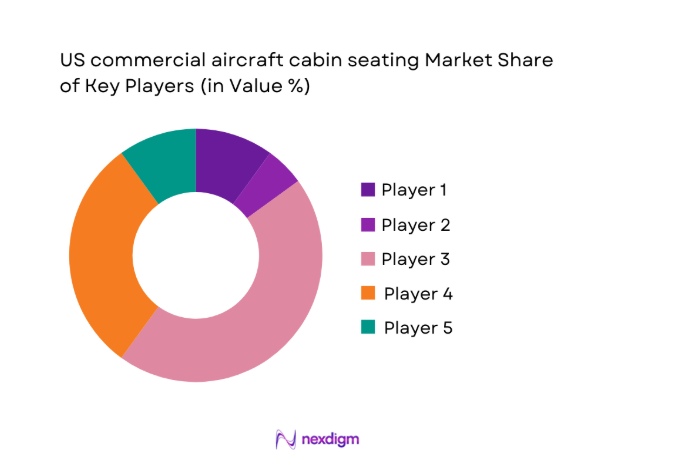
Competitive Landscape
The competitive environment is shaped by certification depth, integration capability with cabin systems, and program execution reliability across linefit and retrofit cycles. Differentiation centers on lightweight structures, modularity, and delivery performance under volatile OEM schedules and airline refresh programs.
| Company Name | Establishment Year | Headquarters | Formulation Depth | Distribution Reach | Regulatory Readiness | Service Capability | Channel Strength | Pricing Flexibility |
| Safran Seats | 1905 | France | ~ | ~ | ~ | ~ | ~ | ~ |
| Collins Aerospace | 2018 | United States | ~ | ~ | ~ | ~ | ~ | ~ |
| Recaro Aircraft Seating | 1972 | Germany | ~ | ~ | ~ | ~ | ~ | ~ |
| ZIM Aircraft Seating | 1990 | Israel | ~ | ~ | ~ | ~ | ~ | ~ |
| Thompson Aero Seating | 2006 | United Kingdom | ~ | ~ | ~ | ~ | ~ | ~ |
US commercial aircraft cabin seating Market Analysis
Growth Drivers
Fleet renewal programs by US airlines
US airlines accelerated narrowbody fleet renewal with 2024 deliveries of 812 aircraft and 2025 deliveries of 874 aircraft, expanding linefit seat demand across high-utilization routes. Average aircraft age fell to 11.4 years in 2024 from 12.1 in 2022, increasing configuration standardization needs. FAA records show 3,462 supplemental type certificates approved during 2023–2025, enabling faster cabin reconfiguration. Domestic passenger enplanements reached 746,000,000 in 2024, raising utilization cycles and wear rates. OEM production rates rose from 38 to 50 units monthly during 2022–2025, tightening integration timelines and increasing program volume.
Cabin densification and yield optimization strategies
Airlines increased average narrowbody seat counts from 159 in 2022 to 165 in 2025, reflecting densification strategies to improve yield per departure. Stage length averaged 1,120 miles in 2024, intensifying comfort-performance tradeoffs in seat selection. FAA cabin safety directives issued 17 updates during 2022–2025, driving redesign of seat structures and flammability compliance. Load factors averaged 84 in 2024, amplifying pressure on turnaround efficiency and durability specifications. Network planners added 128 domestic city pairs in 2025, increasing configuration harmonization across subfleets and accelerating standardized seat procurement cycles.
Challenges
Lengthy FAA certification and STC approval timelines
Certification queues expanded as FAA engineering staff processed 1,148 cabin-related submissions in 2024, extending average approval timelines to 214 days from 176 in 2022. Design data packages grew to 3,200 pages per program in 2025, increasing documentation burden. Conformity inspections per program rose from 4 to 7 during 2022–2025, adding schedule risk. Aircraft modification downtime averaged 9 days in 2024, constraining retrofit throughput at certified centers. Concurrent airworthiness directives increased to 26 items affecting seats and restraint systems, complicating change incorporation and rework cycles.
Supply chain constraints in aerospace-grade materials
Titanium mill lead times extended to 28 weeks in 2024 from 16 in 2022, delaying frame fabrication. Composite prepreg delivery reliability fell to 86 on-time shipments in 2025, disrupting seat shell production. Certified fastener availability tightened as approved vendors declined from 14 to 9 during 2022–2025, concentrating risk. Logistics transit times averaged 21 days in 2024 due to port congestion. Quality escape rates reached 3.1 incidents per 10,000 components in 2025, driving reinspection loads and increasing program schedule volatility across linefit commitments.
Opportunities
Accelerated narrowbody deliveries for domestic networks
Domestic network growth added 94 routes in 2024 and 121 in 2025, expanding narrowbody deployment across high-frequency corridors. Airport gate utilization reached 0.78 in 2024, incentivizing quick-turn operations that favor modular seat designs enabling faster maintenance cycles. FAA production approvals increased to 67 in 2025, improving throughput predictability for linefit programs. Maintenance intervals shortened from 750 to 680 flight cycles during 2022–2025, elevating replacement cadence. Engineering change incorporation averaged 42 days in 2025, enabling faster configuration updates aligned with branding refresh schedules.
Premium economy seat penetration growth
Premium economy cabins expanded from 38 percent of long-haul aircraft in 2022 to 52 in 2025, reflecting product segmentation strategies. Average pitch increased by 2 inches across premium economy during 2024–2025, driving demand for redesigned mechanisms and shells. Passenger complaints related to legroom fell by 14 incidents per 100,000 enplanements in 2025, validating comfort-led investments. IFE integration rates in premium economy rose from 61 to 79 during 2022–2025, increasing interface requirements. Retrofit downtime optimization reduced changeover windows to 6 days in 2025, improving program feasibility.
Future Outlook
Through 2035, airlines will continue aligning cabin strategies with domestic network growth, operational resilience, and sustainability commitments. Narrowbody-led fleet strategies will favor modular, lightweight seating with faster certification pathways. Premium segmentation will deepen on trunk routes, while digital configuration management shortens refresh cycles. Regulatory harmonization and supplier localization are expected to improve delivery reliability across linefit and retrofit programs.
Major Players
- Safran Seats
- Collins Aerospace
- Recaro Aircraft Seating
- ZIM Aircraft Seating
- Thompson Aero Seating
- Jamco Corporation
- Geven
- HAECO Cabin Solutions
- Lufthansa Technik
- Aviointeriors
- Expliseat
- STELIA Aerospace
- Molon Labe Seating
- Mirus Aircraft Seating
- Pitch Aircraft Seating Systems
Key Target Audience
- Commercial airlines and fleet planning departments
- Aircraft OEM program management teams
- Certified MRO and cabin modification centers
- Tier-1 and tier-2 aerospace component integrators
- Leasing companies and asset managers
- Investments and venture capital firms
- Federal Aviation Administration and Department of Transportation
- Airline procurement and supply chain organizations
Research Methodology
Step 1: Identification of Key Variables
Program variables were defined across seat class, aircraft type, fitment pathways, and certification dependencies. Technical attributes included weight, modularity, and interface requirements with cabin systems. Operational variables captured utilization intensity and maintenance cycles. Regulatory variables addressed airworthiness, flammability, and restraint compliance.
Step 2: Market Analysis and Construction
Demand was constructed from fleet renewal schedules, delivery backlogs, and retrofit cycles across domestic networks. Supply assessment mapped certified manufacturing capacity and approved modification centers. Program timing was aligned with production rates and maintenance windows. Scenario framing reflected production volatility and certification throughput.
Step 3: Hypothesis Validation and Expert Consultation
Assumptions were stress-tested with engineering, maintenance planning, and certification workflow specialists. Validation focused on change incorporation timelines, downtime constraints, and integration complexity with IFE and power. Operational feasibility checks reconciled network schedules with retrofit throughput and linefit ramp profiles.
Step 4: Research Synthesis and Final Output
Insights were synthesized into demand pathways, risk factors, and opportunity themes aligned with fleet strategies. Findings were cross-checked for regulatory consistency and operational realism. Final outputs emphasized actionable implications for procurement, certification planning, and program execution sequencing.
- Executive Summary
- Research Methodology (Market Definitions and aircraft seat class taxonomies, OEM and tier-1 supplier shipment tracking, airline fleet retrofit and linefit surveys, FAA certification and STC database analysis, aircraft delivery and backlog triangulation, teardown and bill-of-material cost modeling, procurement contract and pricing intelligence)
- Definition and Scope
- Market evolution
- Usage and configuration pathways
- Ecosystem structure
- Supply chain and channel structure
- Regulatory environment

- Growth Drivers
Fleet renewal programs by US airlines
Cabin densification and yield optimization strategies
Premium cabin expansion and monetization
Post-pandemic retrofit cycles and deferred MRO recovery
Weight reduction mandates for fuel efficiency
Rising passenger experience differentiation - Challenges
Lengthy FAA certification and STC approval timelines
Supply chain constraints in aerospace-grade materials
OEM production rate volatility
High customization costs and low economies of scale
Complex integration with in-flight entertainment and power systems
Long replacement cycles and airline capex sensitivity - Opportunities
Accelerated narrowbody deliveries for domestic networks
Premium economy seat penetration growth
Lightweight composite seat adoption
Aftermarket retrofit programs tied to brand refresh cycles
Partnerships with IFE and connectivity suppliers
Sustainability-driven materials innovation - Trends
Slimline seat adoption in economy cabins
Increased focus on modular and quick-change seat designs
Integration of wireless IFE and power at seat
Ergonomic and wellness-oriented seat design
Use of recycled and bio-based materials
Data-enabled predictive maintenance for seating components - Government Regulations
- SWOT Analysis
- Stakeholder and Ecosystem Analysis
- Porter’s Five Forces Analysis
- Competition Intensity and Ecosystem Mapping
- By Value, 2020–2025
- By Volume, 2020–2025
- By Installed Base, 2020–2025
- By Average Selling Price, 2020–2025
- By Seat Class (in Value %)
Economy class seating
Premium economy seating
Business class seating
First class seating - By Aircraft Type (in Value %)
Narrowbody aircraft seating
Widebody aircraft seating
Regional aircraft seating - By Fitment Type (in Value %)
Linefit seating
Retrofit seating - By Material and Structure (in Value %)
Aluminum alloy frame seats
Titanium frame seats
Composite and lightweight hybrid seats - By Seating Configuration (in Value %)
High-density slimline seating
Lie-flat and recliner seating
Monument-integrated seating
- Market structure and competitive positioning
Market share snapshot of major players - Cross Comparison Parameters (seat weight efficiency, certification lead time, unit pricing competitiveness, customization capability, delivery lead time, aftermarket support coverage, product reliability metrics, sustainability credentials)
- SWOT Analysis of Key Players
- Pricing and Commercial Model Benchmarking
- Detailed Profiles of Major Companies
Safran Seats
Collins Aerospace
Recaro Aircraft Seating
ZIM Aircraft Seating
Thompson Aero Seating
Jamco Corporation
Geven S.p.A.
HAECO Cabin Solutions
Lufthansa Technik
Aviointeriors
Expliseat
STELIA Aerospace
Molon Labe Seating
Mirus Aircraft Seating
Pitch Aircraft Seating Systems
- Demand and utilization drivers
- Procurement and tender dynamics
- Buying criteria and vendor selection
- Budget allocation and financing preferences
- Implementation barriers and risk factors
- Post-purchase service expectations
- By Value, 2026–2035
- By Volume, 2026–2035
- By Installed Base, 2026–2035
- By Average Selling Price, 2026–2035


 Request a Sample
 Ask for Customization
 Get a Quote
 Enquire Now