
 Download PDF
Market Overview
The US commercial aircraft market current size stands at around USD ~ million, reflecting sustained fleet replacement cycles and strong domestic route density supported by hub-and-spoke operations. Demand is anchored by narrowbody utilization across high-frequency corridors and cargo fleet expansion for express logistics. Capital deployment remains focused on fuel-efficient platforms, reliability upgrades, and lifecycle serviceability, while procurement strategies emphasize delivery certainty and maintenance support ecosystems aligned with airline operational resilience and network continuity.
Activity concentrates in major aviation hubs such as Seattle, Dallas–Fort Worth, Atlanta, Chicago, Los Angeles, Phoenix, and Miami, where dense route networks, maintenance clusters, and supply-chain depth reinforce ecosystem maturity. Proximity to OEM engineering centers, Tier-1 manufacturing corridors, and MRO bases accelerates deployment and retrofit cycles. Policy alignment around safety certification, sustainability pathways, and airport modernization further supports concentration, while cargo gateways benefit from logistics parks, intermodal connectivity, and dedicated freighter infrastructure.
Market Segmentation
By Aircraft Type
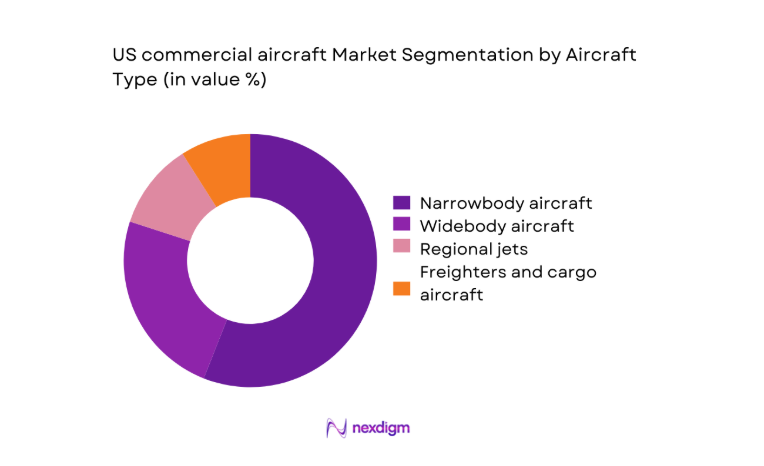
Narrowbody platforms dominate procurement due to high-frequency domestic corridors, dense seating configurations, and rapid turn times across hub-and-spoke networks. Fleet commonality reduces pilot training complexity and spares inventory burden, improving dispatch reliability. Widebody activity concentrates on transcontinental and select international routes supported by premium cabin demand and cargo belly capacity. Regional jets remain relevant for thin routes feeding primary hubs, while dedicated freighters expand with express parcel networks and integrator-led scheduling models. Aircraft type choices reflect route economics, airport slot constraints, and maintenance ecosystem availability across major metropolitan clusters.
By End Use Operation
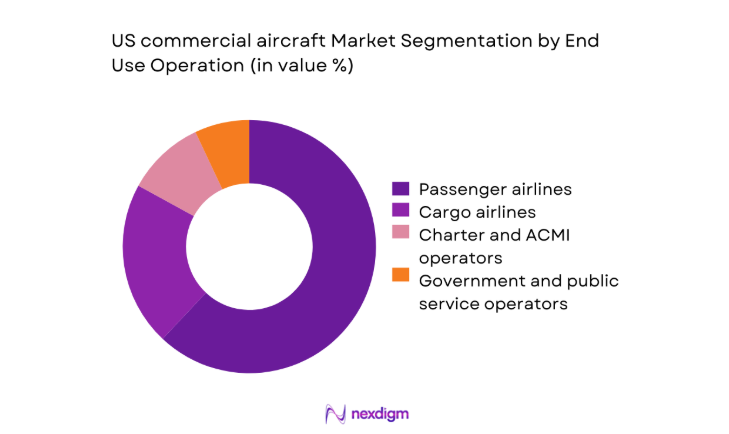
Passenger airlines account for the majority of deliveries driven by domestic demand concentration, schedule recovery, and network densification strategies. Cargo airlines continue to scale fleets to support time-definite delivery, hub sorting automation, and cross-border e-commerce lanes. Charter and ACMI operators serve seasonal peaks and capacity smoothing for scheduled carriers, enabling flexible capacity deployment without long-term ownership exposure. Government and public service operators procure specialized configurations for mobility and disaster response, leveraging domestic maintenance networks and regulatory alignment to ensure rapid readiness and lifecycle support.
Competitive Landscape
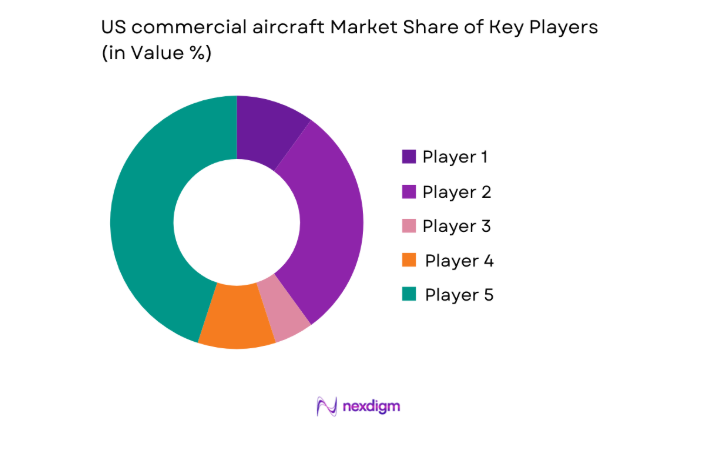
The competitive environment is shaped by concentrated OEM production, vertically integrated engine and avionics ecosystems, and dense Tier-1 manufacturing corridors. Competitive differentiation centers on delivery reliability, fleet commonality fit, aftermarket depth, and certification readiness, with service networks embedded across major hubs and MRO clusters.
| Company Name | Establishment Year | Headquarters | Formulation Depth | Distribution Reach | Regulatory Readiness | Service Capability | Channel Strength | Pricing Flexibility |
| Boeing | 1916 | Arlington, VA | ~ | ~ | ~ | ~ | ~ | ~ |
| Airbus | 1970 | Toulouse, France | ~ | ~ | ~ | ~ | ~ | ~ |
| GE Aerospace | 1917 | Evendale, OH | ~ | ~ | ~ | ~ | ~ | ~ |
| RTX | 1930 | Arlington, VA | ~ | ~ | ~ | ~ | ~ | ~ |
| Safran | 2005 | Paris, France | ~ | ~ | ~ | ~ | ~ | ~ |
US commercial aircraft Market Analysis
Growth Drivers
Rising domestic and international air passenger demand
US passenger throughput across primary hubs increased steadily during 2024 and 2025 as route frequencies normalized and long-haul schedules reopened. TSA daily checkpoint screenings averaged 2300000 in 2024 and exceeded 2450000 on peak days in 2025, supporting higher aircraft utilization. FAA air traffic operations surpassed 16000000 movements in 2024, reinforcing capacity needs on trunk routes. Airport runway rehabilitation projects across 2024 enabled higher on-time performance, while terminal gate expansions added 420 contact gates nationwide in 2025. These indicators raise fleet deployment intensity, pushing carriers toward higher-frequency narrowbody operations and selective widebody redeployment.
Fleet modernization to improve fuel efficiency and operating economics
US carriers accelerated retirements of older aircraft types during 2024 and 2025 as maintenance checks approached heavy cycles. FAA registry updates show thousands of aircraft transitions between active and storage status annually, tightening operational planning. Engine shop visit volumes increased across 2024, reflecting maintenance cycle convergence and the need for newer propulsion architectures. SAF blending mandates at several hubs advanced in 2025, reinforcing procurement preferences for platforms certified for higher blend rates. Airport noise compliance programs expanded across metropolitan regions in 2024, pressuring fleets toward quieter configurations and newer airframes that reduce operational constraints on night operations.
Challenges
Supply chain constraints for engines, avionics, and structures
Tier-1 delivery schedules faced volatility across 2024 and 2025 as lead times for castings, forgings, and semiconductors extended beyond typical planning cycles. FAA production oversight actions during 2024 increased documentation requirements, slowing throughput at assembly lines. US manufacturing employment in aerospace remained below pre-pandemic levels in 2024, constraining surge capacity. Port congestion metrics during early 2025 reflected extended dwell times for specialized components. These factors compress delivery windows, elevate inventory buffers, and complicate airline fleet induction schedules, forcing interim lease extensions and operational workarounds across high-utilization corridors nationwide.
Production rate instability and delivery delays
OEM rate adjustments during 2024 resulted in uneven monthly delivery profiles, complicating airline capacity planning. FAA conformity inspections expanded in scope during 2024 and 2025, increasing cycle times for completed aircraft acceptance. Airport slot coordination bodies reported schedule re-optimizations across multiple hubs in 2025 as deliveries slipped into later quarters. Airline training pipelines recorded bottlenecks in 2024 as simulator availability lagged induction schedules, delaying crew readiness. These frictions cascade into network planning, forcing temporary wet-lease utilization and route frequency trimming during peak periods, eroding schedule reliability and operational resilience.
Opportunities
Next-generation narrowbody re-fleeting programs
US carriers advanced fleet plans in 2024 and 2025 to replace aging narrowbodies aligned with domestic corridor density. FAA certification pathways for incremental efficiency upgrades progressed in 2024, enabling phased induction without major infrastructure changes. Airport gate compatibility audits in 2025 confirmed readiness for higher-capacity single-aisle configurations across hundreds of gates. SAF availability expanded at major hubs in 2025, supporting operational pilots on newer platforms. Workforce training throughput increased during 2024 as pilot pipelines stabilized, creating conditions for accelerated induction cycles that enhance network frequency while lowering fuel burn per available seat mile.
Growth of dedicated air cargo and freighter conversions
Express integrators expanded hub automation in 2024 and 2025, increasing nightly sort capacity and driving demand for additional lift. Customs modernization pilots at key gateways in 2024 reduced clearance times, improving aircraft turn efficiency for international parcels. Warehouse construction permits across logistics corridors rose in 2025, supporting higher feeder network density. FAA approvals for supplemental type certificates progressed during 2024, enabling faster conversion timelines for mid-life airframes. These conditions support scalable freighter deployment aligned with time-definite delivery growth, strengthening hub-and-spoke cargo connectivity across domestic and transborder lanes.
Future Outlook
Fleet strategies through 2035 will emphasize narrowbody densification, selective widebody redeployment on premium routes, and cargo network scaling aligned with e-commerce flows. Policy momentum on SAF and noise compliance will shape specifications and retrofit pathways. Infrastructure upgrades at major hubs will enable higher utilization, while delivery reliability and maintenance capacity will remain decisive for deployment pacing.
Major Players
- Boeing
- Airbus
- GE Aerospace
- RTX
- Safran
- Spirit AeroSystems
- Honeywell Aerospace
- Parker Hannifin Aerospace
- L3Harris Technologies
- Hexcel
- Triumph Group
- Textron Aviation
- Embraer
- GKN Aerospace
- Leonardo
Key Target Audience
- Commercial passenger airlines
- Cargo and express logistics airlines
- Aircraft leasing companies
- MRO service providers
- Airport authorities and operators
- Original equipment component suppliers
- Investments and venture capital firms
- Government and regulatory bodies with agency names
Research Methodology
Step 1: Identification of Key Variables
Operational variables included fleet age profiles, utilization intensity across hub corridors, certification timelines, and maintenance cycle clustering. Infrastructure readiness, gate compatibility, SAF availability, and training throughput were mapped to deployment feasibility. Regulatory variables captured certification scope and compliance cadence.
Step 2: Market Analysis and Construction
Route density, airport capacity programs, and MRO coverage were synthesized to construct demand scenarios. Fleet transition pathways were aligned with certification readiness and infrastructure constraints. Scenario construction emphasized operational continuity under delivery volatility.
Step 3: Hypothesis Validation and Expert Consultation
Assumptions on induction pacing, maintenance capacity, and training throughput were validated with operators, maintenance planners, and regulatory liaisons. Feedback refined bottleneck identification and mitigation sequencing under current compliance frameworks.
Step 4: Research Synthesis and Final Output
Findings were integrated into deployment pathways, risk registers, and opportunity maps. Outputs aligned infrastructure readiness with fleet strategies, emphasizing operational resilience and compliance-led pacing.
- Executive Summary
- Research Methodology (Market Definitions and commercial aircraft classification by type and mission profile, OEM and Tier-1 production rate tracking and backlog analysis, FAA registry and fleet age profile assessment, airline fleet plan and capacity deployment interviews, airport infrastructure and MRO capacity mapping, leasing and financing transaction benchmarking, defense-civil crossover manufacturing impact assessment)
- Definition and Scope
- Market evolution
- Usage or care pathways
- Ecosystem structure
- Supply chain or channel structure
- Regulatory environment

- Growth Drivers
Rising domestic and international air passenger demand
Fleet modernization to improve fuel efficiency and operating economics
Expansion of e-commerce and express cargo networks
Replacement of aging narrowbody fleets
Recovery of long-haul traffic and international route capacity
Airport hub expansion and slot optimization - Challenges
Supply chain constraints for engines, avionics, and structures
Production rate instability and delivery delays
Labor shortages in manufacturing and MRO
OEM quality control and certification bottlenecks
High capital costs and financing constraints
Geopolitical and trade policy uncertainty affecting suppliers - Opportunities
Next-generation narrowbody re-fleeting programs
Growth of dedicated air cargo and freighter conversions
Sustainable aviation fuel adoption and retrofit opportunities
Digital aircraft health monitoring and predictive maintenance integration
Expansion of regional connectivity with right-sized aircraft
Domestic manufacturing and reshoring of critical components - Trends
Acceleration of fleet commonality strategies among US carriers
Increased adoption of operating leases for balance sheet flexibility
Integration of SAF capability in new aircraft specifications
Rising order intake for narrowbody aircraft with higher seating density
Freighter conversions of mid-life widebody aircraft
Enhanced cabin configurations for premium and hybrid service models - Government Regulations
- SWOT Analysis
- Stakeholder and Ecosystem Analysis
- Porter’s Five Forces Analysis
- Competition Intensity and Ecosystem Mapping
- By Value, 2020–2025
- By Volume, 2020–2025
- By Installed Base, 2020–2025
- By Average Selling Price, 2020–2025
- By Aircraft Type (in Value %)
Narrowbody aircraft
Widebody aircraft
Regional jets
Freighters and cargo aircraft - By Propulsion Type (in Value %)
Turbofan
Geared turbofan
Turboprop
Hybrid-electric and alternative propulsion - By Range Class (in Value %)
Short-haul
Medium-haul
Long-haul - By End Use Operation (in Value %)
Passenger airlines
Cargo airlines
Charter and ACMI operators
Government and public service operators - By Ownership Model (in Value %)
Direct airline ownership
Operating lease
Finance lease
Sale and leaseback
- Market structure and competitive positioning
Market share snapshot of major players - Cross Comparison Parameters (fleet commonality fit, delivery lead time, total cost of ownership, fuel efficiency performance, cabin configuration flexibility, aftermarket support footprint, financing and leasing support, sustainability readiness)
- SWOT Analysis of Key Players
- Pricing and Commercial Model Benchmarketing
- Detailed Profiles of Major Companies
Boeing
Airbus
GE Aerospace
RTX (Pratt & Whitney, Collins Aerospace)
Safran
Spirit AeroSystems
Honeywell Aerospace
Parker Hannifin Aerospace
L3Harris Technologies
Hexcel
Triumph Group
Textron Aviation
Embraer
GKN Aerospace
Leonardo
- Demand and utilization drivers
- Procurement and tender dynamics
- Buying criteria and vendor selection
- Budget allocation and financing preferences
- Implementation barriers and risk factors
- Post-purchase service expectations
- By Value, 2026–2035
- By Volume, 2026–2035
- By Installed Base, 2026–2035
- By Average Selling Price, 2026–2035


 Request a Sample
 Ask for Customization
 Get a Quote
 Enquire Now