 Download PDF
Market Overview
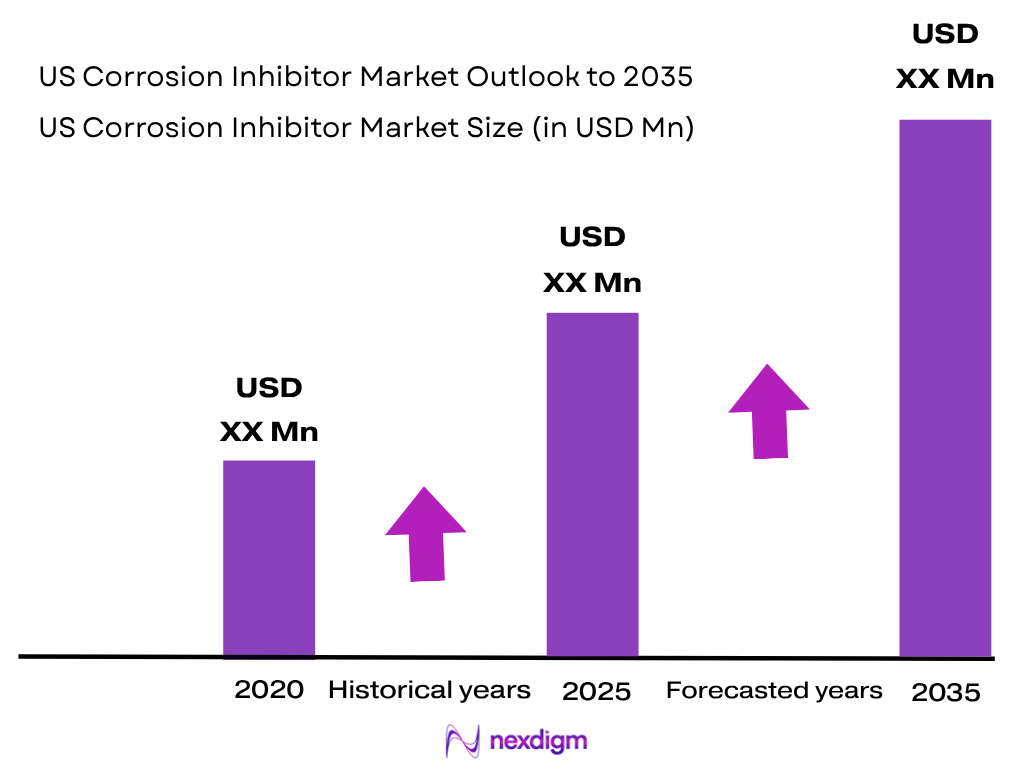
The US Corrosion Inhibitor Market is valued at approximately USD ~X.X billion, based on historical demand assessment. Demand is driven by oil and gas production, refining, pipelines, industrial cooling water, boilers and municipal water treatment. Domestic crude production increased from 12.9 million barrels/day to 13.2 million barrels/day, while dry natural-gas output moved from 37.65 trillion cubic feet to 37.72 trillion cubic feet, sustaining corrosion-control requirements across wells, flowlines, pipelines and process equipment.
Texas, Louisiana, New Mexico and the broader Gulf Coast dominate the US Corrosion Inhibitor Market because these areas concentrate upstream production, gas processing, pipelines, refineries and petrochemical complexes. Texas dry-gas production increased from 26.4 Bcf/day to 27.5 Bcf/day, while New Mexico increased from 7.9 Bcf/day to 9.1 Bcf/day. National refinery distillation capacity simultaneously expanded from 18.06 million to 18.38 million barrels per calendar day, strengthening Gulf Coast process-chemical demand.
Market Segmentation
By Chemistry Type
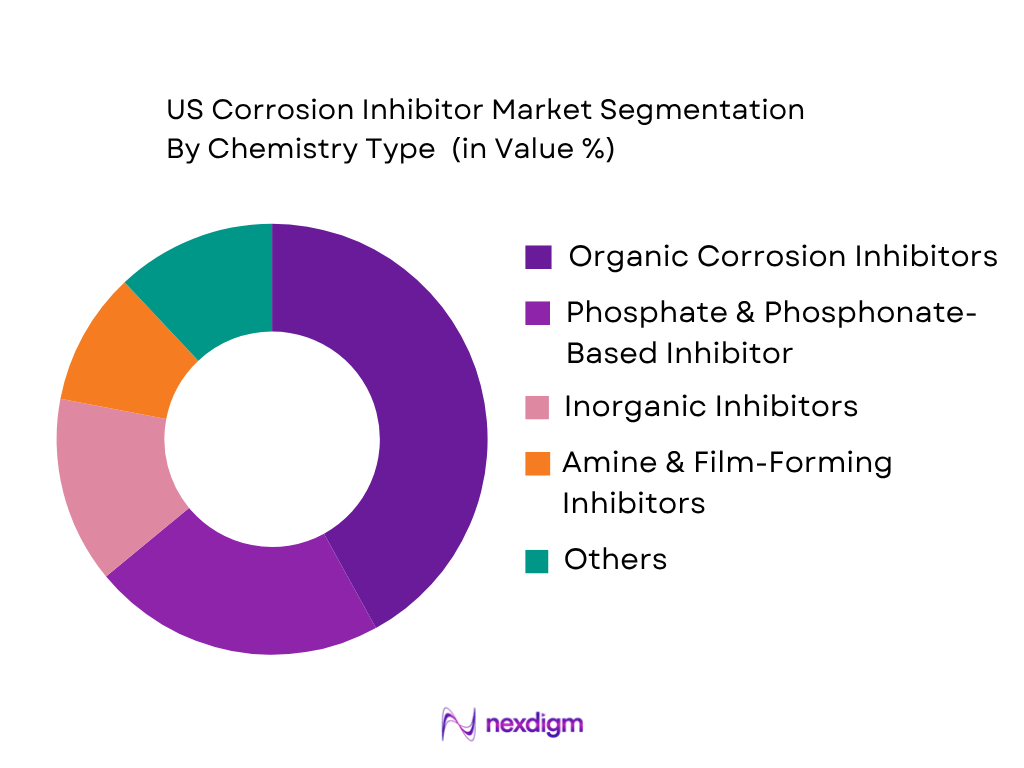
The US Corrosion Inhibitor Market is segmented into organic inhibitors, phosphate and phosphonate inhibitors, inorganic inhibitors, amine-based inhibitors, azoles and other specialty formulations. Organic corrosion inhibitors hold the dominant market position because of their versatility across petroleum production, pipelines, refining and industrial water systems. Imidazolines, amines, carboxylates and film-forming organic chemistries can be formulated for adsorption onto carbon-steel surfaces and for compatibility with complex oilfield fluids. This is particularly important in a country producing 13.2 million barrels/day of crude oil and 37.72 trillion cubic feet of dry natural gas, where extensive upstream and midstream assets require continuous or batch corrosion treatment. Phosphate and phosphonate chemistries remain important in industrial and municipal water applications, particularly for passivation and combined scale-corrosion control. EPA also identifies orthophosphate as the most commonly applied phosphate chemistry for controlling lead and copper release in drinking-water distribution systems.
By End-Use Industry
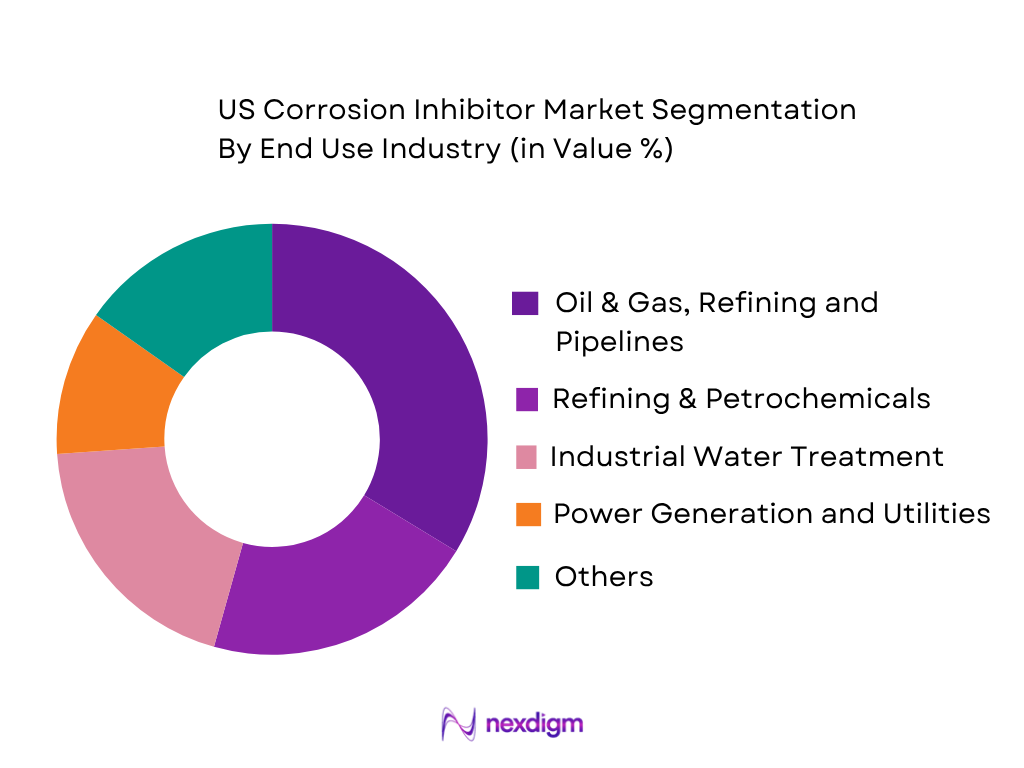
The US Corrosion Inhibitor Market is segmented into oil and gas, refining and petrochemicals, industrial water treatment, power generation, municipal water, metal processing, pulp and paper and other manufacturing applications. Oil and gas represents the dominant end-use segment, supported by the scale of domestic production and associated gathering, processing and pipeline infrastructure. Crude output reached 13.2 million barrels/day, with the Permian accounting for nearly half of national production, while marketed natural-gas production averaged about 113 Bcf/day. Corrosion inhibitors are injected into wells, gathering lines, produced-water systems and pipelines to control CO2, H2S, oxygen and chloride-driven corrosion. Refining is another large application because the country operated 132 refineries with approximately 18.38 million barrels per calendar day of atmospheric distillation capacity. Industrial cooling water and boilers broaden demand through steel, chemicals, pulp and paper, manufacturing, data centers and power facilities.
Competitive Landscape
The US Corrosion Inhibitor Market is characterized by competition between integrated water-treatment companies, oilfield production-chemical suppliers and specialist industrial chemical formulators. Nalco Water, Kurita, Solenis, Veolia Water Technologies & Solutions and ChemTreat have strong positions in industrial water treatment, while oilfield-focused suppliers compete around CO2/H2S corrosion, produced-water chemistry and chemical-injection programs. Differentiation increasingly depends on chemistry performance, digital dosing, laboratory capability, regional production, on-site technical service and the ability to integrate corrosion, scale and microbiological control.
| Company | Establishment | Headquarters | Corrosion Chemistry Breadth | Oilfield Exposure | Cooling/Boiler Water Capability | Refinery & Petrochemical Capability | Digital Monitoring | US Manufacturing & Field Service |
| Nalco Water / Ecolab | 1928 | St. Paul, Minnesota | ~ | ~ | ~ | ~ | ~ | ~ |
| Kurita America | 1949 heritage | Minneapolis, Minnesota | ~ | ~ | ~ | ~ | ~ | ~ |
| Solenis | 2014 | Wilmington, Delaware | ~ | ~ | ~ | ~ | ~ | ~ |
| Veolia Water Technologies & Solutions | 2017 WTS formation | Trevose, Pennsylvania | ~ | ~ | ~ | ~ | ~ | ~ |
| ChemTreat | 1968 | Richmond, Virginia | ~ | ~ | ~ | ~ | ~ | ~ |
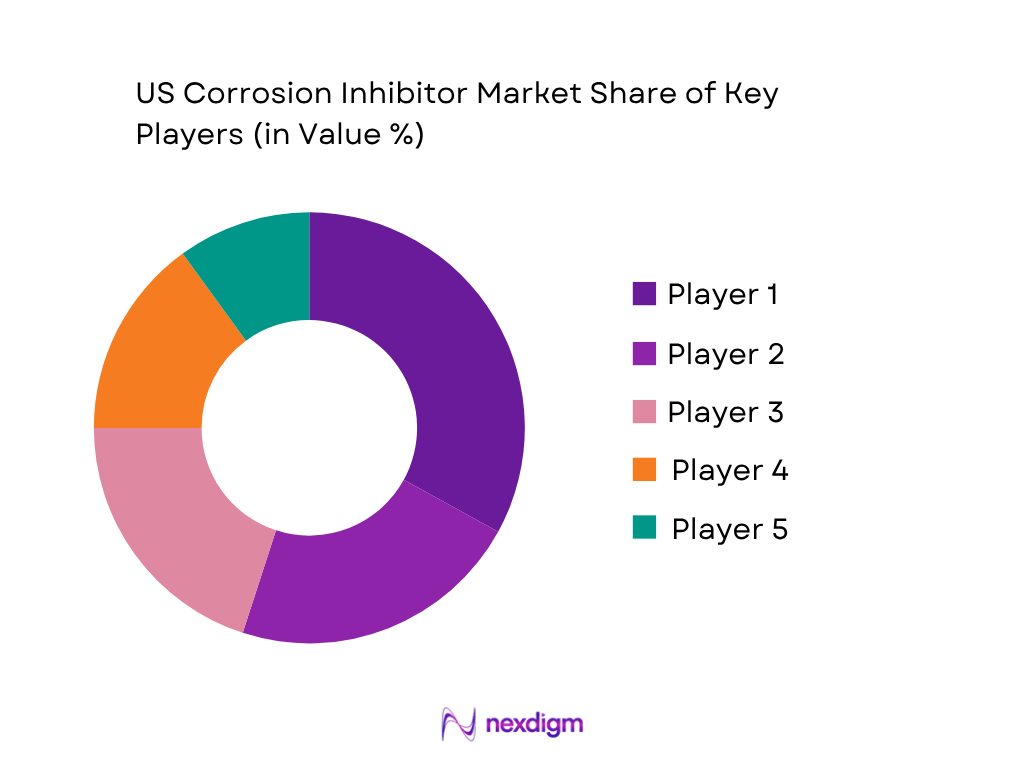
US Corrosion Inhibitor Market Analysis
Growth Drivers
Record Domestic Oil and Natural Gas Production Expanding Corrosion-Control Requirements
The scale of US hydrocarbon production is a direct structural driver for corrosion-inhibitor consumption because wells, gathering lines, produced-water systems, separators, pipelines, compression facilities and refineries are continuously exposed to carbon dioxide, hydrogen sulfide, chlorides, dissolved gases and water that accelerate internal corrosion. US crude oil production averaged a record 13.2 million barrels per day in 2024 and increased further to a record 13.6 million barrels per day in 2025, creating a larger operating base requiring continuous and batch chemical treatment. The Permian Basin was the largest producing region, and the United States had 918,481 producing oil and natural-gas wells at the end of 2024, demonstrating the scale over which corrosion-treatment programs must be deployed. Natural-gas infrastructure adds another major demand layer: US dry natural-gas production totaled 37.72 trillion cubic feet in 2024, equivalent to an average 103.07 billion cubic feet per day, while marketed natural-gas production averaged approximately 113 billion cubic feet per day. Texas alone produced 27.5 billion cubic feet per day of dry gas and New Mexico produced 9.1 billion cubic feet per day, reinforcing chemical-treatment concentration in the Southwest. Midstream infrastructure magnifies the recurring requirement, with 411,847 miles of regulated natural-gas transmission and gathering pipelines and 228,378 miles of hazardous-liquid and carbon-dioxide pipelines reported for 2024. Within the hazardous-liquid network, 83,072 miles transported crude oil and 64,231 miles transported petroleum and refined products. These assets need corrosion-control programs incorporating film-forming amines, imidazolines, quaternary chemistry and multifunctional packages alongside monitoring and chemical injection. The economic backdrop also supports intensive asset maintenance: World Bank data place US GDP at USD 28.75 trillion in 2024 and GDP per capita at USD 84,534, indicating the scale of industrial activity supported by these energy systems. The combination of record production, nearly one million producing wells and more than half a million miles of major energy pipelines makes corrosion inhibition an operating necessity rather than discretionary maintenance.
Large Refining, Petrochemical and Industrial Process Infrastructure Sustaining Recurring Chemical Demand
High utilization of US refining and process infrastructure generates recurring corrosion-inhibitor demand across atmospheric and vacuum distillation systems, crude-unit overheads, hydroprocessing units, cooling towers, boiler circuits, condensate networks and associated petrochemical operations. The United States had 132 operable refineries at the start of 2024, supported by atmospheric crude-oil distillation capacity of 18,384,228 barrels per calendar day. Actual gross input to atmospheric crude-oil distillation units averaged 16.607 million barrels per day in 2024, illustrating the operating intensity of equipment exposed to acidic contaminants, salts, chlorides, water and temperature cycling. Capacity remained extensive in the following period at 18,423,493 barrels per calendar day in 2025, while gross refinery input increased to 16.731 million barrels per day, sustaining demand for refinery corrosion inhibitors rather than limiting consumption to new capacity additions. This matters because inhibitor treatment is required not only in primary hydrocarbon processing but also in cooling-water loops, steam-condensate systems and process-water circuits where carbon steel, copper alloys and mixed metallurgy must remain protected during continuous plant operation. The Gulf Coast concentration of refineries, chemical plants and natural-gas liquids processing makes Texas and Louisiana particularly important demand centers for amine-based, phosphate/phosphonate, azole and specialized film-forming formulations. The market is further supported by a large chemical-manufacturing base: federal GDP-by-industry data identified chemical products among the leading contributors to US nondurable-goods manufacturing growth during 2024, demonstrating continued operating activity in precisely the facilities that consume industrial water-treatment chemistry. The country’s USD 28.75 trillion GDP in 2024 and USD 84,534 GDP per capita provide the macroeconomic context for a capital-intensive installed base where operators prioritize asset availability and life extension. Corrosion inhibitors therefore benefit from a broad demand structure encompassing hydrocarbon processing, industrial cooling, boiler systems, steam condensate, heat exchangers and utility networks rather than relying solely on upstream drilling cycles.
Market Challenges
Severe Multi-Environment Corrosion Across Wells and Pipelines Increases Treatment Complexity
The US corrosion-inhibitor market faces a major technical challenge because chemical programs must protect an exceptionally diverse infrastructure base operating under different metallurgy, fluid compositions, temperatures, pressures, water cuts and contaminant profiles. In 2024, US operators managed 918,481 producing oil and natural-gas wells, while crude production averaged 13.2 million barrels per day and dry natural-gas production reached 37.72 trillion cubic feet. A formulation that performs effectively in one well or pipeline can lose effectiveness where chloride loading, carbon dioxide, hydrogen sulfide, solids, scale-forming ions, water chemistry or hydrocarbon composition changes. Midstream diversity compounds the problem: PHMSA recorded 300,867 miles of natural-gas transmission pipelines, 110,980 miles of regulated gathering lines, and 228,378 miles of hazardous-liquid and carbon-dioxide systems in 2024. Hazardous-liquid infrastructure alone included 83,072 miles of crude-oil lines, 75,708 miles carrying highly volatile liquids, 64,231 miles carrying petroleum or refined products, and 5,345 miles classified as carbon-dioxide or other systems. Each service can require different corrosion-control chemistry, carrier systems, treatment frequency and compatibility with scale inhibitors, demulsifiers, paraffin-control chemicals, biocides and oxygen scavengers. Refining adds another layer of complexity because 132 operable refineries had more than 18.38 million barrels per calendar day of crude-distillation capacity, creating thousands of process and utility environments where underfeeding risks corrosion while excessive or incompatible treatment can contribute to deposits, foaming or downstream operational problems. Suppliers therefore need laboratory testing, field sampling, corrosion coupons, probes and chemical-injection optimization rather than simple product sales. The macroeconomic consequence of reliability failures is magnified by the size of the US economy, with USD 28.75 trillion of GDP in 2024 and GDP per capita of USD 84,534. This makes technical performance critical but simultaneously raises qualification barriers for smaller formulators attempting to enter complex oilfield, pipeline and refinery accounts.
Regulatory Transition and Discharge Constraints Complicate Traditional Corrosion-Control Chemistry
Environmental and drinking-water requirements are increasing formulation complexity for corrosion-inhibitor suppliers because customers need effective metal protection while simultaneously controlling chemical discharge, lead and copper release, water quality and treatment compatibility. EPA’s final Lead and Copper Rule Improvements issued in 2024 lowered the lead action level to 0.010 mg/L and requires affected water systems to install or re-optimize optimal corrosion-control treatment when specified conditions are triggered. Systems with corrosion-control treatment that record a tap result above 0.010 mg/L must conduct a distribution-system and site assessment; nearby water-quality-parameter sampling can be required within 5 days, and the evaluation and treatment recommendation must be completed within 6 months after the relevant monitoring period. The rule also establishes standard water-quality monitoring requirements ranging from 1 distribution site for very small systems to 25 sites for systems serving more than 100,000 people, materially increasing the importance of controlled inhibitor concentration, pH and alkalinity management. These requirements create opportunities for orthophosphate and other corrosion-control chemistries but also create a challenge: suppliers must ensure chemical treatments protect distribution infrastructure without conflicting with downstream nutrient-management and wastewater objectives. Industrial customers face a similar balancing problem in cooling towers and boiler systems because discharge permits can constrain residual chemicals, metals and other constituents, encouraging movement away from legacy heavy-metal approaches and toward lower-phosphorus or non-phosphorus alternatives. At the same time, chemical formulations need to protect the vast industrial infrastructure represented by 18.38 million barrels per calendar day of refinery capacity and more than 411,000 miles of regulated natural-gas transmission and gathering pipelines. World Bank data show US GDP of USD 28.75 trillion in 2024 and GDP per capita of USD 84,534, underscoring the scale of industrial assets subject to environmental and water-quality requirements. Suppliers must therefore invest in formulation redesign, application testing, compliance documentation and monitoring capabilities while customers evaluate treatment performance against increasingly specific regulatory conditions.
Market Opportunities
Permian Basin Production Chemistry and High-Performance Oilfield Corrosion Programs
The scale of current US oil and gas production creates substantial future growth potential for high-performance corrosion-inhibitor programs designed for wells, gathering systems, produced-water handling and pipelines, particularly in the Permian Basin. US crude output averaged 13.2 million barrels per day in 2024 and advanced to 13.6 million barrels per day in 2025, meaning the installed production system requiring corrosion management is larger than at any previous point in US history. The Permian was the primary production-growth engine, while federal onshore lands alone produced 1.7 million barrels per day of crude oil in 2024 and offshore federal areas produced approximately 1.8 million barrels per day. Natural-gas production creates an equally important chemistry requirement: dry gas totaled 37.72 trillion cubic feet in 2024, with Texas producing 27.5 billion cubic feet per day and New Mexico 9.1 billion cubic feet per day. These current operating volumes provide a large future aftermarket for imidazoline-based products, amines, quaternary formulations and multifunctional inhibitor packages capable of working alongside scale control, biocides and produced-water treatment. The opportunity is strengthened by the number of active assets: 918,481 producing wells were recorded in 2024, meaning suppliers can expand by improving chemical program penetration and performance across existing wells rather than depending entirely on new drilling. The midstream system also creates recurring treatment points, with 83,072 miles of crude-oil pipelines, 75,708 miles of highly volatile liquid pipelines and 110,980 miles of regulated natural-gas gathering lines in operation during 2024. Future competitive advantage should therefore move toward field-specific chemical selection, corrosion probes, remote dosing optimization and laboratory-supported failure analysis, allowing operators to control corrosion as production fluids and water chemistry change over a well’s life. The US economy generated USD 28.75 trillion of GDP in 2024, with GDP per capita of USD 84,534, providing a strong industrial base for advanced production-chemistry services. Current production and infrastructure figures support future demand without requiring assumptions about future oil volumes.
Carbon-Dioxide Transport and Municipal Water Treatment Open New Specialty-Chemistry Applications
Carbon-management infrastructure and stricter drinking-water corrosion control create future opportunities for corrosion-inhibitor suppliers beyond traditional oilfield and refinery demand. PHMSA reported 5,345 miles of carbon-dioxide or other hazardous-liquid pipeline systems in 2024, establishing an existing pipeline base where moisture control and internal-corrosion management are important because water-containing CO2 streams can become highly corrosive. The Department of Energy reported 18 commercial-scale carbon capture and storage projects operating in the United States in 2024 and approximately 220 publicly announced projects at various development stages. During the same year, federal programs made up to USD 500 million available for expansion of carbon-dioxide transportation infrastructure and up to USD 48 million for regional CO2 transport-network development, illustrating current institutional activity around a new class of corrosion-sensitive pipelines. This creates future scope for inhibitors and monitoring packages compatible with dense-phase CO2, impurities and pipeline metallurgy. Municipal water creates a separate specialty opportunity following EPA’s 2024 Lead and Copper Rule Improvements. The rule lowered the lead action level to 0.010 mg/L, requires additional corrosion-control actions when thresholds are exceeded and applies corrosion-control requirements across community and non-transient non-community water systems. Larger systems can be required to maintain at least 25 water-quality-parameter monitoring sites, while assessments following certain elevated samples include actions within 5 days and subsequent system-level evaluations within 6 months. These requirements support future demand for orthophosphate, optimized blended treatment, silicate-based approaches where appropriate, chemical-feed systems and continuous monitoring. The addressable application base is reinforced by the broader economy: US GDP reached USD 28.75 trillion in 2024, while GDP per capita was USD 84,534. For corrosion-inhibitor suppliers, these current figures support future diversification into carbon-transport integrity and municipal corrosion-control programs, reducing dependence on conventional oilfield treatment cycles while increasing the value of application engineering, monitoring and regulatory-compliance expertise.
Future Outlook
The US Corrosion Inhibitor Market is projected to expand at approximately ~X.X% CAGR during 2026-2035. Future growth will be shaped less by simple chemical-volume expansion and increasingly by higher-performance, application-specific treatment programs. Continued oil and gas production, refinery operations, water reuse, infrastructure protection and tightening drinking-water corrosion requirements are expected to reinforce recurring chemical demand.
Major Players
- Nalco Water / Ecolab
- Kurita America
- Solenis
- Veolia Water Technologies & Solutions
- ChemTreat
- SLB / ChampionX Production Chemicals
- Baker Hughes
- Clariant
- Innospec
- Italmatch Chemicals
- Dorf Ketal
- Cortec Corporation
- Chem-Aqua
- Buckman
- BASF
Key Target Audience
- Corrosion Inhibitor and Specialty Chemical Manufacturers
- Oilfield Production Chemical Suppliers
- Industrial Water-Treatment Chemical Companies
- Oil, Gas, Refining and Petrochemical Operators
- Power, Steel, Pulp & Paper and Process Manufacturing Companies
- Investments and Venture Capitalist Firms
- Private Equity Firms and Strategic Chemical Investors
- Government and Regulatory Bodies (US Environmental Protection Agency, Pipeline and Hazardous Materials Safety Administration, Occupational Safety and Health Administration, US Department of Energy and State Environmental Protection Agencies)
Research Methodology
Step 1: Identification of Key Variables
The initial phase constructs a comprehensive ecosystem map for the US Corrosion Inhibitor Market, encompassing specialty chemical producers, water-treatment companies, oilfield service providers, chemical formulators, distributors and industrial users. Critical variables include production volumes, installed cooling and boiler systems, refinery capacity, pipeline exposure, metallurgy, water chemistry, corrosion mechanisms, chemical dosage, regulatory requirements and regional industrial concentration.
Step 2: Market Analysis and Construction
Historical market demand is developed through complementary top-down and bottom-up approaches. Top-down analysis evaluates corrosion-treatment intensity across oil and gas, refining, petrochemicals, power, municipal water, steel and pulp and paper. Bottom-up analysis assesses supplier revenues, active chemical volumes, treatment programs, customer-site penetration, domestic formulation, distribution networks and regional chemical consumption to establish a reconciled market framework.
Step 3: Hypothesis Validation and Expert Consultation
Market hypotheses are validated through structured CATI discussions with corrosion engineers, water-treatment specialists, oilfield chemical professionals, refinery personnel, municipal water operators, formulators and procurement teams. These interviews test treatment rates, chemistry selection, switching barriers, monitoring practices, regulatory impacts and application-specific requirements, allowing secondary-data assumptions to be evaluated against practical operating conditions.
Step 4: Research Synthesis and Final Output
Primary findings are triangulated against Energy Information Administration data, Environmental Protection Agency requirements, company disclosures, industrial operating statistics and chemical supply information. Application-level demand is reconciled with supplier-level estimates to construct the final market value, chemistry segmentation, end-user distribution, competitive positioning and future opportunity assessment for the US Corrosion Inhibitor Market.

- Executive Summary
- Research Methodology (Market Definition and Product Boundary, Corrosion Inhibitor Chemistry Classification, Oilfield Production Chemical Consumption Mapping, Refinery Process Chemical Assessment, Cooling Water Treatment Chemical Assessment, Boiler and Condensate Treatment Assessment, Municipal Drinking-Water Corrosion Control Assessment, Pipeline Chemical Injection Mapping, Metalworking Fluid Additive Assessment, Pulp and Paper Process-Water Assessment, Steel and Primary Metals Water-Treatment Assessment, Power Generation Water-Chemistry Assessment, Chemical Treatment Rate Mapping, Installed Cooling Tower and Boiler Base Assessment, Top-Down Industrial Demand Analysis, Bottom-Up Supplier Revenue Assessment, Formulator and Distributor Mapping, Domestic Production Assessment, Import-Export Analysis, Primary Industry Interviews, Treatment Program Benchmarking, Data Triangulation, Forecasting Framework)

- Definition and Scope
- US Corrosion Inhibitor Industry Evolution
- US Corrosion Inhibitor Value Chain Analysis
- US Corrosion Inhibitor Supply Chain Analysis
- Domestic Manufacturing, Toll Blending, Bulk Storage and Field-Service Infrastructure

- Growth Drivers (Record Domestic Crude Oil Production, Large Natural Gas Production Base, Extensive Midstream Pipeline Infrastructure, High Refinery Throughput, Gulf Coast Petrochemical Concentration, Large Industrial Cooling-Water Installed Base, Boiler and Steam-System Corrosion-Control Requirements, Municipal Drinking-Water Corrosion Control, Chemical Manufacturing Activity, Steel Mill Cooling-Water Demand, Pulp and Paper Mill Process-Water Requirements, Industrial Asset-Life Extension Programs, Data-Center Cooling Infrastructure Expansion)
- Market Challenges (Volatility in Oilfield Chemical Demand, Phosphorus Discharge Constraints, Transition Away from Heavy-Metal Corrosion Inhibitors, Complex Multi-Metallurgy Systems, High-Chloride Produced Water, H2S and CO2 Corrosion Severity, Chemical Compatibility with Scale Inhibitors and Biocides, Produced-Water Variability, Treatment Overfeed and Underfeed Risk, State-Specific Wastewater Discharge Requirements, Raw-Material Availability, Customer Qualification Cycles, Commodity Treatment Program Price Competition, Emerging Environmental Scrutiny of Persistent Chemistries)
- Market Opportunities (Non-Phosphorus Cooling-Water Inhibitors, Low-Phosphorus Treatment Programs, High-Salinity Oilfield Corrosion Inhibitors, Permian Basin Production Chemistry, Carbon Capture Pipeline Corrosion Control, Produced-Water Reuse Chemistry, Digital Chemical Injection Optimization, Film-Forming Boiler Chemistry, Data-Center Cooling-Water Corrosion Control, Lead and Copper Corrosion-Control Treatment, Refinery Turnaround Chemical Programs, High-Cycles-of-Concentration Cooling Programs, Multi-Metal Inhibitor Packages, Biodegradable Corrosion Inhibitors, Domestic Specialty Chemical Formulation)
- Market Trends (Phosphate-Free Cooling-Water Chemistry, Advanced Polymer-Inhibitor Blends, Imidazoline-Based Oilfield Chemistry, Low-Toxicity Oilfield Formulations, Film-Forming Amine Technology, Automated Chemical Feed Systems, Online Corrosion Monitoring, Coupon and Probe Integration, Digital Dosing Analytics, Produced-Water Reuse, Higher Cooling-Water Concentration Cycles, Combination Scale-Corrosion Programs, Multi-Metal Protection, Sustainability-Oriented Formulations, Localized Toll Blending)
- Government Regulations and Standards (EPA Toxic Substances Control Act Requirements, Clean Water Act Industrial Discharge Requirements, National Pollutant Discharge Elimination System Requirements, Safe Drinking Water Act Requirements, EPA Lead and Copper Rule Improvements, Optimal Corrosion Control Treatment Requirements, Industrial Cooling Tower Air-Emission Requirements, PHMSA Pipeline Corrosion-Control Requirements, OSHA Hazard Communication Requirements, NSF/ANSI/CAN Drinking-Water Chemical Requirements, State Nutrient and Phosphorus Discharge Limits)
- SWOT Analysis
- Porter’s Five Forces Analysis
- PESTLE Analysis
- Stakeholder Ecosystem
- Competition Ecosystem

- By Market Value (2020-2025)
- By Consumption Volume (2020-2025)
- By Active Ingredient Volume (2020-2025)
- By Formulated Product Volume (2020-2025)
- By Domestic Production (2020-2025)
- By Imports (2020-2025)

- By Chemistry Type (In Value %)
Organic Corrosion Inhibitors
Inorganic Corrosion Inhibitors
Phosphate-Based Inhibitors
Phosphonate-Based Inhibitors
Molybdate-Based Inhibitors - By Product Form (In Value %)
Water-Soluble Liquid Inhibitors
Oil-Soluble Liquid Inhibitors
Water-Dispersible Inhibitors
Concentrated Liquid Blends
Powder and Solid Inhibitors
Emulsion-Based Products
Encapsulated Corrosion Inhibitors
Volatile Corrosion Inhibitors
Combination Scale and Corrosion Inhibitors
Oxygen Scavenger and Passivator Blends - By Corrosion Mechanism (In Value %)
Carbon Dioxide Corrosion
Oxygen Corrosion
Chloride-Induced Corrosion
Acid Corrosion
Galvanic Corrosion
Under-Deposit Corrosion
Top-of-Line Corrosion
Condensate Corrosion
Pitting Corrosion
Microbiologically Influenced Corrosion
Multi-Metal Corrosion - By Application System (In Value %)
Open Recirculating Cooling Towers
Closed Cooling-Water Systems
Boiler Feedwater Systems
Boiler Internal Water Systems
Steam and Condensate Systems
Oil and Gas Wells
Produced-Water Systems
Gathering and Flowline Systems
Crude Oil Pipelines
Natural Gas Pipelines
Refinery Process Units - By End-Use Industry (In Value %)
Upstream Oil and Gas
Midstream Pipelines and Storage
Petroleum Refining
Petrochemicals and Chemicals
Power Generation
Municipal Water Utilities
Industrial Water Treatment
Iron and Steel
Pulp and Paper
Mining and Mineral Processing
Automotive and Metalworking
Food and Beverage Processing
Pharmaceutical Manufacturing
Data Centers and Mission-Critical Cooling
General Manufacturing
Marine and Transportation - By Injection and Treatment Mode (In Value %)
Continuous Chemical Injection
Batch Treatment
Intermittent Injection
Downhole Chemical Injection
Pipeline Injection
Cooling-Tower Dosing
Boiler Feedwater Dosing

- Market Share of Major Players (By US Revenue, Consumption Volume, Chemistry Type, Oilfield Segment, Industrial Water-Treatment Segment, Refinery Segment, Municipal Water Segment, Regional Coverage)
- Cross Comparison Parameters (US Corrosion Inhibitor Revenue, Oilfield-Cooling Water-Boiler-Refinery Portfolio Breadth, CO2-H2S-High-Chloride and Multi-Metallurgy Chemistry Capability, Permian-Gulf Coast-Refinery and Major Industrial Customer Exposure, US Manufacturing Formulation and Chemical Blending Capability, Low-Phosphorus Non-Phosphorus and Film-Forming Chemistry Capability, Digital Chemical Injection Corrosion Monitoring and Automation Capability, US Laboratory Distribution and Field Technical Support Footprint)
- SWOT Analysis of Major Players (Chemistry Portfolio, Market Exposure, Technical Capability, Manufacturing Network, Digital Solutions, Customer Access)
- Pricing Analysis by Chemistry and Application (Active Chemistry, Formulation Concentration, Application Severity, Treatment Mode, Service Intensity, Bulk Versus Packaged Supply)
- Detailed Profiles of Major Companies
Nalco Water / Ecolab
Kurita America
Solenis
Veolia Water Technologies & Solutions
ChemTreat
SLB / ChampionX Production Chemicals
Baker Hughes
Clariant
Innospec
Italmatch Chemicals
Dorf Ketal
Cortec Corporation
Chem-Aqua
Buckman
BASF

- Oil and Gas Operator Corrosion-Chemistry Procurement Assessment
- Pipeline Operator Internal Corrosion-Control Assessment
- Refinery Process Chemical Procurement Assessment
- Petrochemical Plant Cooling-Water Treatment Assessment
- Power Plant Boiler and Cooling-Water Treatment Assessment
- Municipal Utility Corrosion-Control Treatment Assessment

- By Market Value (2026-2035)
- By Consumption Volume (2026-2035)
- By Active Ingredient Volume (2026-2035)
- By Formulated Product Volume (2026-2035)
- By Domestic Production (2026-2035)
- By Imports (2026-2035)


 Request a Sample
 Ask for Customization
 Get a Quote
 Enquire Now