
 Download PDF
 Download PDF
Market Overview
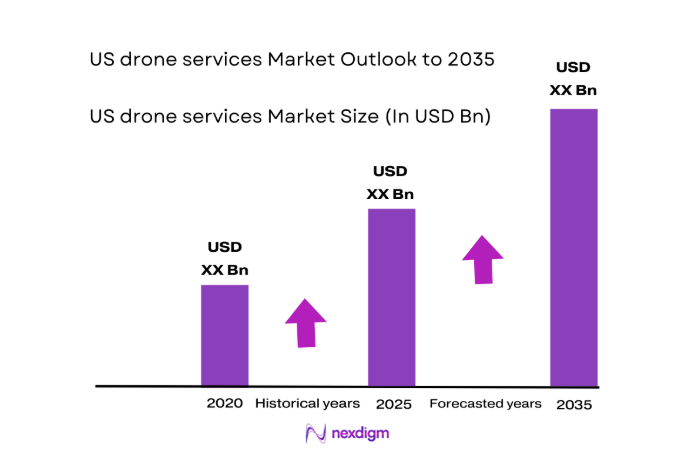
The US drone services market current size stands at around USD ~ million, reflecting sustained demand across commercial, public safety, and infrastructure inspection use cases. Service contracts bundle mission planning, compliant operations, data capture, and analytics delivery under enterprise governance. Commercial deployments emphasize inspection, mapping, surveillance, and emergency response. The operating model favors managed services with outcome-linked deliverables, standardized safety protocols, insured operations, and platform-agnostic fleets that reduce enterprise ownership burdens while improving utilization, reliability, and compliance across distributed sites nationwide.
Dominant demand concentrates in energy corridors, transport-intensive metros, coastal states with climate risk exposure, and logistics hubs with dense industrial assets. Cities with mature infrastructure digitization ecosystems, active public safety drone programs, and established innovation offices show faster adoption. Regions with supportive airspace coordination, state-level unmanned systems policies, and test corridors accelerate operational approvals. Clusters near advanced manufacturing, utilities, ports, and large construction pipelines exhibit higher utilization intensity due to recurring inspection cycles, safety mandates, and serviceable mission density supported by local operations centers.
Market Segmentation
By Service Type
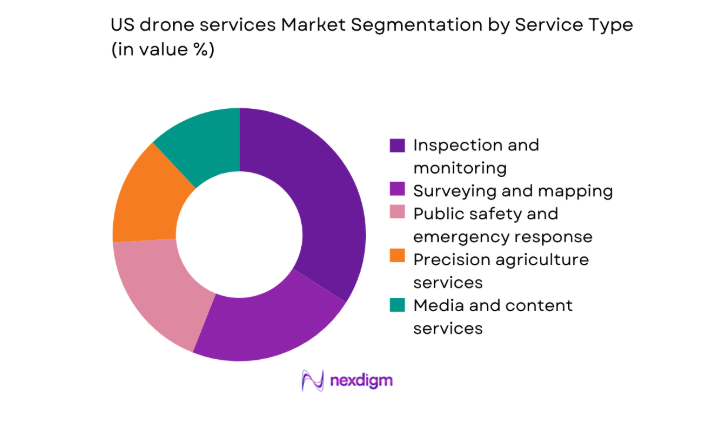
Inspection and monitoring services dominate due to recurring asset cycles, compliance-driven demand, and predictable utilization across utilities, transport, and industrial facilities. Enterprises prefer bundled offerings that integrate mission planning, compliant flight operations, data capture, and analytics delivery. Emergency response and surveying follow, supported by infrastructure modernization programs and public safety deployments. Media services remain episodic, while logistics pilots are constrained by operational approvals. Precision agriculture services expand with analytics integration, yet adoption varies by farm digitization maturity and seasonal utilization patterns that favor managed contracts over ownership-heavy operating models.
By End Use Industry
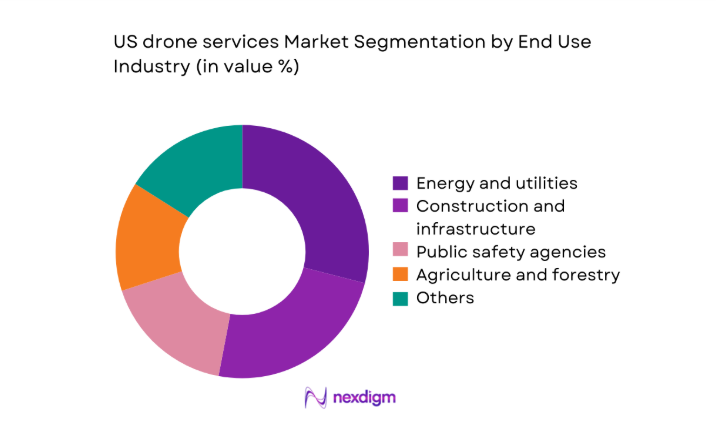
Energy and utilities lead due to asset density, safety mandates, and recurring inspection cycles across transmission corridors and generation sites. Construction and infrastructure follow, driven by progress monitoring, volumetrics, and compliance documentation embedded into project workflows. Public safety agencies adopt services for incident response and situational awareness, supported by municipal programs. Agriculture uptake is tied to analytics maturity and service reliability across seasons. Telecommunications expands with tower inspections, while logistics adoption remains pilot-heavy pending operational approvals and scalable airspace integration across urban corridors.
Competitive Landscape
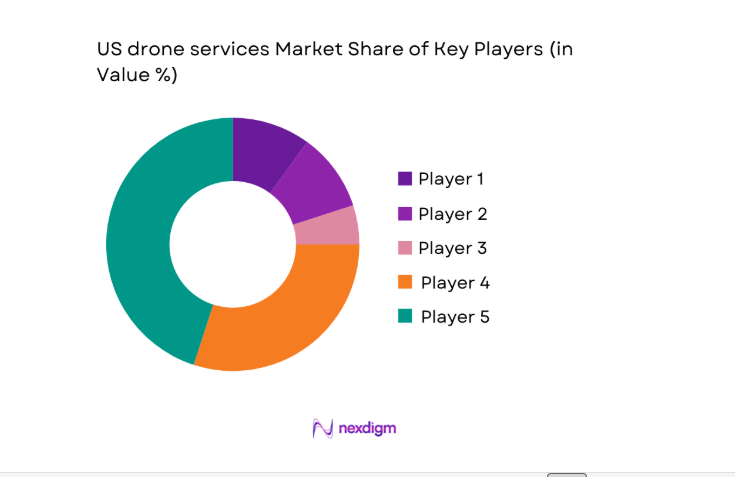
The competitive environment features national service providers with multi-city operations, complemented by regional specialists focused on utilities, construction, and public safety missions. Differentiation centers on regulatory readiness, BVLOS preparedness, analytics integration, safety records, and enterprise contracting depth. Providers increasingly bundle hardware-agnostic fleets with remote operations centers and standardized compliance playbooks to win multi-year managed service agreements.
| Company Name | Establishment Year | Headquarters | Formulation Depth | Distribution Reach | Regulatory Readiness | Service Capability | Channel Strength | Pricing Flexibility |
| DroneBase | 2014 | Los Angeles, CA | ~ | ~ | ~ | ~ | ~ | ~ |
| Measure | 2015 | Richmond, VA | ~ | ~ | ~ | ~ | ~ | ~ |
| SkySkopes | 2015 | Atlanta, GA | ~ | ~ | ~ | ~ | ~ | ~ |
| PrecisionHawk | 2013 | Raleigh, NC | ~ | ~ | ~ | ~ | ~ | ~ |
| Cyberhawk | 2008 | Houston, TX | ~ | ~ | ~ | ~ | ~ | ~ |
US drone services Market Analysis
Growth Drivers
Enterprise adoption of aerial inspection to reduce downtime
Utilities, transport agencies, and industrial operators expanded aerial inspection programs as safety compliance tightened and asset density increased. Federal safety bulletins issued in 2022 and 2023 emphasized proactive condition monitoring for transmission corridors and bridges. The Federal Highway Administration reported 617000 bridges in service in 2024, with 42000 classified for priority maintenance planning. State utility commissions approved expanded inspection cycles across 2023 and 2025. Severe weather events recorded 28 billion-dollar disasters in 2023 by federal agencies, increasing inspection frequency. Remote operations centers expanded in 2024, enabling multi-site scheduling. Workforce safety incidents declined as aerial methods replaced rope access and helicopters.
Infrastructure modernization and asset monitoring demand
Federal infrastructure programs accelerated field data capture requirements across transport, water, and energy assets. The Department of Transportation obligated 42100 projects in 2024 under multiyear programs, expanding inspection cadence. The Environmental Protection Agency tracked 90000 regulated water systems in 2025 requiring periodic condition documentation. Grid hardening initiatives advanced across 2023 and 2025 after wildfire seasons affecting 7 western states. State transportation agencies increased digital twin initiatives in 2024 to support lifecycle maintenance planning. Asset owners integrated aerial data into enterprise asset management platforms adopted by 36 states by 2025. Inspection backlogs documented in 2022 drove outsourcing to scalable service providers nationwide.
Challenges
Regulatory constraints on BVLOS and urban operations
Operational expansion remains constrained by airspace approvals and waiver processes. The FAA processed 2280 Part 107 waivers in 2024, with urban BVLOS approvals limited by detect-and-avoid readiness. UAS Traffic Management pilots covered 6 metropolitan areas in 2023, restricting scalability. Local ordinances across 19 cities introduced takeoff and landing constraints in 2022, complicating last-mile deployments. Public safety waivers improved in 2025 but commercial operations faced additional documentation cycles averaging 90 days. Weather minima standards updated in 2024 reduced allowable flight windows across coastal regions. Coordination with heliports and hospitals added operational friction for urban inspection missions.
Airspace integration and traffic management complexity
Mixed-use airspace integration challenges persist as crewed aviation density rises near urban corridors. The FAA recorded 457000 crewed operations per day in 2024 across controlled airspace, increasing deconfliction requirements. UTM trials in 2023 demonstrated latency constraints above 120 milliseconds for networked separation services in dense areas. Spectrum congestion incidents rose in 2025 during wildfire response operations across 4 states. Temporary flight restrictions averaged 1800 events in 2024, disrupting commercial scheduling. Interoperability standards across vendors matured unevenly between 2022 and 2025, increasing integration costs for service providers coordinating with airports and emergency operations centers.
Opportunities
Utility and energy sector inspection outsourcing
Grid hardening mandates and wildfire mitigation plans expanded outsourced aerial inspections across transmission corridors. State utility commissions in 2024 required vegetation management audits covering 120000 corridor miles nationally. Federal energy reliability guidance in 2023 emphasized proactive inspection of substations exceeding 500 critical nodes in high-risk regions. Severe heat days surpassed 30 annually across multiple states in 2025, stressing assets and increasing inspection frequency. Utilities integrated LiDAR and thermal datasets into asset platforms adopted by 41 utilities by 2024. Service providers offering BVLOS-ready operations and analytics integration gained preferred vendor status for multiyear maintenance cycles.
Rail, road, and bridge condition monitoring programs
Transportation agencies expanded digital inspection programs to address aging assets and safety mandates. The National Bridge Inventory in 2024 documented 617000 bridges with inspection intervals tightened for priority structures. Rail regulators increased corridor monitoring requirements across 2023 and 2025 after derailments in 2022 prompted safety reviews. State DOTs deployed remote inspection pilots across 12 corridors in 2024, enabling continuous condition tracking. Climate resilience funding in 2025 targeted coastal roadways across 8 states, increasing shoreline inspection cycles. Service providers integrating photogrammetry with asset management systems supported predictive maintenance workflows aligned to agency performance metrics.
Future Outlook
The market outlook through 2035 reflects expanding BVLOS approvals, broader UTM integration, and deeper analytics adoption across infrastructure, utilities, and public safety. Federal and state programs will continue embedding aerial data into asset management workflows. Urban operations are expected to normalize with detect-and-avoid maturity, while managed service contracts gain preference. Platform-agnostic fleets and remote operations centers will drive scalable coverage across multi-state portfolios.
Major Players
- DroneBase
- Measure
- SkySkopes
- Aerodyne Group
- PrecisionHawk
- Cyberhawk
- Airobotics
- American Robotics
- Skyports Drone Services
- Civdrone
- Sharper Shape
- HUVRdata
- DroneDeploy
- Phoenix Drone Services
- Terra Drone
Key Target Audience
- Energy and utilities asset owners
- Construction and infrastructure developers
- Transportation agencies and state DOTs
- Public safety departments and emergency management agencies
- Logistics and supply chain operators
- Telecommunications infrastructure owners
- Investments and venture capital firms
- Government and regulatory bodies with agency names including the Federal Aviation Administration and state transportation departments
Research Methodology
Step 1: Identification of Key Variables
Operational use cases, regulatory constraints, mission frequency, fleet utilization, analytics integration, and enterprise contracting structures were defined to frame demand drivers. Airspace approvals, BVLOS readiness, safety protocols, and service delivery models were mapped to segment adoption pathways.
Step 2: Market Analysis and Construction
Service categories, end-use workflows, and geographic demand clusters were structured to reflect procurement cycles and compliance requirements. Operating models, remote operations coverage, and data delivery standards were aligned to institutional adoption frameworks across utilities, transport, and public safety.
Step 3: Hypothesis Validation and Expert Consultation
Assumptions on BVLOS scaling, UTM interoperability, and analytics maturity were validated through practitioner interviews with operators, safety officers, and procurement leaders. Regulatory interpretations and operational constraints were reconciled with evolving airspace policies and field deployment practices.
Step 4: Research Synthesis and Final Output
Insights were synthesized into decision-ready frameworks linking regulation, operations, and analytics to adoption outcomes. Findings were stress-tested against institutional indicators, policy trajectories, and infrastructure programs to ensure practical relevance for buyers and providers.
- Executive Summary
- Research Methodology (Market Definitions and service scope alignment, FAA Part 107 operator data triangulation, Enterprise drone fleet survey interviews, Federal and state procurement contract mining, Commercial operator revenue benchmarking, Mission-type utilization modeling, Regulatory and airspace constraint impact analysis)
- Definition and Scope
- Market evolution
- Usage pathways and mission profiles
- Ecosystem structure
- Service delivery and channel structure
- Regulatory environment

- Growth Drivers
Enterprise adoption of aerial inspection to reduce downtime
Infrastructure modernization and asset monitoring demand
Rising public safety and disaster response utilization
Cost efficiency versus manned aerial services
Advances in autonomous flight and AI analytics
Expanding FAA waivers enabling BVLOS operations - Challenges
Regulatory constraints on BVLOS and urban operations
Airspace integration and traffic management complexity
Data privacy and security concerns among enterprises
Weather sensitivity and operational reliability
High insurance and liability costs
Fragmented service quality across provider - Opportunities
Utility and energy sector inspection outsourcing
Rail, road, and bridge condition monitoring programs
Agricultural analytics and precision spraying services
Smart city surveillance and traffic monitoring
Disaster recovery and climate resilience programs
Drone-as-a-service contracts for mid-market enterprises - Trends
Shift toward BVLOS and remote operations centers
Integration of AI and computer vision analytics
Hybrid VTOL adoption for corridor inspections
Bundling of hardware, software, and services
Subscription-based enterprise service models
Growth of public safety drone programs - Government Regulations
- SWOT Analysis
- Stakeholder and Ecosystem Analysis
- Porter’s Five Forces Analysis
- Competition Intensity and Ecosystem Mapping
- By Value, 2020–2025
- By Volume, 2020–2025
- By Active Systems, 2020–2025
- By Revenue per Mission, 2020–2025
- By Service Type (in Value %)
Aerial imaging and videography
Surveying and mapping
Inspection and monitoring
Security and surveillance
Precision agriculture services
Logistics and last-mile delivery
Emergency response and disaster assessment - By End Use Industry (in Value %)
Construction and infrastructure
Energy and utilities
Agriculture and forestry
Public safety and defense agencies
Media and entertainment
Logistics and e-commerce
Telecommunications - By Platform Type (in Value %)
Multi-rotor drones
Fixed-wing drones
Hybrid VTOL drones - By Operational Mode (in Value %)
On-demand service contracts
Long-term managed service agreements
Project-based deployments
Outcome-based service models - By Geography within the US (in Value %)
Northeast
Midwest
South
West
- Market structure and competitive positioning
Market share snapshot of major players - Cross Comparison Parameters (geographic coverage, service portfolio breadth, regulatory compliance capabilities, BVLOS readiness, analytics and software integration, enterprise contract depth, public safety specialization, pricing flexibility)
- SWOT Analysis of Key Players
- Pricing and Commercial Model Benchmarking
- Detailed Profiles of Major Companies
DroneBase
Measure
SkySkopes
Aerodyne Group
PrecisionHawk
Cyberhawk
Airobotics
American Robotics
Skyports Drone Services
Civdrone
Sharper Shape
HUVRdata
DroneDeploy
Phoenix Drone Services
Terra Drone
- Demand and utilization drivers
- Procurement and tender dynamics
- Buying criteria and vendor selection
- Budget allocation and financing preferences
- Implementation barriers and risk factors
- Post-purchase service expectations
- By Value, 2026–2035
- By Volume, 2026–2035
- By Active Systems, 2026–2035
- By Revenue per Mission, 2026–2035


 Request a Sample
 Ask for Customization
 Get a Quote
 Enquire Now