
 Download PDF
 Download PDF
Market Overview
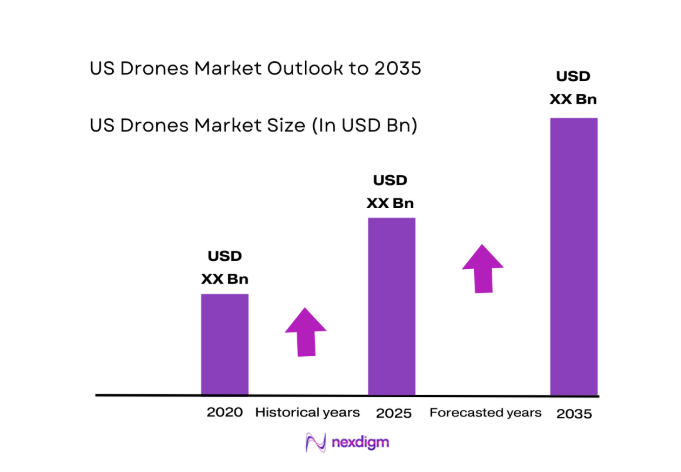
The US Drones market current size stands at around USD ~ million, reflecting strong institutional adoption across commercial inspection, public safety, and defense applications. Demand concentration is driven by operational use cases such as asset monitoring, emergency response, and logistics pilots, supported by maturing platform reliability and integrated software ecosystems. Procurement cycles increasingly favor compliant platforms and secure data handling, reinforcing structured vendor qualification and long-term service models across regulated operational environments.
Dominant activity clusters around metropolitan regions with dense infrastructure, critical utilities, ports, and logistics hubs, where operational efficiency gains are most material. Advanced airspace management capabilities, proximity to innovation corridors, and established integrator networks accelerate deployment. Policy environments with clearer pathways for beyond-visual-line-of-sight operations enable faster scaling of inspection and monitoring programs. Mature service ecosystems and proximity to component suppliers further concentrate adoption within regions hosting aerospace, defense, and advanced manufacturing footprints.
Market Segmentation
By Platform Type
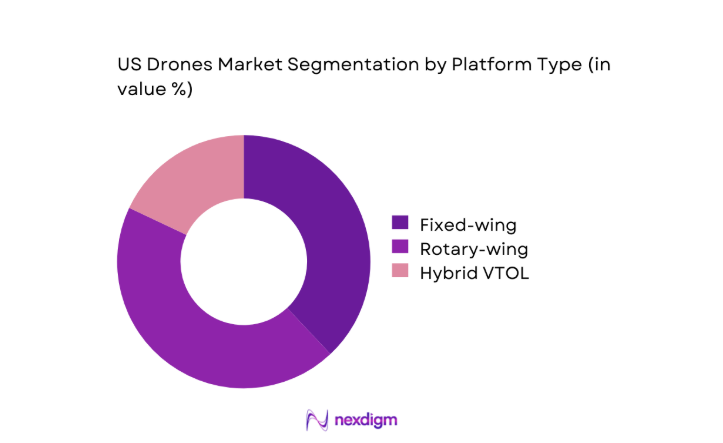
Fixed-wing and hybrid VTOL platforms account for a larger share of commercial and government deployments due to superior endurance, coverage efficiency, and suitability for corridor inspections and rural operations. Rotary-wing systems dominate short-range inspection and public safety use cases where maneuverability and rapid deployment are critical. Platform selection is increasingly influenced by mission duration, payload compatibility, and regulatory clearance pathways for beyond-visual-line-of-sight operations. Hybrid VTOL platforms gain traction in utility inspections and mapping due to runway independence combined with fixed-wing efficiency. Standardization of docking interfaces and autonomous navigation further shapes platform preferences among fleet operators seeking scalable operations.
By Application
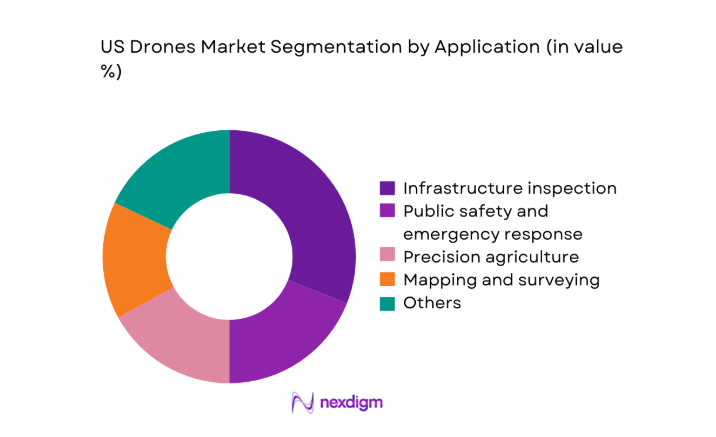
Infrastructure inspection and mapping represent the most consistent deployment volumes due to recurring maintenance cycles and safety mandates across utilities, transportation, and construction assets. Public safety and emergency response maintain steady utilization driven by situational awareness needs and rapid deployment advantages. Precision agriculture adoption grows through seasonal demand patterns and data-driven crop management workflows. Media and surveying applications sustain demand through project-based deployments, while logistics pilots expand selectively where regulatory permissions and docking infrastructure exist. Application selection is increasingly shaped by software analytics maturity, integration with asset management systems, and operational readiness for autonomous workflows.
Competitive Landscape
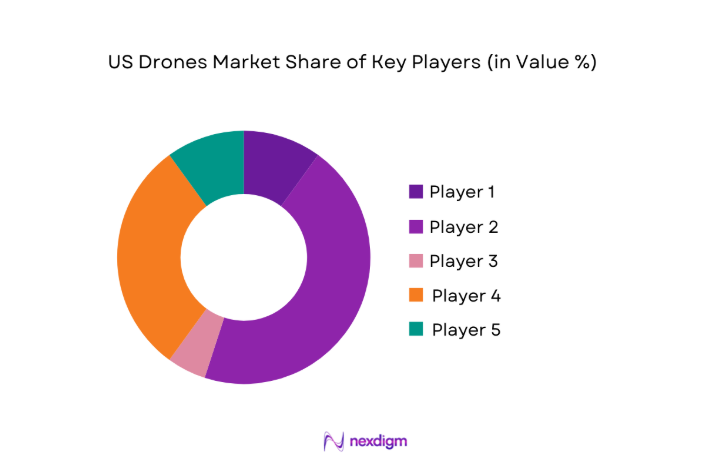
The competitive environment is characterized by a mix of platform manufacturers, autonomous operations providers, and software-centric ecosystem players, with differentiation driven by regulatory readiness, autonomy depth, and service coverage across enterprise and public sector deployments.
| Company Name | Establishment Year | Headquarters | Formulation Depth | Distribution Reach | Regulatory Readiness | Service Capability | Channel Strength | Pricing Flexibility |
| DJI | 2006 | Shenzhen | ~ | ~ | ~ | ~ | ~ | ~ |
| Skydio | 2014 | San Mateo | ~ | ~ | ~ | ~ | ~ | ~ |
| AeroVironment | 1971 | Arlington | ~ | ~ | ~ | ~ | ~ | ~ |
| Parrot | 1994 | Paris | ~ | ~ | ~ | ~ | ~ | ~ |
| Zipline | 2014 | South San Francisco | ~ | ~ | ~ | ~ | ~ | ~ |
US Drones Market Analysis
Growth Drivers
Rising adoption for infrastructure inspection and asset management
Utility and transportation agencies expanded drone operations to inspect bridges, substations, and pipelines as asset counts exceeded 120000 miles of transmission corridors and 620000 bridges nationwide. Inspection backlogs reported in 2024 led agencies to increase flight authorizations to 42000 monthly operations, supported by 2025 approvals for 180 new beyond-visual-line-of-sight corridors. Workforce constraints, with 23000 certified inspectors retiring by 2025, accelerated reliance on aerial data capture. Federal infrastructure programs authorized 1400 project permits requiring routine aerial surveys, and aviation authorities issued 96 waivers for automated operations. These indicators anchor sustained operational demand without disclosing market size.
Advances in autonomy, AI vision, and edge computing
Autonomous navigation accuracy improved as onboard processors achieved 120 tera-operations per second in 2024, enabling real-time obstacle avoidance across dense infrastructure. Computer vision models trained on 48 million labeled frames improved defect detection in concrete and steel assets, reducing rework cycles from 21 days to 9 days in 2025 programs. Edge inference latency fell to 38 milliseconds, supporting safe flight near critical facilities. Aviation authorities validated 27 autonomous operational concepts in controlled corridors during 2025. Public sector digitization programs mandated machine-readable inspection records across 6400 assets, accelerating integration of AI-enabled workflows.
Challenges
FAA airspace restrictions and BVLOS approval bottlenecks
Operational scaling remains constrained by limited beyond-visual-line-of-sight corridors, with only 180 approved routes available nationwide by 2025. Processing times for operational waivers averaged 142 days in 2024, delaying project mobilization across 320 active utility programs. Airspace congestion near 85 major airports restricts routine operations within 5-mile perimeters, affecting inspections for 410 facilities. Coordination requirements with 96 local authorities add procedural complexity. Incident reporting thresholds mandate documentation within 24 hours for any deviation, increasing compliance overhead for 1400 licensed operators. These constraints slow fleet utilization rates without indicating overall market size.
Supply chain dependence on imported components
Critical components such as inertial sensors and image processors rely on offshore fabrication, with 64 percent of high-performance modules sourced internationally in 2024. Geopolitical trade controls introduced 17 new licensing requirements affecting avionics imports during 2025, extending lead times from 28 days to 61 days for integrators. Compliance audits expanded to 420 procurement programs, requiring component traceability across 9 tiers of suppliers. Manufacturing requalification cycles averaged 11 months for alternative parts, disrupting fleet standardization across 260 enterprise operators. These structural dependencies elevate operational risk without revealing total market scale.
Opportunities
Scale-up of BVLOS-enabled commercial operations
Regulatory pilots authorized 180 BVLOS corridors by 2025, covering 2600 route-miles suitable for utility inspection and pipeline monitoring. Institutional demand is reinforced by 1400 federally funded infrastructure projects mandating aerial documentation and digital twins. Workforce shortages, with 23000 inspector retirements recorded by 2025, create sustained reliance on autonomous operations. Communications standards enabling detect-and-avoid functions achieved 99.98 availability across 42 trial networks in 2024. State-level mobility programs designated 27 operational zones for routine flights, establishing repeatable deployment pathways and enabling scalable service models anchored to institutional indicators.
Growth in drone-in-a-box and dock-based inspection systems
Automated docking stations expanded across 860 utility sites in 2024, enabling scheduled missions without on-site pilots. Mean time between maintenance increased to 410 flight hours as weather-hardened enclosures matured. Remote operations centers consolidated oversight across 12 regional hubs, supervising 320 concurrent flights in 2025. Network uptime exceeded 99.9 across 14 states following deployment of redundant backhaul links. Institutional procurement frameworks approved unattended operations at 96 critical facilities, enabling persistent monitoring. These operational benchmarks signal scalable growth potential grounded in infrastructure readiness and institutional approvals rather than market size disclosures.
Future Outlook
Future growth will be shaped by clearer regulatory pathways for routine beyond-visual-line-of-sight operations and the expansion of autonomous inspection corridors across multiple states. Integration with digital twins and asset management platforms will deepen enterprise value. Localized component manufacturing and secure supply chains will strengthen resilience. Public safety and infrastructure programs will anchor stable demand through 2035.
Major Players
- DJI
- Skydio
- AeroVironment
- Parrot
- Autel Robotics
- Zipline
- Wing
- Anduril Industries
- Insitu
- BRINC Drones
- AgEagle Aerial Systems
- DroneDeploy
- Percepto
- American Robotics
- Teledyne FLIR
Key Target Audience
- Utilities and critical infrastructure operators
- Construction and engineering firms
- Public safety agencies including police and fire departments
- Defense and homeland security agencies including the Department of Homeland Security
- Transportation authorities including state departments of transportation
- Logistics and supply chain operators
- Investments and venture capital firms
- Government and regulatory bodies including the Federal Aviation Administration
Research Methodology
Step 1: Identification of Key Variables
Core variables were defined across platform types, autonomy levels, payload classes, regulatory permissions, and operational workflows. Data fields captured deployment frequency, compliance readiness, and integration with asset management systems. Indicators aligned to institutional programs and infrastructure deployment contexts.
Step 2: Market Analysis and Construction
The market structure was constructed by mapping use cases across infrastructure, public safety, agriculture, and logistics. Operational readiness benchmarks, corridor availability, and compliance pathways were synthesized to define addressable application clusters and adoption maturity tiers.
Step 3: Hypothesis Validation and Expert Consultation
Hypotheses on autonomy adoption and corridor scalability were validated through structured consultations with operators, regulators, and integrators. Program documentation and operational pilots were reviewed to verify deployment constraints and workflow maturity across regulated environments.
Step 4: Research Synthesis and Final Output
Findings were synthesized into thematic insights covering drivers, challenges, and opportunities. Cross-validation ensured internal consistency across regulatory, operational, and technology indicators, producing actionable insights aligned to current institutional conditions.
- Executive Summary
- Research Methodology (Market Definitions and platform classification standards, Primary interviews with UAS manufacturers and integrators, Surveys of commercial fleet operators and public safety agencies, FAA registry data and waiver analysis, Import-export and shipment tracking of UAV components, Competitive intelligence from contracts and program awards)
- Definition and Scope
- Market evolution
- Usage pathways across commercial, defense, and consumer segments
- Ecosystem structure
- Supply chain and channel structure
- Regulatory environment

- Growth Drivers
Rising adoption for infrastructure inspection and asset management
Expansion of precision agriculture and crop analytics use cases
Increased public safety and emergency response deployments
Defense and homeland security modernization programs
Falling hardware costs and improving sensor performance
Advances in autonomy, AI vision, and edge computing - Challenges
FAA airspace restrictions and BVLOS approval bottlenecks
Cybersecurity and data privacy risks
Limited battery life and payload endurance constraints
Supply chain dependence on imported components
Workforce shortages in certified pilots and UAS operations
Public acceptance and safety concerns in urban operations - Opportunities
Scale-up of BVLOS-enabled commercial operations
Growth in drone-in-a-box and dock-based inspection systems
Integration with digital twins and asset management platforms
Urban air mobility corridors for inspection and logistics trials
Federal and state funding for smart infrastructure monitoring
Localization of component manufacturing and secure supply chains - Trends
Rapid growth of autonomous inspection workflows
Docked drone stations for continuous monitoring
AI-driven analytics and real-time anomaly detection
Shift toward NDAA-compliant platforms for government buyers
Subscription-based software and data services bundling
Convergence of drones with robotics and ground sensors - Government Regulations
- SWOT Analysis
- Stakeholder and Ecosystem Analysis
- Porter’s Five Forces Analysis
- Competition Intensity and Ecosystem Mapping
- By Value, 2020–2025
- By Shipment Volume, 2020–2025
- By Active Systems, 2020–2025
- By Average Selling Price, 2020–2025
- By Platform Type (in Value %)
Fixed-wing
Rotary-wing
Hybrid VTOL - By Application (in Value %)
Aerial photography and videography
Infrastructure inspection
Precision agriculture
Public safety and emergency response
Defense and homeland security
Mapping and surveying - By Payload Type (in Value %)
RGB cameras
Thermal sensors
Multispectral and hyperspectral sensors
LiDAR payloads
Delivery payload modules - By End Use Industry (in Value %)
Construction and infrastructure
Energy and utilities
Agriculture
Public safety and government
Media and entertainment
Logistics and delivery - By Autonomy Level (in Value %)
Remotely piloted
Semi-autonomous
Fully autonomous - By Sales Channel (in Value %)
Direct sales to enterprises and government
System integrators and VARs
Online and retail channels
- Market structure and competitive positioning
Market share snapshot of major players - Cross Comparison Parameters (Platform breadth, Autonomy and BVLOS readiness, Sensor and payload ecosystem, NDAA compliance status, Software and analytics capabilities, Pricing and total cost of ownership, Service and support footprint, Government contract track record)
- SWOT Analysis of Key Players
- Pricing and Commercial Model Benchmarking
- Detailed Profiles of Major Companies
DJI
Skydio
AeroVironment
Teledyne FLIR
Parrot
Autel Robotics
Zipline
Wing
Anduril Industries
Insitu
BRINC Drones
AgEagle Aerial Systems
DroneDeploy
Percepto
American Robotics
- Demand and utilization drivers
- Procurement and tender dynamics
- Buying criteria and vendor selection
- Budget allocation and financing preferences
- Implementation barriers and risk factors
- Post-purchase service expectations
- By Value, 2026–2035
- By Shipment Volume, 2026–2035
- By Active Systems, 2026–2035
- By Average Selling Price, 2026–2035


 Request a Sample
 Ask for Customization
 Get a Quote
 Enquire Now