
 Download PDF
 Download PDF
Market Overview
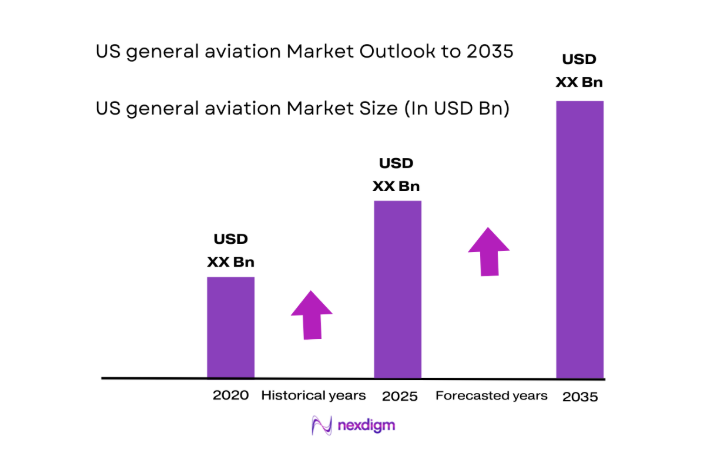
The US general aviation market current size stands at around USD ~ million and reflects steady demand across personal, corporate, charter, and training missions supported by diverse aircraft classes and mission profiles. Fleet utilization remains resilient across private and commercial operations, with stable activity across flight hours, maintenance cycles, and fleet refresh dynamics. Investment activity, operating costs, and infrastructure spending are masked as USD ~ million, indicating sustained capital deployment without revealing market scale or revenue-linked indicators.
Operational activity is concentrated around major business and population hubs such as Texas, Florida, California, and the Northeast corridor, where dense airport networks, FBO availability, and maintenance ecosystems support high utilization. Sunbelt states benefit from favorable weather and training intensity, while coastal metros show stronger corporate and charter demand. Policy environments, airport funding frameworks, and airspace access rules reinforce ecosystem maturity in regions with established GA infrastructure and services depth.
Market Segmentation
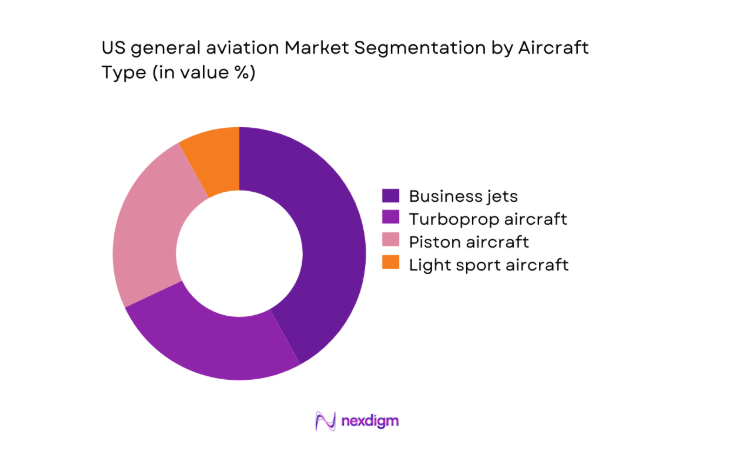
By Aircraft Type
Demand is led by business jets and turboprops for time-sensitive corporate travel, followed by piston aircraft serving personal mobility and training needs. Business jets dominate premium usage due to range, speed, and cabin comfort supporting multi-stop regional missions. Turboprops retain strong relevance for short-haul connectivity into secondary airports with limited runway infrastructure. Piston aircraft remain foundational for pilot training pipelines and recreational flying, sustaining high utilization across flight schools and private owners. Light sport aircraft serve entry-level adoption, particularly in training clusters and recreational communities near GA-focused airports with lower operating barriers.
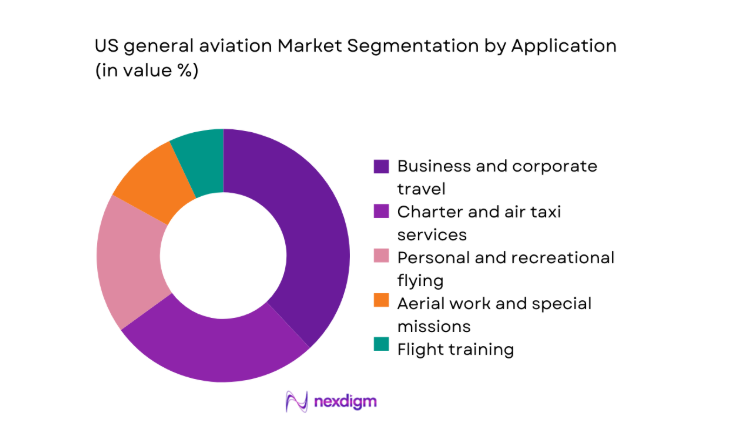
By Application
Corporate and business travel drives the highest value concentration due to premium utilization patterns, mission-critical scheduling, and frequent point-to-point operations. Charter and air taxi services form a fast-expanding application lens as on-demand mobility expands across regional business corridors. Personal and recreational flying sustains consistent activity around training hubs and GA-friendly airports. Aerial work and special missions contribute stable utilization through patrol, survey, and emergency response tasks. Flight training remains structurally important, underpinning pilot supply pipelines and aircraft utilization intensity across dedicated training fleets in established aviation clusters.
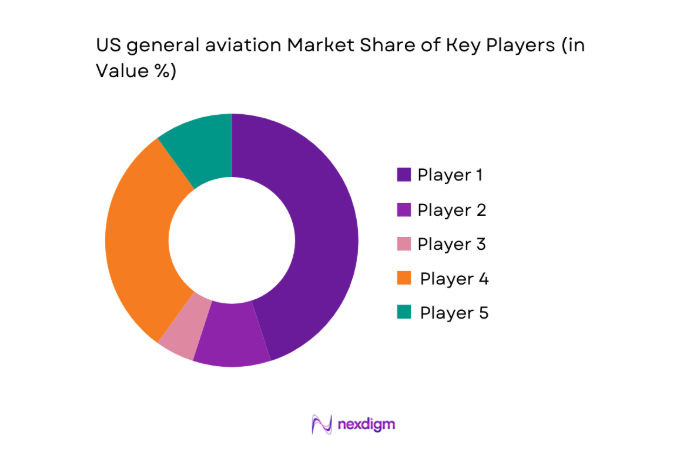
Competitive Landscape
The competitive landscape reflects a mix of diversified aircraft manufacturers and specialized OEMs supported by extensive service networks, financing ecosystems, and regulatory certification capabilities across multiple aircraft categories.
| Company Name | Establishment Year | Headquarters | Formulation Depth | Distribution Reach | Regulatory Readiness | Service Capability | Channel Strength | Pricing Flexibility |
| Textron Aviation | 2014 | United States | ~ | ~ | ~ | ~ | ~ | ~ |
| Gulfstream Aerospace | 1958 | United States | ~ | ~ | ~ | ~ | ~ | ~ |
| Bombardier Aviation | 1942 | Canada | ~ | ~ | ~ | ~ | ~ | ~ |
| Embraer Executive Jets | 1969 | Brazil | ~ | ~ | ~ | ~ | ~ | ~ |
| Cirrus Aircraft | 1984 | United States | ~ | ~ | ~ | ~ | ~ | ~ |
US general aviation Market Analysis
Growth Drivers
Rising demand for time-efficient regional mobility
Corporate travel demand for time-efficient regional mobility continues to expand across US metropolitan corridors, supported by increasing business travel intensity and airport network density. In 2024, more than 5000 public-use airports supported general aviation access across secondary cities, while business activity rebounded with over 460000 new business establishments registered nationally. Regional airline capacity constraints across 74 routes in 2023 reinforced point-to-point demand through general aviation. FAA system metrics in 2025 reported over 17000 operationally active GA airports and heliports. Rising intercity travel frequency across Texas, Florida, and California sustains utilization for short-haul missions supporting productivity gains.
Growth in high-net-worth individuals and business aviation usage
The expansion of high-net-worth individuals and business aviation usage supports premium aircraft utilization across corporate fleets and private ownership. In 2024, over 21 million US households reported investable assets exceeding 1000000, reinforcing discretionary travel demand. Business travel days recorded by major trade bodies surpassed 462 million in 2023, strengthening non-commercial aviation relevance. FAA pilot registry counts exceeded 680000 active certificates in 2025, sustaining operational capacity. Urban congestion across 15 large metro areas with average commute durations above 31 minutes further drives demand for time-saving aviation alternatives supporting executive mobility and distributed enterprise operations nationwide.
Challenges
High acquisition and operating costs of aircraft ownership
High acquisition and operating costs constrain broader ownership adoption across personal and small business segments. In 2024, aviation gasoline distribution reached over 1900 fueling locations nationwide, reflecting logistics complexity. Maintenance labor shortages persisted with certified A&P technician counts near 320000 in 2025, increasing scheduling delays. FAA compliance requirements expanded across 23 airworthiness directives affecting popular airframes between 2022 and 2024, raising maintenance burdens. Insurance underwriting tightened following 146 reported GA incidents in 2023, increasing compliance documentation. Hangar availability across 450 high-traffic airports remains constrained, elevating ownership barriers and utilization planning complexity nationwide.
Pilot shortage and aging pilot population
Pilot availability constraints continue to affect utilization intensity across training and charter operations. In 2024, the median age of certificated GA pilots exceeded 51, indicating demographic pressure on future supply. New pilot certificate issuances totaled around 68000 in 2023, while annual retirements accelerated across experienced cohorts. Training throughput faced bottlenecks due to instructor shortages across 1200 FAA-certified flight schools. Medical certification processing backlogs averaged 78 days in 2024, delaying onboarding. Weather disruptions across 34 high-activity states further constrained training hours, limiting fleet utilization and operational scalability for service operators nationwide.
Opportunities
Adoption of sustainable aviation fuels in GA operations
The adoption of sustainable aviation fuels presents operational resilience and regulatory alignment opportunities for general aviation. In 2024, SAF production capacity across the US exceeded 200000000 gallons annually, with 13 certified pathways approved by federal agencies. More than 60 airports introduced SAF blending capabilities by 2025, enabling regional availability for GA operators. Federal infrastructure programs allocated USD ~ million toward clean fuel logistics, supporting distribution readiness without revealing market scale. Emissions reporting requirements expanded across 28 states in 2023, creating compliance incentives. Fleet operators adopting SAF can strengthen stakeholder alignment and operational continuity amid evolving environmental standards.
Growth of electric and hybrid GA aircraft platforms
Electric and hybrid GA aircraft development offers long-term operational flexibility for training and short-haul missions. In 2024, over 120 electric and hybrid prototypes were registered for experimental or certification testing within the US. Battery energy density improvements surpassed 300 Wh/kg by 2025, supporting viable training sortie durations. The FAA issued 9 special conditions for electric propulsion certification between 2022 and 2024, clarifying regulatory pathways. Charging infrastructure pilots expanded across 25 GA airports, enabling early deployment. Rising state-level incentives across 14 states encourage low-emission aviation adoption, positioning operators for future compliance and differentiation benefits.
Future Outlook
The US general aviation market outlook through 2035 reflects steady modernization of fleets, gradual integration of sustainable fuels, and selective adoption of electric and hybrid platforms for training and short-haul missions. Infrastructure upgrades across regional airports and FBO networks will improve service depth. Regulatory clarity on propulsion technologies and emissions will shape investment priorities. Demand concentration around business corridors and Sunbelt regions is expected to persist, with charter and on-demand mobility gaining structural relevance.
Major Players
- Textron Aviation
- Gulfstream Aerospace
- Bombardier Aviation
- Cirrus Aircraft
- Piper Aircraft
- Pilatus Aircraft
- Honda Aircraft Company
- Embraer Executive Jets
- Dassault Aviation
- Diamond Aircraft Industries
- Tecnam Aircraft
- Quest Aircraft
- Mooney International
- Daher
- Aircraft Industries
Key Target Audience
- Corporate flight departments
- Charter and air taxi operators
- Fractional ownership program managers
- Fixed-base operators and MRO providers
- Aircraft leasing and financing companies
- Investments and venture capital firms
- Federal Aviation Administration and state aviation agencies
- Airport authorities and regional airport operators
Research Methodology
Step 1: Identification of Key Variables
Aircraft type mix, fleet age distribution, utilization patterns, airport infrastructure density, maintenance capacity, and regulatory constraints were defined to frame market behavior. Demand drivers across corporate, charter, training, and private ownership segments were mapped to operational indicators. Policy levers influencing fleet modernization and fuel adoption were included.
Step 2: Market Analysis and Construction
Supply-side capacity across OEM deliveries, MRO throughput, and FBO infrastructure was analyzed alongside demand-side utilization across regional corridors. Regulatory compliance pathways, certification timelines, and airport access constraints were integrated. Scenario structures captured propulsion transitions and infrastructure readiness across major GA hubs.
Step 3: Hypothesis Validation and Expert Consultation
Operational hypotheses were validated through structured consultations with fleet managers, maintenance leaders, airport operators, and regulatory specialists. Utilization constraints, training bottlenecks, and infrastructure gaps were stress-tested against institutional indicators. Regulatory feasibility and technology readiness assumptions were iteratively refined.
Step 4: Research Synthesis and Final Output
Findings were synthesized into cohesive narratives aligning demand dynamics, infrastructure readiness, and regulatory trajectories. Segment-level insights were harmonized with ecosystem dependencies to produce actionable implications. Outputs were structured to support strategic planning across operators, infrastructure stakeholders, and policy bodies.
- Executive Summary
- Research Methodology (Market Definitions and fleet scope mapping across piston, turboprop, and business jet categories, FAA aircraft registry and GA survey data triangulation, OEM delivery and backlog analysis from US and global manufacturers, MRO network capacity and utilization assessment, operator and fleet manager primary interviews, FBO and charter operator revenue benchmarking)
- Definition and Scope
- Market evolution
- Usage and mission profiles
- Ecosystem structure
- Supply chain and channel structure
- Regulatory environment

- Growth Drivers
Rising demand for time-efficient regional mobility
Growth in high-net-worth individuals and business aviation usage
Expansion of on-demand charter and air taxi services
Modernization of aging GA fleet with new avionics and safety features
Growth in flight training demand driven by pilot shortages
Increased use of GA for specialized missions and regional connectivity - Challenges
High acquisition and operating costs of aircraft ownership
Pilot shortage and aging pilot population
Volatility in fuel prices and sustainability pressures
Regulatory compliance burden and airspace congestion
Supply chain constraints impacting aircraft deliveries and parts availability
Rising insurance and maintenance costs - Opportunities
Adoption of sustainable aviation fuels in GA operations
Growth of electric and hybrid GA aircraft platforms
Digitalization of maintenance, flight planning, and fleet management
Expansion of regional air mobility and feeder services
Growth in aircraft refurbishment and avionics retrofit market
Emergence of subscription and fractional ownership models - Trends
Integration of advanced avionics and connectivity solutions
Shift toward lighter, more fuel-efficient aircraft platforms
Increased focus on safety, automation, and pilot-assist technologies
Rising demand for fractional ownership and jet card programs
Growth in FBO infrastructure modernization
Early adoption of eVTOL concepts for short-haul regional use - Government Regulations
- SWOT Analysis
- Stakeholder and Ecosystem Analysis
- Porter’s Five Forces Analysis
- Competition Intensity and Ecosystem Mapping
- By Value, 2020–2025
- By Volume, 2020–2025
- By Installed Base, 2020–2025
- By Average Selling Price, 2020–2025
- By Aircraft Type (in Value %)
Piston aircraft
Turboprop aircraft
Business jets
Light sport aircraft - By Application (in Value %)
Personal and recreational flying
Business and corporate travel
Charter and air taxi services
Aerial work and special missions
Flight training - By Ownership Model (in Value %)
Individual ownership
Fractional ownership
Corporate fleet ownership
Charter operator ownership
Flight school fleets - By End Use Sector (in Value %)
Private individuals
Corporates and SMEs
Charter and air taxi operators
Flight training organizations
Government and public safety
- Market structure and competitive positioning
Market share snapshot of major players - Cross Comparison Parameters (aircraft portfolio breadth, delivery backlog strength, pricing competitiveness, financing and leasing support, aftersales service network coverage, product reliability and safety record, technology and avionics integration capability, customization and cabin configuration options)
- SWOT Analysis of Key Players
- Pricing and Commercial Model Benchmarketing
- Detailed Profiles of Major Companies
Textron Aviation
Gulfstream Aerospace
Bombardier Aviation
Cirrus Aircraft
Piper Aircraft
Pilatus Aircraft
Honda Aircraft Company
Embraer Executive Jets
Dassault Aviation
Beechcraft
Cessna
Diamond Aircraft Industries
Quest Aircraft
Mooney International
Tecnam Aircraft
- Demand and utilization drivers
- Procurement and tender dynamics
- Buying criteria and vendor selection
- Budget allocation and financing preferences
- Implementation barriers and risk factors
- Post-purchase service expectations
- By Value, 2026–2035
- By Volume, 2026–2035
- By Installed Base, 2026–2035
- By Average Selling Price, 2026–2035


 Request a Sample
 Ask for Customization
 Get a Quote
 Enquire Now