
 Download PDF
Market Overview
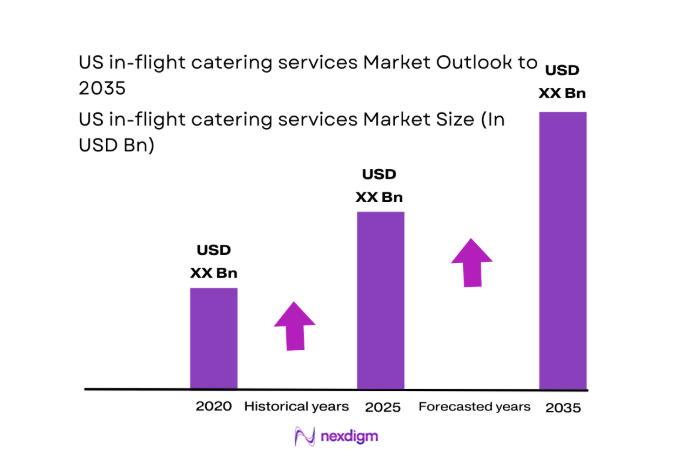
The US in-flight catering services market current size stands at around USD ~ million, reflecting steady demand from commercial aviation operations supported by dense airport infrastructure and multi-hub airline networks. Service provision spans hot meal preparation, beverage logistics, special dietary handling, and onboard retail provisioning, supported by specialized cold-chain systems and airside catering facilities. The market structure is shaped by long-term airline contracts, safety-compliant food handling protocols, and operational integration with flight turnaround cycles.
Operations are concentrated around major aviation hubs such as Atlanta, Dallas–Fort Worth, Chicago O’Hare, Los Angeles, New York JFK, and Miami, where high flight frequencies, wide-body traffic, and international connectivity sustain large-scale catering ecosystems. These locations benefit from mature commissary infrastructure, skilled labor pools, established airport concession frameworks, and strong coordination with airport authorities and security agencies, enabling reliable service continuity across domestic and international route networks.
Market Segmentation
By Service Type
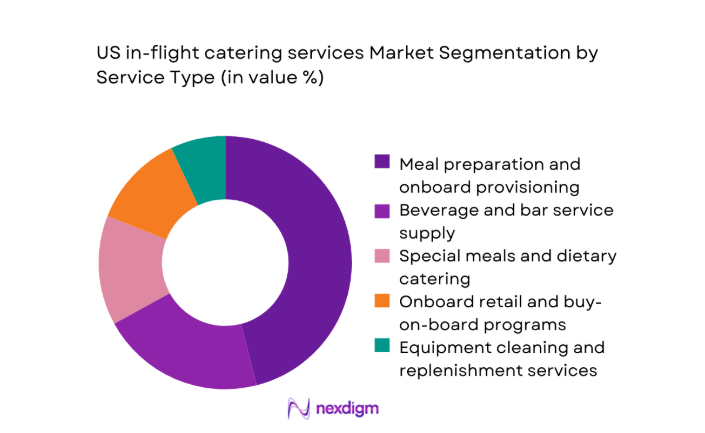
Meal preparation and onboard provisioning dominates service demand as airlines prioritize standardized meal consistency, food safety compliance, and tight turnaround coordination across hub airports. Beverage and bar supply remains operationally significant for long-haul and premium cabins, while special meals and dietary catering are expanding due to health-conscious and cultural preference trends. Onboard retail provisioning has grown through pre-order and buy-on-board programs, supporting ancillary revenue strategies. Equipment cleaning and replenishment services remain essential for hygiene compliance and aircraft readiness, but contribute comparatively lower strategic differentiation than food production and menu management functions across major hub networks.
By Airline Type
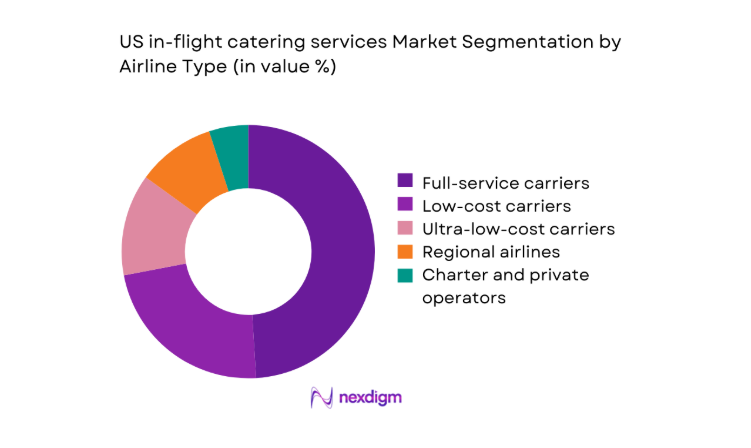
Full-service carriers account for dominant demand due to premium cabin offerings, international route complexity, and multi-course meal service requirements. Low-cost and ultra-low-cost carriers emphasize standardized provisioning and retail-focused models, supporting predictable volumes with limited menu complexity. Regional airlines contribute steady demand through feeder networks linked to hub airports, while charter and private operators maintain niche requirements centered on customization and flexible scheduling. The mix reflects divergent service depth, cost structures, and operational models that shape procurement strategies and contract durations across airline categories operating within the US aviation ecosystem.
Competitive Landscape
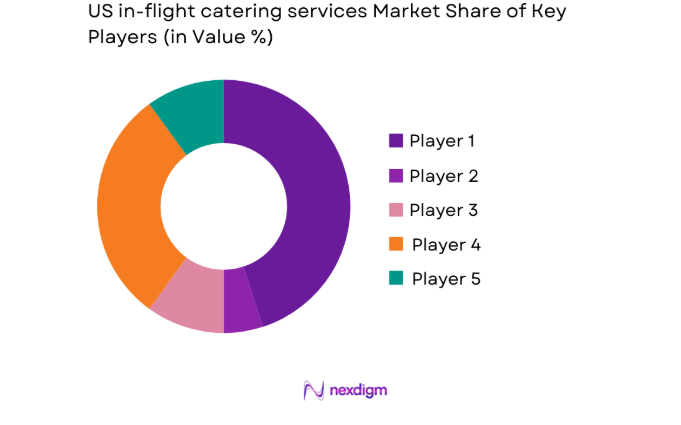
The competitive landscape is shaped by airport-centric operational footprints, long-term airline service contracts, and differentiated capabilities in menu innovation, cold-chain logistics, and regulatory compliance. Competitive positioning depends on hub coverage depth, ability to manage peak departure waves, and integration with airline digital pre-order platforms, influencing service reliability and contract renewal outcomes.
| Company Name | Establishment Year | Headquarters | Formulation Depth | Distribution Reach | Regulatory Readiness | Service Capability | Channel Strength | Pricing Flexibility |
| LSG Sky Chefs | 1942 | Irving, Texas | ~ | ~ | ~ | ~ | ~ | ~ |
| gategroup | 2008 | Zurich, Switzerland | ~ | ~ | ~ | ~ | ~ | ~ |
| dnata Catering & Retail | 1959 | Dubai, UAE | ~ | ~ | ~ | ~ | ~ | ~ |
| Flying Food Group | 1983 | Chicago, Illinois | ~ | ~ | ~ | ~ | ~ | ~ |
| Newrest | 1996 | Toulouse, France | ~ | ~ | ~ | ~ | ~ | ~ |
US in-flight catering services Market Analysis
Growth Drivers
Recovery and expansion of US domestic and international passenger traffic
Passenger throughput at major US airports increased to ~ in 2024 from ~ in 2022, driven by route reinstatements and higher aircraft utilization across domestic corridors. International departures rose with 420 new weekly frequencies added by US carriers during 2023, supported by bilateral air service agreements. Federal Aviation Administration operational data recorded ~ commercial aircraft movements in 2024, increasing catering cycle frequency per aircraft rotation. Airport terminal expansions in Los Angeles, New York, and Miami added 120 new gates by 2025, enabling higher departure density. This operational scaling directly raises meal provisioning cycles, cold-chain handling volumes, and catering workforce deployment intensity across hub-centric networks nationwide.
Airline focus on differentiated onboard experience and ancillary revenue
Airlines expanded premium cabin seating by ~ seats across long-haul fleets during 2023 and 2024, intensifying demand for multi-course catering logistics. Buy-on-board digital pre-order platforms recorded ~ transactions in 2024 across domestic routes, increasing SKU complexity for caterers. Cabin retrofit programs approved by the Federal Aviation Administration covered 620 aircraft between 2022 and 2025, embedding galley configurations optimized for varied menu formats. Consumer experience benchmarks from transportation authorities recorded 74 service quality audits in 2024 tied to onboard food satisfaction. These indicators reflect airline strategies to differentiate service quality and monetize onboard consumption, structurally elevating catering customization requirements and operational planning depth.
Challenges
Volatility in airline capacity deployment and route rationalization
Route network adjustments led to 320 domestic city-pair suspensions between 2022 and 2024, disrupting predictable catering volumes at secondary airports. Aircraft utilization hours fluctuated between 9 and 12 daily cycles across narrow-body fleets, complicating meal loading schedules and inventory forecasting. The Federal Aviation Administration recorded 18600 schedule change filings in 2024 linked to fleet reassignments, forcing caterers to reconfigure commissary production plans. Seasonal redeployment of 140 aircraft across leisure routes in 2023 shifted catering demand away from established hubs. This volatility strains workforce scheduling, increases food waste risk, and weakens long-term capacity planning for airport-based catering facilities across multi-hub networks.
High labor costs and workforce shortages in catering operations
Airport-area hospitality employment vacancies reached 310000 unfilled positions in 2024, affecting food preparation, logistics handling, and quality control roles. State labor departments reported median wage increases of 18 between 2022 and 2025 for kitchen and logistics staff, intensifying cost pressure without improving labor availability. Transportation Security Administration clearance processing times extended to 45 days in several hubs during 2024, delaying onboarding for airside catering workers. Commissary absenteeism rates averaged 9 across peak travel months, disrupting production consistency. These workforce constraints limit operational scalability, raise training burdens, and increase reliance on temporary staffing for time-sensitive flight departure windows.
Opportunities
Digital pre-order platforms and personalization of onboard menus
Airline mobile app adoption reached 188000000 active users in 2024 across US carriers, enabling granular meal pre-order data for caterers. Pre-order penetration on long-haul routes increased from 14 in 2022 to 27 in 2025, improving production planning accuracy. Airport Wi-Fi coverage expanded to 98 of terminals in 2024, supporting real-time order synchronization between airlines and commissaries. The Department of Transportation recorded 220 service digitization initiatives approved for airlines during 2023 and 2024, accelerating data integration. These indicators enable caterers to reduce overproduction, tailor menus by route, and deploy predictive analytics to optimize inventory management and labor allocation across hubs.
Expansion of premium and branded food partnerships
Branded onboard dining partnerships increased to 86 active agreements across US airlines in 2024, up from 41 in 2022, expanding menu differentiation requirements. Culinary brand licensing approvals from state health departments rose to 132 in 2025, enabling multi-hub menu standardization with regional adaptation. International route expansions added 64 new city connections between 2023 and 2025, increasing demand for culturally localized menus. Airport concession frameworks approved 27 co-branded commissary facilities near major hubs by 2024. These developments create opportunities for caterers to build premium production lines, co-develop menus with recognized brands, and secure longer-term service contracts through differentiated culinary offerings.
Future Outlook
The market is expected to evolve through 2035 as airlines deepen service personalization, expand international connectivity, and integrate digital pre-order systems into catering operations. Sustainability mandates and waste reduction initiatives will shape packaging and logistics models. Hub expansions and terminal modernization programs are likely to redistribute catering capacity across emerging secondary airports. Technology-driven forecasting and automation will further redefine operational efficiency and service differentiation.
Major Players
- LSG Sky Chefs
- gategroup
- dnata Catering & Retail
- Flying Food Group
- Newrest
- SATS Ltd.
- Gate Gourmet USA
- DO & CO
- Cathay Pacific Catering Services
- AAS Catering
- Skylink International
- CulinAero
- Silver Lining Inflight Catering
- Jetfinity Inflight Services
- Aero Chef Services
Key Target Audience
- Commercial airlines and regional carriers
- Charter and private aviation operators
- Airport authorities and concession managers
- Aircraft leasing and fleet management firms
- Food logistics and cold-chain service providers
- Investments and venture capital firms
- Federal Aviation Administration and Transportation Security Administration
- State departments of health and food safety agencies
Research Methodology
Step 1: Identification of Key Variables
Key variables were defined across airline fleet deployment, route network density, hub airport infrastructure, catering unit capacities, and regulatory compliance requirements. Operational constraints such as turnaround time windows, cold-chain logistics complexity, and labor availability were mapped to service demand drivers. Stakeholder interactions across airlines, airport authorities, and commissary operators informed variable prioritization.
Step 2: Market Analysis and Construction
The analytical framework integrated flight movement data, hub traffic concentration, airline service models, and catering operational workflows. Supply chain structures, service delivery pathways, and ecosystem interdependencies were constructed to reflect real-world catering operations. Institutional indicators from aviation and transportation authorities were embedded to contextualize demand patterns and infrastructure readiness.
Step 3: Hypothesis Validation and Expert Consultation
Operational hypotheses were validated through structured consultations with airline operations managers, airport concession administrators, and food safety compliance professionals. Scenario testing assessed the impact of route volatility, labor constraints, and digital pre-order adoption on service scalability. Feedback loops refined assumptions on capacity utilization, service differentiation, and regulatory readiness across hubs.
Step 4: Research Synthesis and Final Output
Insights were synthesized into coherent market narratives aligning operational drivers, constraints, and opportunity pathways. Cross-validation ensured consistency between ecosystem mapping, regulatory analysis, and demand structuring. Final outputs emphasized decision-relevant insights for stakeholders, maintaining methodological transparency and industry-specific relevance throughout the research development process.
- Executive Summary
- Research Methodology (Market Definitions and scope validation for in-flight catering services, Primary interviews with US airline catering procurement heads and operations managers, Analysis of airline passenger traffic and route network data by hub, Assessment of catering unit capacities and airport concession contracts, Pricing audits of meal provisioning and logistics cost structures, Review of FAA, TSA, and airport authority compliance requirements)
- Definition and Scope
- Market evolution
- Service delivery pathways
- Ecosystem structure
- Supply chain and cold-chain logistics
- Regulatory environment

- Growth Drivers
Recovery and expansion of US domestic and international passenger traffic
Airline focus on differentiated onboard experience and ancillary revenue
Premium cabin service enhancements by network carriers
Expansion of buy-on-board and pre-order meal programs
Growth in long-haul routes from US hubs
Rising demand for customized and special dietary meals - Challenges
Volatility in airline capacity deployment and route rationalization
High labor costs and workforce shortages in catering operations
Food safety compliance and quality consistency across hubs
Tight turnaround times and airport-side logistics constraints
Rising input costs for food ingredients and packaging
Contract pricing pressure from cost-focused airlines - Opportunities
Digital pre-order platforms and personalization of onboard menus
Expansion of premium and branded food partnerships
Growth in sustainable packaging and waste reduction programs
Near-airport commissary expansion in emerging secondary hubs
Value-added services for private and charter aviation
Data-driven demand forecasting to reduce catering wastage - Trends
Shift toward pre-packaged and shelf-stable meal formats
Increased focus on sustainability and carbon footprint reporting
Menu localization by route and passenger demographic
Outsourcing of catering operations by airlines to asset-light models
Integration of real-time flight ops data into catering planning
Growth of cashless and app-based onboard retail - Government Regulations
- SWOT Analysis
- Stakeholder and Ecosystem Analysis
- Porter’s Five Forces Analysis
- Competition Intensity and Ecosystem Mapping
- By Value, 2020–2025
- By Volume, 2020–2025
- By Active Catering Units, 2020–2025
- By Revenue per Passenger Served, 2020–2025
- By Service Type (in Value %)
Meal preparation and onboard provisioning
Beverage and bar service supply
Special meals and dietary catering
Onboard retail and buy-on-board programs
Equipment cleaning and replenishment services - By Airline Type (in Value %)
Full-service carriers
Low-cost carriers
Ultra-low-cost carriers
Regional airlines
Charter and private operators - By Cabin Class Served (in Value %)
First class
Business class
Premium economy
Economy class - By Flight Type (in Value %)
Domestic short-haul
Domestic long-haul
International short-haul
International long-haul - By Catering Model (in Value %)
In-house airline catering units
Third-party contract caterers
Airport-based shared kitchens
Hybrid multi-vendor models - By Distribution Channel (in Value %)
Hub airport catering facilities
Spoke airport catering stations
Centralized commissaries with feeder logistics
Third-party airport concession partners
- Market structure and competitive positioning
Market share snapshot of major players - Cross Comparison Parameters (geographic airport network coverage, airline contract portfolio breadth, menu innovation capability, cold-chain and logistics infrastructure, cost efficiency and unit economics, compliance and food safety certifications, digital ordering and forecasting tools, sustainability and waste management programs)
- SWOT Analysis of Key Players
- Pricing and Commercial Model Benchmarking
- Detailed Profiles of Major Companies
LSG Sky Chefs
gategroup
dnata Catering & Retail
Flying Food Group
Newrest
SATS Ltd.
Cathay Pacific Catering Services
Gate Gourmet USA
DO & CO
AAS Catering
Skylink International
CulinAero
Silver Lining Inflight Catering
Jetfinity Inflight Services
Aero Chef Services
- Demand and utilization drivers
- Procurement and tender dynamics
- Buying criteria and vendor selection
- Budget allocation and financing preferences
- Implementation barriers and risk factors
- Post-purchase service expectations
- By Value, 2026–2035
- By Volume, 2026–2035
- By Active Catering Units, 2026–2035
- By Revenue per Passenger Served, 2026–2035


 Request a Sample
 Ask for Customization
 Get a Quote
 Enquire Now