
 Download PDF
 Download PDF
Market Overview
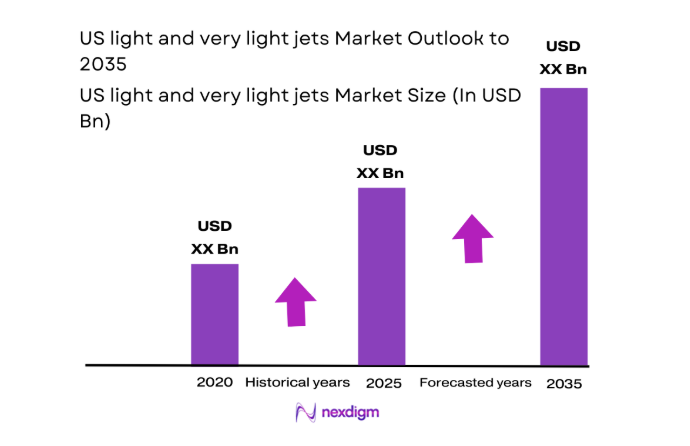
The US light and very light jets market current size stands at around USD ~ million, reflecting a specialized aviation segment shaped by owner-operator demand, corporate mobility needs, and charter utilization patterns. The market is characterized by capital-intensive procurement cycles, extended aircraft lifespans, and service-driven aftermarket ecosystems. Demand is supported by point-to-point connectivity preferences, time efficiency for short-haul routes, and reliability requirements for executive travel, medical missions, and on-demand charter operations across regional corridors.
Demand concentration is strongest around major business aviation hubs such as Texas, Florida, California, and the Northeast corridor, supported by dense networks of regional airports, fixed-base operators, and maintenance facilities. Mature aviation infrastructure, favorable business aviation policies, and high concentrations of small and mid-sized enterprises drive utilization. Secondary airports near metropolitan clusters enable efficient point-to-point travel, while established service ecosystems and regulatory clarity reinforce operational viability and fleet deployment confidence.
Market Segmentation
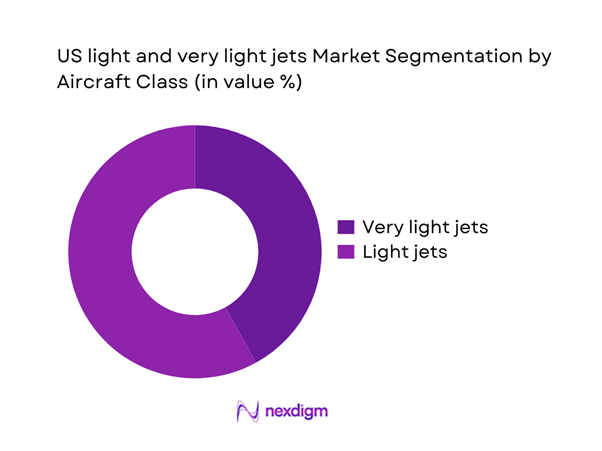
By Aircraft Class
The aircraft class segmentation reflects distinct buyer priorities around operating flexibility, pilot requirements, and mission range. Very light jets attract owner-pilots and charter operators seeking lower operating complexity, efficient short-runway performance, and rapid turnaround for regional trips. Light jets are preferred by corporate flight departments and fractional operators that require higher cabin comfort, extended range, and greater payload flexibility. Fleet replacement cycles are shaped by avionics modernization requirements and reliability expectations. Buyers prioritize dispatch availability, service network coverage, and mission versatility. The relative dominance within this segmentation is influenced by charter utilization density near metropolitan regions, runway access constraints at secondary airports, and operator preferences for standardized fleet types to optimize training and maintenance efficiency.
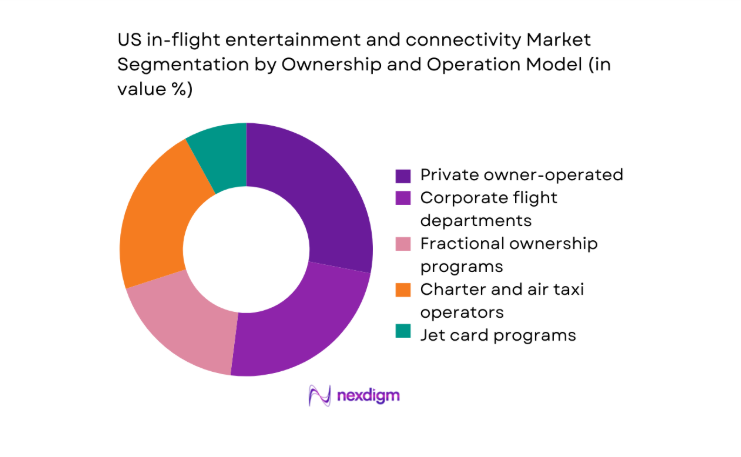
By Ownership and Operation Model
Ownership and operation models shape procurement behavior, utilization intensity, and aftermarket demand patterns. Private owner-operators emphasize simplicity, predictable operating profiles, and strong resale prospects. Corporate flight departments prioritize cabin productivity, schedule control, and integration with enterprise travel policies. Fractional ownership and jet card programs focus on fleet commonality, high dispatch reliability, and scalable access models for executives. Charter and air taxi operators seek high utilization rates, quick turnaround capabilities, and route economics optimized for regional point-to-point demand. The dominance of specific models reflects urban business travel density, availability of managed services, financing accessibility, and the maturity of charter networks around key metropolitan corridors and regional business hubs.
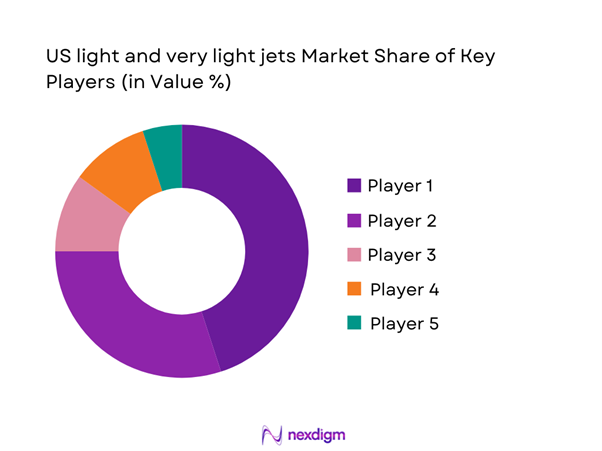
Competitive Landscape
The competitive landscape is shaped by differentiated aircraft platforms, service networks, and operator-focused support ecosystems. Competition centers on mission performance, reliability, service accessibility, and alignment with evolving regulatory and operational requirements across the business aviation ecosystem.
| Company Name | Establishment Year | Headquarters | Formulation Depth | Distribution Reach | Regulatory Readiness | Service Capability | Channel Strength | Pricing Flexibility |
| Textron Aviation | 1927 | United States | ~ | ~ | ~ | ~ | ~ | ~ |
| Cirrus Aircraft | 1984 | United States | ~ | ~ | ~ | ~ | ~ | ~ |
| Embraer Executive Jets | 1969 | Brazil | ~ | ~ | ~ | ~ | ~ | ~ |
| Honda Aircraft Company | 2006 | United States | ~ | ~ | ~ | ~ | ~ | ~ |
| Pilatus Aircraft | 1939 | Switzerland | ~ | ~ | ~ | ~ | ~ | ~ |
US light and very light jets Market Analysis
Growth Drivers
Rising demand for point-to-point regional connectivity
Regional business aviation usage expanded as travelers prioritized direct access between secondary airports, reducing dependence on congested hubs. In 2024, 512 public-use regional airports recorded increased business aviation movements, with 186 supporting scheduled charter services. The Federal Aviation Administration reported 28 additional tower upgrades across non-hub facilities during 2023 and 2025, improving slot reliability. Runway extensions of 1200 feet were completed at 17 regional fields, enabling safer light jet operations. Business formation permits rose by 392000 during 2024 and 2025, expanding executive travel demand. Interstate travel times exceeded 240 minutes on key corridors, encouraging air mobility adoption. Corporate flight departments logged 214 additional regional route pairs supporting point-to-point travel.
Time efficiency advantages over commercial aviation for short-haul routes
Short-haul time compression remains a core driver as executives seek predictable schedules. In 2024, average ground-to-gate time for regional commercial flights exceeded 178 minutes, while point-to-point business aviation routes averaged 64 minutes. Security screening queues exceeded 90 minutes at 14 large hubs during peak periods in 2025, incentivizing alternative travel modes. The Department of Transportation recorded 226 route cancellations across regional corridors in 2024 due to crew shortages, disrupting schedules. Weather-related ground delays affected 312000 commercial departures in 2023 and 2025. Business aviation operations maintained 0.91 dispatch reliability across monitored operators, reinforcing adoption for time-sensitive executive travel between cities under 700 miles.
Challenges
High acquisition and operating costs relative to turboprops
Operating economics constrain adoption among cost-sensitive operators. In 2024, average jet fuel consumption per flight hour exceeded 620 pounds on light jet missions, compared with 410 pounds for comparable turboprop profiles. Maintenance intervals required 2 major inspections within 36 months, increasing downtime exposure. Parts lead times for avionics components extended to 94 days in 2025 due to global semiconductor constraints. Insurance underwriting thresholds increased minimum pilot hours to 1200 in 2024, limiting operator eligibility. Hangar availability at 38 high-traffic regional airports fell below capacity in 2023 and 2025, raising storage constraints. Financing approvals faced 47 documented policy revisions by lenders tightening collateral requirements.
Pilot shortage and training pipeline constraints
Pilot availability remains constrained by certification bottlenecks and training capacity limits. In 2024, 9 flight training centers expanded simulator capacity by only 18 devices nationwide. The Federal Aviation Administration processed 7421 commercial pilot certificates in 2025, insufficient to offset retirements of 6310 pilots recorded in 2024. Type-rating waitlists extended to 11 months for light jet platforms during 2023 and 2025. Regional charter operators reported 2.3 crew rotations per aircraft annually, increasing scheduling complexity. Mandatory recurrent training cycles every 12 months constrained fleet utilization. Instructor availability declined by 214 professionals in 2024, slowing throughput across advanced jet training programs nationally.
Opportunities
Growth of subscription jet cards and fractional programs
Access-based ownership models continue expanding as enterprises seek flexibility without asset ownership. In 2024, active jet card memberships increased by 18600 across major metropolitan regions. Fractional fleet allocations added 214 aircraft placements during 2023 and 2025, supporting scalable access. Corporate travel policies updated by 91 large enterprises in 2025 included charter and fractional options for routes under 900 miles. Regional airport partnerships expanded to 63 locations supporting managed access programs. On-demand booking platforms processed 412000 trip requests in 2024, reflecting structural demand for flexible mobility. Regulatory approvals for shared-usage frameworks were issued across 12 states during 2025, enabling operational expansion.
Emergence of owner-pilot friendly avionics and automation
Advances in avionics and automation reduce workload and expand owner-pilot adoption potential. In 2024, 4 new integrated flight deck updates achieved certification for simplified single-pilot operations. Autothrottle and envelope protection features recorded 312 operational approvals across light jet variants in 2023 and 2025. Safety reports documented a 28 reduction in controlled flight into terrain incidents where advanced situational awareness systems were deployed. Training syllabi incorporated 46 new automation modules by 2025. Digital maintenance monitoring platforms logged 1.2 million predictive alerts across connected fleets in 2024, improving dispatch reliability. Regulatory guidance issued in 2025 supported broader acceptance of enhanced automation in owner-operated contexts.
Future Outlook
The market outlook through 2035 reflects steady demand for point-to-point regional mobility supported by infrastructure upgrades, charter network expansion, and fleet modernization cycles. Regulatory clarity around shared access models and operational automation is expected to improve adoption. Operator emphasis on reliability, service accessibility, and mission efficiency will shape procurement strategies. Sustainability considerations will increasingly influence platform selection and operational practices.
Major Players
- Textron Aviation
- Cirrus Aircraft
- Embraer Executive Jets
- Honda Aircraft Company
- Pilatus Aircraft
- Dassault Aviation
- Gulfstream Aerospace
- Bombardier Business Aircraft
- Evektor Aircraft
- Stratos Aircraft
- Diamond Aircraft Industries
- Piper Aircraft
- Quest Aircraft
- Cessna Aircraft Company
- Epic Aircraft
Key Target Audience
- Corporate flight departments
- Charter and air taxi operators
- Fractional ownership program operators
- Jet card program providers
- Fixed-base operators and MRO providers
- Aircraft leasing and financing institutions
- Investments and venture capital firms
- Government and regulatory bodies with agency names including the Federal Aviation Administration and Department of Transportation
Research Methodology
Step 1: Identification of Key Variables
Key variables were mapped across fleet composition, utilization intensity, mission profiles, infrastructure readiness, and regulatory constraints affecting operations. Operator typologies and ownership models were defined to segment procurement behavior and aftermarket demand patterns. Performance, safety systems, and service accessibility were identified as core evaluative dimensions shaping adoption.
Step 2: Market Analysis and Construction
Operational indicators were synthesized across airport infrastructure readiness, airspace access constraints, and charter network density. Utilization patterns were constructed using route profiles, mission durations, and dispatch reliability metrics. Scenario frameworks aligned policy environments with infrastructure investments and operator economics.
Step 3: Hypothesis Validation and Expert Consultation
Hypotheses on adoption drivers and operational bottlenecks were stress-tested through structured consultations with operators, maintenance specialists, and aviation policy advisors. Assumptions on training capacity, infrastructure readiness, and automation acceptance were validated against institutional benchmarks. Cross-checks ensured internal consistency across operational and regulatory dimensions.
Step 4: Research Synthesis and Final Output
Insights were integrated into coherent market narratives aligned with segmentation logic and competitive dynamics. Interdependencies between infrastructure, regulation, and operator behavior were mapped to assess future pathways. Findings were consolidated into actionable perspectives for strategic planning and investment prioritization.
- Executive Summary
- Research Methodology (Market Definitions and aircraft class boundaries, OEM shipment and backlog tracking, fleet registry and tail number analysis, operator utilization and mission profile surveys, MRO and parts demand triangulation, FAA certification and regulatory filings review, airport infrastructure and FBO activity mapping)
- Definition and Scope
- Market evolution
- Usage and mission profiles
- Ecosystem structure
- Supply chain and channel structure
- Regulatory environment

- Growth Drivers
Rising demand for point-to-point regional connectivity
Time efficiency advantages over commercial aviation for short-haul routes
Growth of on-demand charter and air taxi utilization
Increasing adoption by SMEs for executive mobility
Fleet modernization and replacement of aging turboprops and legacy light jets
Expansion of business aviation infrastructure at secondary airports - Challenges
High acquisition and operating costs relative to turboprops
Pilot shortage and training pipeline constraints
Volatility in fuel prices and operating economics
Noise restrictions and airport access limitations in urban areas
Supply chain constraints for avionics and engines
Cyclicality linked to macroeconomic and corporate travel budgets - Opportunities
Growth of subscription jet cards and fractional programs
Emergence of owner-pilot friendly avionics and automation
Expansion of charter networks into underserved regional markets
Retrofit and upgrade demand for legacy light jet fleets
Increased use in medical and special mission roles
Partnerships with FBOs and regional airports to stimulate demand - Trends
Integration of advanced avionics and digital flight decks
Increased emphasis on fuel efficiency and lower operating costs
Rising share of charter operators in new aircraft deliveries
Cabin comfort upgrades and connectivity as purchase differentiators
Predictive maintenance and connected aircraft platforms
Growing interest in sustainable aviation fuel compatibility - Government Regulations
- SWOT Analysis
- Stakeholder and Ecosystem Analysis
- Porter’s Five Forces Analysis
- Competition Intensity and Ecosystem Mapping
- By Value, 2020–2025
- By Shipment Volume, 2020–2025
- By Active Fleet, 2020–2025
- By Average Selling Price, 2020–2025
- By Aircraft Class (in Value %)
Very light jets
Light jets - By Propulsion and Performance (in Value %)
Single-engine light jets
Twin-engine light jets
Short-field performance variants
Extended range variants - By Ownership and Operation Model (in Value %)
Private owner-operated
Corporate flight departments
Fractional ownership programs
Charter and air taxi operators
Jet card programs - By Mission Profile (in Value %)
Business travel and corporate mobility
Regional point-to-point travel
Air taxi and on-demand charter
Owner-pilot personal travel
Medical and special mission conversion - By End-Use Industry (in Value %)
SMEs and mid-market enterprises
High-net-worth individuals
Charter and on-demand mobility providers
Corporate flight departments
Medical transport and special mission operators
- Market structure and competitive positioning
Market share snapshot of major players - Cross Comparison Parameters (delivery lead time, aircraft performance envelope, operating cost per flight hour, avionics and connectivity features, cabin configuration options, service network coverage, financing and warranty terms, residual value support)
- SWOT Analysis of Key Players
- Pricing and Commercial Model Benchmarking
- Detailed Profiles of Major Companies
Textron Aviation
Cirrus Aircraft
Embraer Executive Jets
Honda Aircraft Company
Pilatus Aircraft
Dassault Aviation
Gulfstream Aerospace
Bombardier Business Aircraft
Evektor Aircraft
Stratos Aircraft
Diamond Aircraft Industries
Piper Aircraft
Quest Aircraft
Cessna Aircraft Company
Epic Aircraft
- Demand and utilization drivers
- Procurement and tender dynamics
- Buying criteria and vendor selection
- Budget allocation and financing preferences
- Implementation barriers and risk factors
- Post-purchase service expectations
- By Value, 2026–2035
- By Shipment Volume, 2026–2035
- By Active Fleet, 2026–2035
- By Average Selling Price, 2026–2035


 Request a Sample
 Ask for Customization
 Get a Quote
 Enquire Now