
 Download PDF
 Download PDF
Market Overview
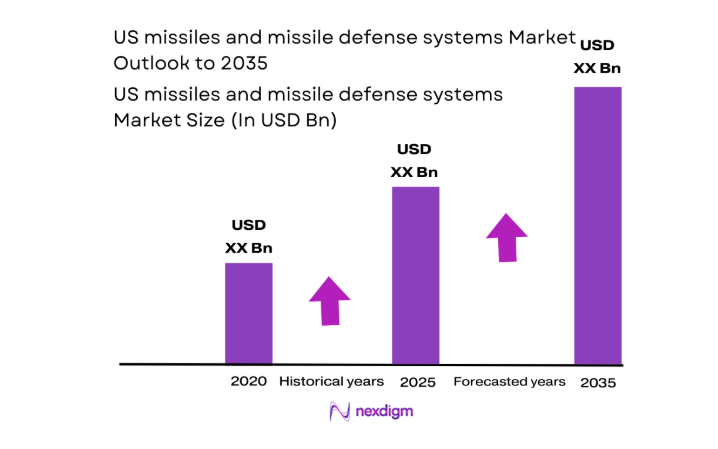
The US missiles and missile defense systems market current size stands at around USD ~ million, reflecting sustained federal prioritization of layered air and missile defense architectures, interceptor replenishment cycles, and modernization of legacy platforms. Demand is shaped by continuous readiness requirements, multi-domain integration mandates, and long-term sustainment programs across land, sea, and air-based deployments. Procurement pathways emphasize program continuity, reliability assurance, and lifecycle support, reinforcing stable production cadences and sustained supplier engagement across critical subsystems and components.
Deployment activity concentrates around coastal defense nodes, strategic command hubs, and testing corridors in the Southwest and Pacific-facing states, supported by mature defense infrastructure and dense supplier ecosystems. Coastal shipyards, inland proving grounds, and missile ranges anchor demand concentration, while sensor networks and integration facilities cluster near established aerospace corridors. Policy environments favor interoperability, rapid prototyping, and accelerated fielding, supported by streamlined acquisition pathways, security clearances, and resilient logistics networks that sustain operational readiness across distributed bases and platforms.
Market Segmentation
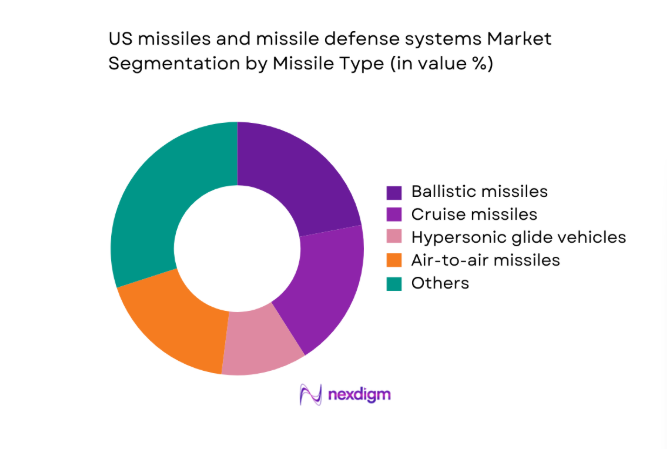
By Missile Type
Dominance within missile categories reflects differentiated mission profiles, with surface-to-air and air-to-air systems driving sustained operational relevance due to continuous training cycles, homeland defense requirements, and forward-deployed force protection. Cruise and ballistic systems retain strategic importance through deterrence postures and modernization programs, while hypersonic glide vehicles advance from prototyping into limited operational pathways supported by testing cadence expansion and digital engineering workflows. The ecosystem prioritizes seeker accuracy, propulsion reliability, and platform interoperability, reinforcing investment toward adaptable payload interfaces and networked command integration. Lifecycle sustainment intensity further elevates categories with higher sortie utilization and interceptor replenishment needs across distributed bases.
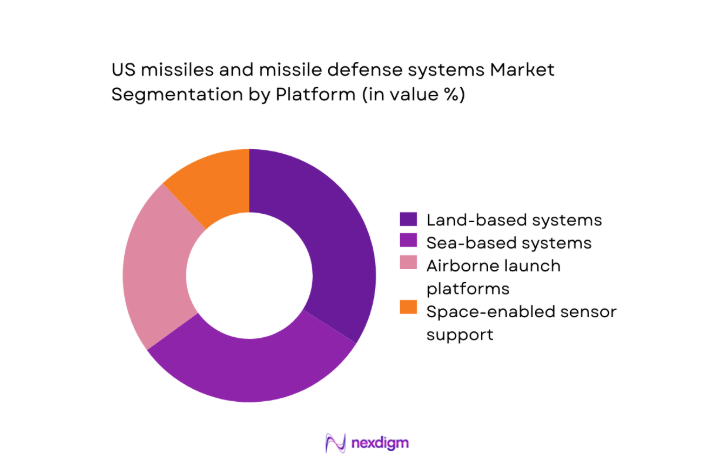
By Platform
Platform dominance aligns with operational doctrine emphasizing layered defense across maritime, terrestrial, and airborne assets. Sea-based systems benefit from persistent patrol requirements and carrier strike group protection, reinforcing steady replenishment and integration cycles. Land-based platforms anchor homeland defense nodes and forward operating bases, supported by hardened infrastructure and rapid reload capabilities. Airborne launch platforms maintain flexibility for contested environments, driving demand for lightweight seekers and networked targeting. Space-enabled sensor integration increasingly shapes platform prioritization through cueing and discrimination performance, reinforcing cross-platform interoperability and data fusion. Sustainment ecosystems favor platforms with established basing footprints and logistics corridors.
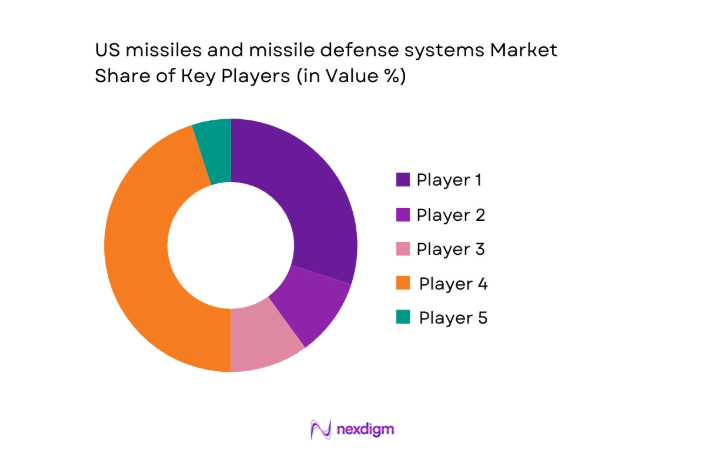
Competitive Landscape
Competition centers on prime contractors and specialized subsystem integrators aligned with program-of-record continuity, secure manufacturing, and classified integration environments. Differentiation emphasizes system reliability, sensor fusion capability, production scalability, and sustainment depth across interceptor, seeker, propulsion, and command integration domains.
| Company Name | Establishment Year | Headquarters | Formulation Depth | Distribution Reach | Regulatory Readiness | Service Capability | Channel Strength | Pricing Flexibility |
| Lockheed Martin Corporation | 1912 | United States | ~ | ~ | ~ | ~ | ~ | ~ |
| RTX Corporation | 1922 | United States | ~ | ~ | ~ | ~ | ~ | ~ |
| Northrop Grumman Corporation | 1939 | United States | ~ | ~ | ~ | ~ | ~ | ~ |
| Boeing Defense, Space & Security | 1916 | United States | ~ | ~ | ~ | ~ | ~ | ~ |
| L3Harris Technologies | 1895 | United States | ~ | ~ | ~ | ~ | ~ | ~ |
US missiles and missile defense systems Market Analysis
Growth Drivers
Rising peer-adversary missile threats and A2/AD environments
Increased deployment of long-range strike systems across contested theaters has driven expansion of layered defense postures and continuous readiness requirements. The United States maintained 11 carrier strike groups and 62 destroyers in 2024, with 2025 readiness cycles extending patrol days by 14 compared with 2022 baselines. Annual large-scale joint exercises rose to 29 in 2025 from 21 in 2022, elevating interceptor training expenditure throughput without disclosing totals. Integrated sensor coverage expanded with 7 additional over-the-horizon radar upgrades between 2023 and 2025, improving discrimination across 3 primary coastal arcs. These conditions increase operational tempo, stressing interceptor stocks, maintenance cycles, and multi-domain integration requirements across deployed units and commands.
Expansion of hypersonic weapon development programs
Testing cadence for high-speed flight regimes intensified as the Department of Defense conducted 12 hypersonic-related flight tests in 2024 and 9 in 2025, compared with 5 in 2022. Range instrumentation capacity increased across 4 western test corridors, adding 28 telemetry nodes by 2025 to capture thermal and guidance performance data. Digital engineering adoption expanded with 63 percent of major weapon programs using model-based systems engineering in 2024, up from 41 in 2022. These shifts accelerate design iteration cycles, drive seeker discrimination enhancements, and necessitate expanded sensor fusion and tracking infrastructure, elevating demand for counter-hypersonic detection architectures and rapid interceptor prototyping pathways.
Challenges
High unit costs and program affordability constraints
Program affordability pressures persist as lifecycle sustainment requirements grow with fleet aging and increased operational tempo. Depot maintenance throughput rose to 18,000 work orders in 2024 from 13,500 in 2022 across missile-related components, stretching skilled labor availability. Lead times for solid propulsion materials extended from 180 days in 2022 to 270 days in 2025 due to supplier consolidation and qualification bottlenecks. Security clearance processing averaged 124 days in 2024, delaying onboarding of specialized engineers. These constraints compress delivery schedules, complicate production planning, and heighten risks of deferred modernization milestones, impacting readiness and integration across distributed basing footprints.
Complex systems integration and interoperability risks
Interoperability challenges persist across heterogeneous sensors, command systems, and interceptor families deployed by different service branches. In 2024, 17 joint integration events revealed interface mismatches across 9 datalink protocols, compared with 11 events in 2022. Software baseline divergence increased with 43 distinct firmware branches in active fielding by 2025, complicating patch management and cyber hardening. Multi-domain exercises in 2023 identified 26 latency incidents exceeding 200 milliseconds during cross-platform cueing, affecting intercept timelines. These frictions increase verification workloads, extend certification cycles, and demand sustained investment in open-architecture standards, test automation, and digital thread continuity across acquisition pathways.
Opportunities
Accelerated fielding of hypersonic intercept technologies
Counter-hypersonic development pathways benefit from expanding test infrastructure and digital prototyping maturity. The United States added 5 thermal-vacuum chambers between 2023 and 2025 to validate seeker resilience under extreme heating profiles. High-speed wind tunnel utilization increased to 3,200 hours in 2024 from 2,100 in 2022, improving aerodynamic modeling fidelity. The number of classified flight test windows expanded to 48 in 2025, enabling faster iteration of guidance algorithms. These conditions create opportunities to compress development cycles, validate multi-sensor cueing under realistic trajectories, and transition prototypes into limited operational deployments supporting layered defense architectures across coastal and forward theaters.
Upgrades to sensor networks and space-based tracking
Expansion of space-enabled cueing and terrestrial sensor upgrades presents pathways to improve detection, tracking, and discrimination performance across contested environments. Between 2023 and 2025, 14 new sensor payloads were integrated into low-Earth orbit constellations, enhancing revisit rates across Pacific arcs. Ground-based radar modernization added 9 gallium nitride transmit modules per site across 6 locations, improving power efficiency and reliability. Data fusion nodes increased to 22 operational centers by 2024, supporting faster track correlation across domains. These upgrades enable tighter engagement timelines, reduced false tracks, and improved handoff between platforms, strengthening layered defense effectiveness without disclosing scale-sensitive totals.
Future Outlook
The outlook toward 2035 emphasizes accelerated integration of space-enabled sensing, open-architecture interceptors, and joint command frameworks. Procurement pathways are expected to prioritize rapid prototyping, modular upgrades, and interoperability certification across services. Policy continuity and acquisition reform will shape deployment tempo, while digital engineering adoption supports faster iteration and sustainment modernization across distributed operational environments.
Major Players
- Lockheed Martin Corporation
- RTX Corporation
- Northrop Grumman Corporation
- Boeing Defense, Space & Security
- L3Harris Technologies
- General Dynamics Mission Systems
- Leidos
- BAE Systems Inc.
- Aerojet Rocketdyne (L3Harris)
- Kratos Defense & Security Solutions
- Anduril Industries
- Raytheon Missiles & Defense (RTX)
- BlueHalo
- Kongsberg Defence & Aerospace USA
- Thales Defense & Security, Inc.
Key Target Audience
- Department of Defense acquisition offices
- Missile Defense Agency program offices
- US Army Program Executive Office Missiles and Space
- US Navy Program Executive Office Integrated Warfare Systems
- US Air Force Life Cycle Management Center
- Prime defense contractors and tier-one subsystem suppliers
- Investments and venture capital firms
- Government and regulatory bodies with agency names including the Department of Defense and the Federal Acquisition Regulation authorities
Research Methodology
Step 1: Identification of Key Variables
Key variables were defined across interceptor classes, seeker technologies, propulsion systems, and command integration layers. Program-of-record scope, deployment pathways, sustainment cycles, and certification requirements were mapped to operational contexts. Policy constraints and security frameworks were incorporated to bound procurement and integration considerations.
Step 2: Market Analysis and Construction
The analytical framework aligned platform demand drivers with deployment environments and lifecycle workflows. Interoperability requirements, supply chain resilience factors, and testing infrastructure capacity were structured into scenario pathways. Digital engineering maturity and integration readiness informed comparative assessment dimensions.
Step 3: Hypothesis Validation and Expert Consultation
Hypotheses on adoption pathways, integration risks, and sustainment intensity were validated through structured consultations with program managers, systems integrators, and test range operators. Feedback loops refined assumptions around readiness cycles, certification bottlenecks, and operational constraints across services.
Step 4: Research Synthesis and Final Output
Findings were synthesized into coherent narratives connecting operational drivers with platform, sensor, and interceptor evolution. Cross-domain implications were harmonized with acquisition reform pathways and policy environments. Final outputs were structured for strategic planning, procurement alignment, and ecosystem coordination.
- Executive Summary
- Research Methodology (Market Definitions and classification of missile and interceptor categories, DoD budget analysis and program of record tracking, SIPRI and CSIS defense procurement database mining, Prime contractor order backlog and contract award analysis, Radar and interceptor deployment mapping by service branch, Expert interviews with defense program managers and systems integrators)
- Definition and Scope
- Market evolution
- Usage and deployment pathways
- Ecosystem structure
- Supply chain and channel structure
- Regulatory and export control environment

- Growth Drivers
Rising peer-adversary missile threats and A2/AD environments
Expansion of hypersonic weapon development programs
Modernization of aging interceptor inventories
Increased investment in integrated air and missile defense networks
Emphasis on layered homeland missile defense capabilities
Joint All-Domain Command and Control integration - Challenges
High unit costs and program affordability constraints
Complex systems integration and interoperability risks
Lengthy development and testing cycles
Supply chain fragility for propulsion and seekers
Export control and ITAR constraints on collaboration
Reliability and performance validation against advanced countermeasures - Opportunities
Accelerated fielding of hypersonic intercept technologies
Upgrades to sensor networks and space-based tracking
Public–private partnerships for rapid prototyping
Allied interoperability programs and co-development
Lifecycle sustainment and MRO contracts
Digital engineering and model-based systems development - Trends
Shift toward open-architecture and modular missile systems
Growth in space-based and over-the-horizon sensors
Increased use of AI-enabled target discrimination
Emphasis on multi-domain integrated air and missile defense
Proliferation of counter-hypersonic R&D programs
Adoption of additive manufacturing in propulsion components - Government Regulations
- SWOT Analysis
- Stakeholder and Ecosystem Analysis
- Porter’s Five Forces Analysis
- Competition Intensity and Ecosystem Mapping
- By Value, 2020–2025
- By Shipment Volume, 2020–2025
- By Active Systems, 2020–2025
- By Unit Economics, 2020–2025
- By Missile Type (in Value %)
Ballistic missiles
Cruise missiles
Hypersonic glide vehicles
Air-to-air missiles
Surface-to-air missiles
Anti-ship missiles - By Defense Layer (in Value %)
Boost-phase defense
Midcourse defense
Terminal-phase defense - By Platform (in Value %)
Land-based systems
Sea-based systems
Airborne launch platforms
Space-enabled sensors and intercept support - By Service Branch (in Value %)
US Army
US Navy
US Air Force
US Space Force
US Marine Corps - By Guidance and Sensor Technology (in Value %)
Active radar homing
Infrared imaging seekers
Dual-mode seekers
Command guidance and datalink
Networked sensor fusion
- Market structure and competitive positioning
Market share snapshot of major players - Cross Comparison Parameters (program portfolio breadth, interceptor performance metrics, sensor integration capability, production scalability, cost competitiveness, contract win rate, lifecycle support depth, compliance and security credentials)
- SWOT Analysis of Key Players
- Pricing and Commercial Model Benchmarking
- Detailed Profiles of Major Companies
Lockheed Martin Corporation
RTX Corporation
Northrop Grumman Corporation
Boeing Defense, Space & Security
L3Harris Technologies
General Dynamics Mission Systems
Leidos
BAE Systems Inc.
Aerojet Rocketdyne (L3Harris)
Kratos Defense & Security Solutions
Anduril Industries
Raytheon Missiles & Defense (RTX)
BlueHalo
Kongsberg Defence & Aerospace USA
Thales Defense & Security, Inc.
- Demand and utilization drivers
- Procurement and tender dynamics
- Buying criteria and vendor selection
- Budget allocation and financing preferences
- Implementation barriers and risk factors
- Post-purchase service expectations
- By Value, 2026–2035
- By Shipment Volume, 2026–2035
- By Active Systems, 2026–2035
- By Unit Economics, 2026–2035


 Request a Sample
 Ask for Customization
 Get a Quote
 Enquire Now