
 Download PDF
 Download PDF
Market Overview
The US naval vessels market current size stands at around USD ~ million, reflecting sustained procurement cycles, multi-year shipbuilding programs, and long-term fleet sustainment contracts that anchor demand across surface combatants, submarines, and auxiliary platforms. Budgetary continuity, fleet readiness requirements, and modernization priorities underpin spending stability. Programmatic commitments to new builds, mid-life upgrades, and lifecycle support create predictable ordering patterns, while domestic industrial base policies sustain production continuity and workforce retention.
Demand concentration is strongest along the Atlantic and Pacific seaboards, anchored by mature shipyard clusters and naval base infrastructure. Coastal cities with established dry docks, nuclear-certified facilities, and supplier ecosystems concentrate construction and sustainment activity. Proximity to fleet homeports supports operational maintenance cycles, while regional policy support, skilled labor pools, and logistics connectivity reinforce ecosystem maturity. These hubs benefit from dense networks of tier-one integrators, subsystem suppliers, testing facilities, and regulatory oversight institutions.
Market Segmentation
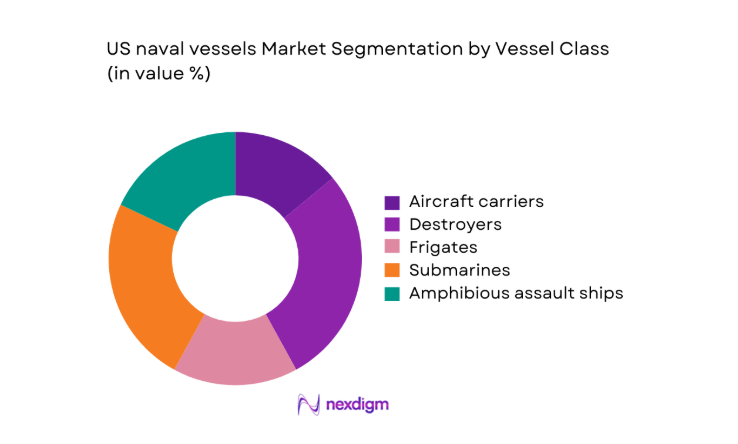
By Vessel Class
Surface combatants and submarines dominate procurement prioritization due to force structure goals emphasizing sea control, deterrence, and multi-domain operations. Aircraft carriers anchor power projection, while destroyers and frigates address air and missile defense, escort missions, and distributed operations. Submarines maintain strategic and conventional deterrence roles, sustaining steady build rates and complex sustainment needs. Amphibious vessels support expeditionary operations, while auxiliary platforms ensure replenishment and sealift continuity. Fleet mix decisions increasingly reflect survivability requirements, interoperability with allied navies, and modular upgrade pathways aligned with evolving threat environments and technology refresh cycles.
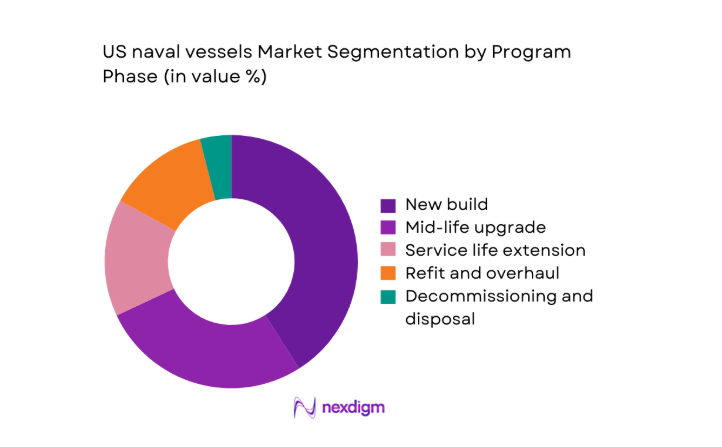
By Program Phase
New build programs command the largest allocation due to force expansion objectives and replacement of aging hulls, while mid-life upgrades extend operational relevance of legacy platforms. Service life extensions are prioritized for capital-intensive vessels to defer replacement timelines, balancing readiness with fiscal discipline. Refit and overhaul cycles remain structurally embedded due to deployment tempos and maintenance backlogs. Decommissioning and disposal activities, while smaller in share, are increasingly structured to recover components and manage environmental compliance, creating specialized service demand across certified yards and recycling facilities.
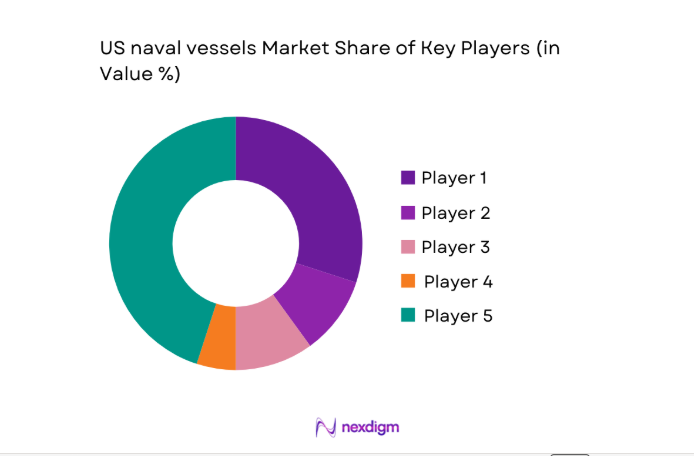
Competitive Landscape
The competitive landscape is characterized by a concentrated prime contractor base supported by specialized shipyards and systems integrators. Long program lifecycles, certification barriers, and capital intensity shape competitive positioning, while backlog visibility and delivery performance differentiate participants. Collaboration across hull construction, combat systems integration, and sustainment services underpins program execution.
| Company Name | Establishment Year | Headquarters | Formulation Depth | Distribution Reach | Regulatory Readiness | Service Capability | Channel Strength | Pricing Flexibility |
| Huntington Ingalls Industries | 2011 | United States | ~ | ~ | ~ | ~ | ~ | ~ |
| General Dynamics | 1899 | United States | ~ | ~ | ~ | ~ | ~ | ~ |
| Lockheed Martin | 1995 | United States | ~ | ~ | ~ | ~ | ~ | ~ |
| BAE Systems | 1999 | United Kingdom | ~ | ~ | ~ | ~ | ~ | ~ |
| Austal USA | 1999 | United States | ~ | ~ | ~ | ~ | ~ | ~ |
US naval vessels Market Analysis
Growth Drivers
Geopolitical competition and maritime security imperatives
Heightened maritime competition across contested sea lanes has expanded operational tempo for surface combatants and submarines. Naval deployments exceeded 210 cumulative ship-months in 2024, compared with 184 in 2022, increasing maintenance cycles and hull utilization. Freedom of navigation operations rose to 27 in 2025 from 19 in 2023, reinforcing readiness requirements. Regional security cooperation exercises reached 113 events in 2024, up from 86 in 2022, driving interoperability upgrades. Port visit counts increased to 642 in 2025 from 511 in 2023, stressing sustainment capacity. Fleet availability targets require 75 mission-ready hulls per quarter, supporting continuous modernization throughput.
US Navy fleet size expansion and force structure goals
Force structure planning emphasizes expansion of deployable hulls to address multi-theater commitments. Active fleet counts increased to 296 vessels in 2024 from 287 in 2022, while operationally available units averaged 203 in 2025 versus 191 in 2023. Maintenance backlog days reached 14,800 in 2024, up from 12,300 in 2022, accelerating yard utilization. Shipyard workforce certifications rose to 38,600 in 2025 from 34,900 in 2023, supporting throughput. Dry dock occupancy rates averaged 82 in 2024, compared with 74 in 2022, reinforcing sustained production and sustainment demand.
Challenges
Shipyard capacity constraints and labor shortages
Certified shipyard capacity remains constrained by workforce attrition and infrastructure limits. Skilled trades vacancies reached 9,400 positions in 2024, compared with 6,700 in 2022, delaying critical maintenance windows. Average time to fill nuclear-qualified roles extended to 168 days in 2025 from 121 in 2023. Dry dock utilization exceeded 85 during peak periods in 2024, compressing scheduling flexibility. Overtime hours averaged 14 per worker per week in 2025, elevating fatigue risks. Deferred maintenance events rose to 312 in 2024 from 219 in 2022, compounding readiness pressures across high-tempo fleets.
Cost overruns and schedule delays in complex programs
Complex integration requirements have driven schedule slippage across multi-year builds. Average schedule variance reached 11 months in 2024 compared with 7 months in 2022, reflecting subsystem integration bottlenecks. Design change orders increased to 146 in 2025 from 92 in 2023, disrupting production sequencing. Test and evaluation cycles expanded to 418 days in 2024, up from 361 in 2022, delaying acceptance milestones. Rework incidence averaged 4.6 events per hull in 2025 versus 3.1 in 2023, constraining throughput and absorbing limited engineering capacity within certified yards.
Opportunities
Next-generation destroyer and frigate programs
Next-generation surface combatant programs enable modernization aligned with distributed maritime operations. Prototype evaluations recorded 64 integrated system tests in 2024, compared with 39 in 2022, accelerating design maturation. Open-architecture adoption reached 23 certified modules in 2025 from 14 in 2023, improving upgrade velocity. Digital twin utilization expanded to 31 active hull models in 2024, up from 12 in 2022, compressing design iteration cycles. Test range availability increased to 17 operational windows in 2025 versus 11 in 2023, enabling parallel validation and reducing bottlenecks across program schedules.
Columbia-class and Virginia-class submarine expansion
Strategic deterrence and undersea dominance priorities support sustained submarine program throughput. Hull production lines supported 6 concurrent module assemblies in 2024, up from 4 in 2022, expanding parallelism. Qualified nuclear welders increased to 2,140 in 2025 from 1,780 in 2023, reducing critical path risks. Reactor component lead times shortened to 22 months in 2024 from 29 in 2022 through supplier qualification gains. Sea trials conducted reached 41 events in 2025 versus 28 in 2023, improving acceptance cadence and operational handover velocity.
Future Outlook
The outlook through 2035 reflects continued fleet modernization, deeper integration of digital engineering, and gradual relief of shipyard bottlenecks as infrastructure upgrades mature. Program execution discipline and workforce development will shape delivery confidence. Interoperability with allies and evolving mission concepts will guide platform design priorities.
Major Players
- Huntington Ingalls Industries
- General Dynamics
- Lockheed Martin
- BAE Systems
- Austal USA
- Bollinger Shipyards
- Fincantieri Marinette Marine
- L3Harris Technologies
- Northrop Grumman
- RTX Corporation
- Fairbanks Morse Defense
- Leonardo DRS
- BWX Technologies
- Gibbs & Cox
- Thoma-Sea Marine Constructors
Key Target Audience
- US Department of the Navy procurement offices
- Naval Sea Systems Command program executives
- Department of Defense acquisition authorities
- State-level maritime development agencies
- Shipyard operators and prime contractors
- Tier-one systems and component suppliers
- Fleet sustainment and MRO service providers
- Investments and venture capital firms
Research Methodology
Step 1: Identification of Key Variables
Core variables were defined across fleet composition, mission roles, lifecycle phases, and industrial capacity constraints. Program schedules, certification requirements, and sustainment cycles were mapped to operational readiness indicators. Regulatory and acquisition frameworks were incorporated to contextualize procurement pathways.
Step 2: Market Analysis and Construction
Program pipelines, production cadence, and maintenance backlogs were synthesized into an integrated demand framework. Ecosystem capacity, supplier qualification depth, and yard throughput were aligned with operational tempo indicators. Scenario logic reflected policy continuity and infrastructure constraints.
Step 3: Hypothesis Validation and Expert Consultation
Assumptions were validated through structured consultations with naval program stakeholders, shipyard operations leaders, and certification authorities. Cross-checks aligned design maturity, test cycles, and workforce readiness with operational deployment patterns to stress-test feasibility.
Step 4: Research Synthesis and Final Output
Findings were consolidated into coherent narratives linking operational demand, industrial capacity, and program execution risks. The final output integrates scenario insights, structural constraints, and forward-looking opportunity pathways to support strategic decision-making.
- Executive Summary
- Research Methodology (Market Definitions and vessel class taxonomy, US Navy budget and shipbuilding plan analysis, Naval Sea Systems Command and PEO Ships program interviews, Shipyard production capacity and backlog mapping, Fleet inventory and decommissioning data modeling, Congressional appropriations and authorization tracking, Defense industrial base supply chain validation)
- Definition and Scope
- Market evolution
- Fleet lifecycle and modernization pathways
- Ecosystem structure
- Shipbuilding and sustainment supply chain
- Regulatory and acquisition environment

- Growth Drivers
Geopolitical competition and maritime security imperatives
US Navy fleet size expansion and force structure goals
Modernization of aging surface combatant and submarine fleets
Technological upgrades for multi-domain operations
Sustained congressional support for shipbuilding budgets
Industrial base revitalization initiatives - Challenges
Shipyard capacity constraints and labor shortages
Cost overruns and schedule delays in complex programs
Supply chain fragility for critical components
Integration risks of advanced combat systems
Regulatory and acquisition process complexity
Long lead times for nuclear and specialized materials - Opportunities
Next-generation destroyer and frigate programs
Columbia-class and Virginia-class submarine expansion
Digital ship design and modular construction adoption
Lifecycle sustainment and modernization contracts
Public–private partnerships for yard modernization
Export of design services and subsystems to allies - Trends
Shift toward distributed maritime operations concepts
Increased electrification and power management systems
Open-architecture combat system integration
Additive manufacturing for spares and repairs
Lifecycle data analytics for fleet readiness
Greater emphasis on survivability and signature management - Government Regulations
- SWOT Analysis
- Stakeholder and Ecosystem Analysis
- Porter’s Five Forces Analysis
- Competition Intensity and Ecosystem Mapping
- By Value, 2020–2025
- By Volume, 2020–2025
- By Installed Base, 2020–2025
- By Average Selling Price, 2020–2025
- By Vessel Class (in Value %)
Aircraft carriers
Destroyers
Frigates
Submarines
Amphibious assault ships
Littoral combat ships
Auxiliary and support vessels - By Mission Role (in Value %)
Power projection
Sea control
Anti-submarine warfare
Amphibious operations
Logistics and replenishment
Intelligence, surveillance, and reconnaissance - By Propulsion Type (in Value %)
Nuclear-powered
Conventional gas turbine
Diesel-electric hybrid
Integrated electric propulsion - By Program Phase (in Value %)
New build
Mid-life upgrade
Service life extension
Refit and overhaul
Decommissioning and disposal
- Market structure and competitive positioning
Market share snapshot of major players - Cross Comparison Parameters (shipyard capacity utilization, program delivery track record, nuclear certification capability, combat system integration expertise, lifecycle sustainment footprint, supply chain resilience, cost control performance, technology partnerships)
- SWOT Analysis of Key Players
- Pricing and Commercial Model Benchmarking
- Detailed Profiles of Major Companies
Huntington Ingalls Industries
General Dynamics
Lockheed Martin
BAE Systems
Bollinger Shipyards
Fincantieri Marinette Marine
Austal USA
L3Harris Technologies
Northrop Grumman
RTX Corporation
Fairbanks Morse Defense
Leonardo DRS
BWX Technologies
Gibbs & Cox
Thoma-Sea Marine Constructors
- Demand and utilization drivers
- Procurement and tender dynamics
- Buying criteria and vendor selection
- Budget allocation and financing preferences
- Implementation barriers and risk factors
- Post-purchase sustainment and service expectations
- By Value, 2026–2035
- By Volume, 2026–2035
- By Installed Base, 2026–2035
- By Average Selling Price, 2026–2035


 Request a Sample
 Ask for Customization
 Get a Quote
 Enquire Now