

 Download PDF
Market Overview
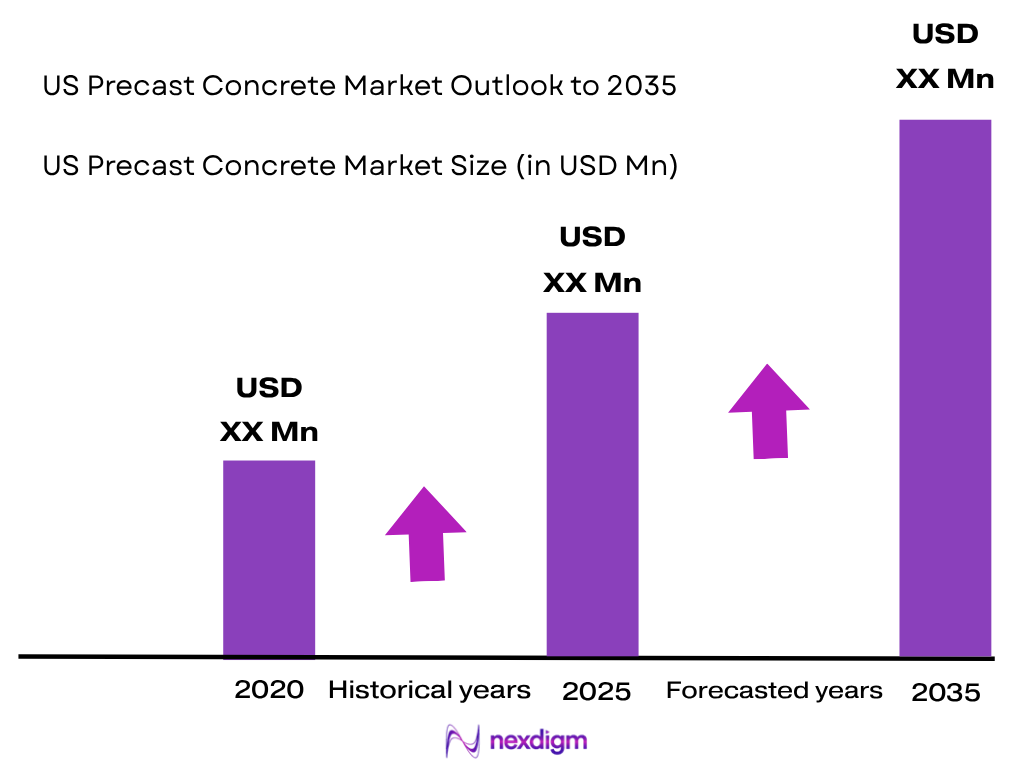
The US Precast Concrete Market was valued at approximately USD 20.91 billion in 2024, compared with USD 19.77 billion in 2023, based on the cited industry assessment. Demand is supported by structural building components, transportation infrastructure, underground utilities, commercial construction and factory-manufactured building systems. Structural building components represented the largest product category in the preceding base period, supported by precast concrete’s durability, controlled manufacturing, structural strength and ability to shorten on-site construction schedules. Grand View Research
The South, particularly Texas, Florida and the South Atlantic states, forms a major production and consumption center for US precast concrete. NPCA industry data identify Texas as the leading state by precast revenue and employment, while Florida leads by number of plants; the South Atlantic generates more precast revenue than other US regions. These markets benefit from extensive transportation networks, utility investment, population-driven development, industrial construction and dense regional precast manufacturing capacity.
Market Segmentation
By Product Type
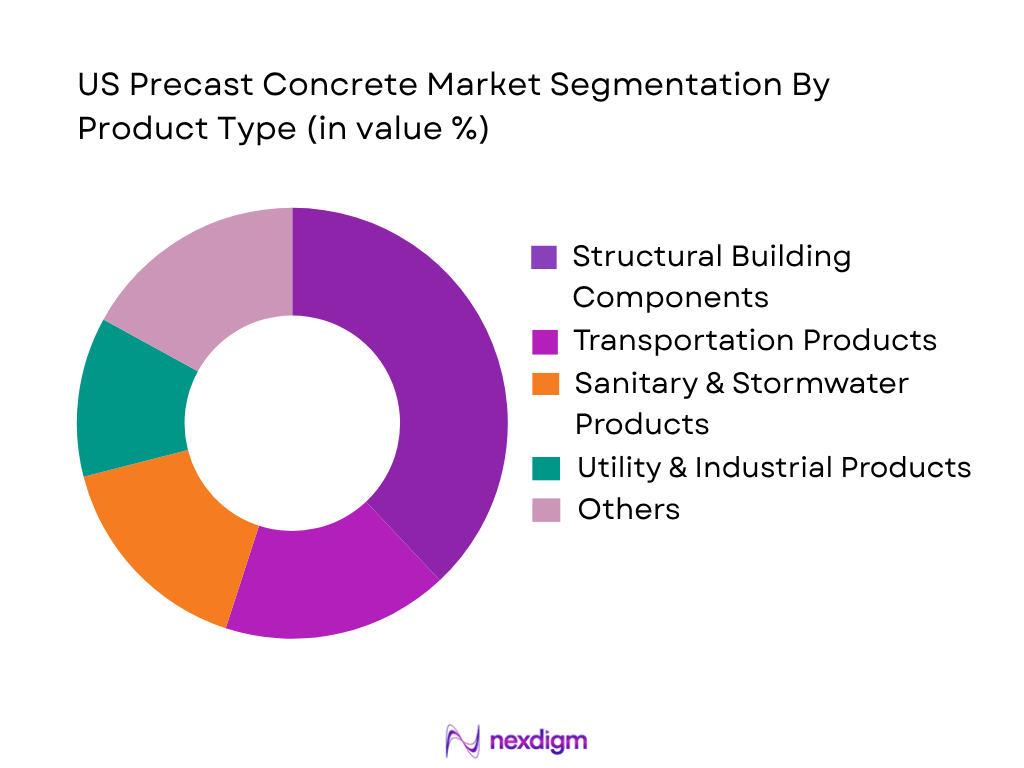
The US Precast Concrete Market is segmented by product type into structural building components, transportation products, sanitary and stormwater products, utility and industrial products, water and wastewater products, and landscape and building products. Structural building components represent a strategically dominant segment in the commercial market definition used for this report because precast beams, columns, wall panels, double tees, hollow-core slabs and floor systems allow structural work to shift from the jobsite to controlled manufacturing environments. Factory casting improves dimensional consistency and enables production to occur simultaneously with site preparation. Precast structural systems are particularly applicable to parking structures, warehouses, institutional buildings, multifamily developments, data centers and industrial facilities. The wider industry also has substantial infrastructure exposure: NPCA identifies sanitary and stormwater, utility and industrial, transportation, and water and wastewater products as major revenue-generating categories. This diversity reduces dependence on a single construction end market and makes infrastructure modernization an important source of demand.
By Application
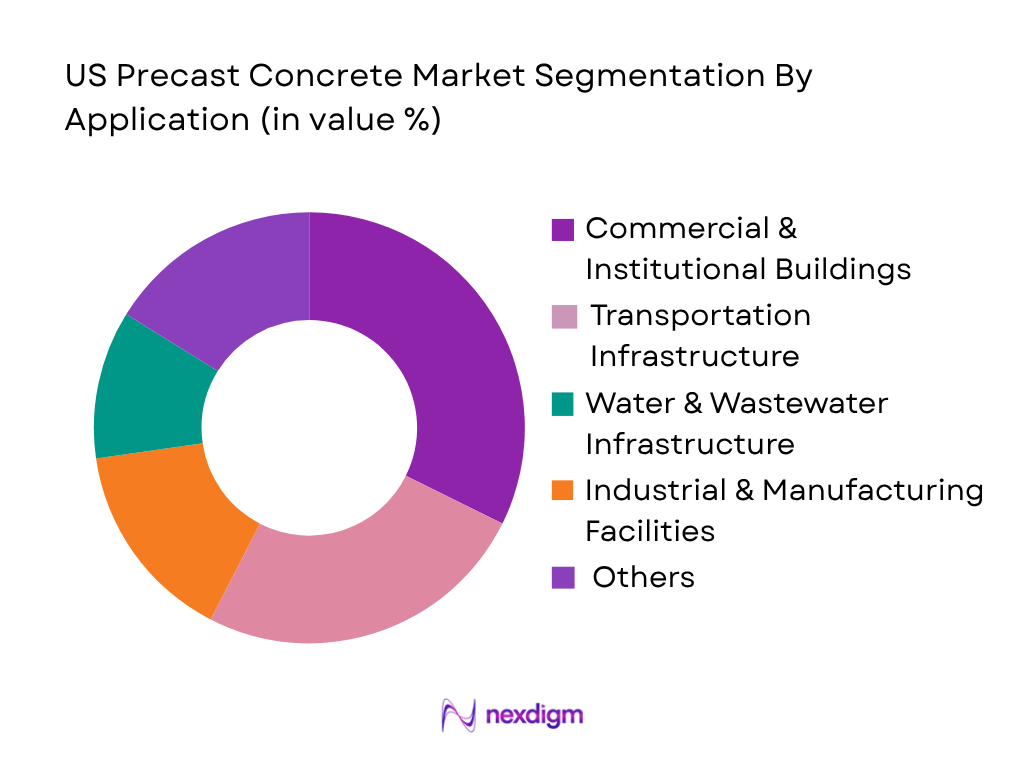
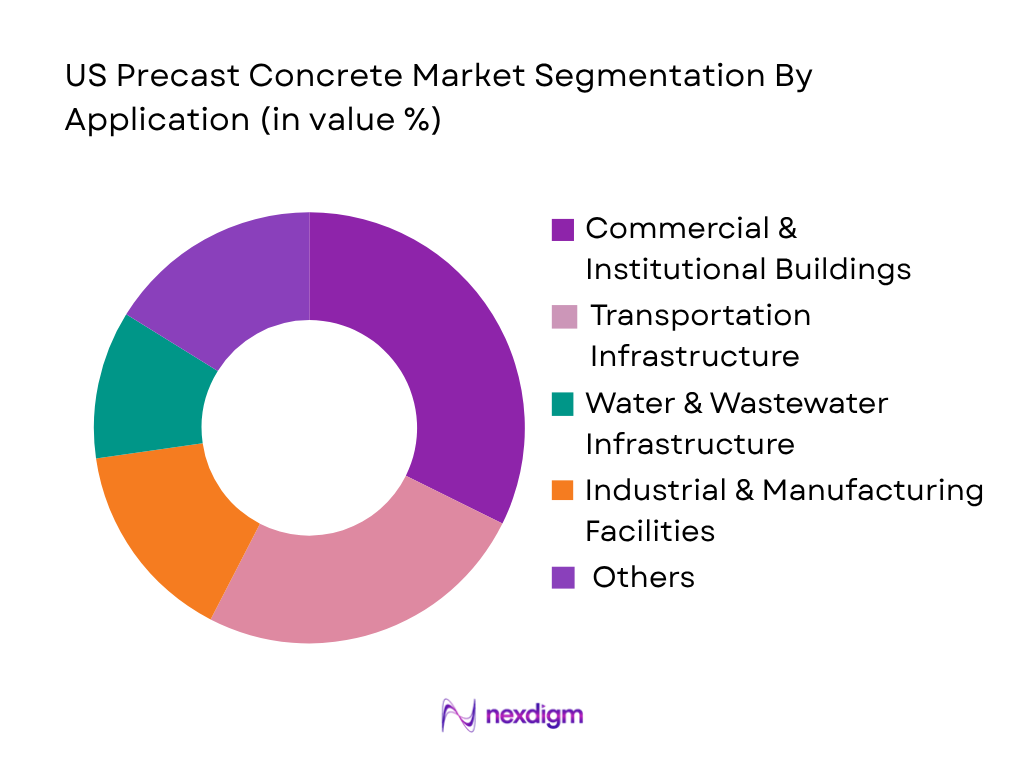
The US Precast Concrete Market is segmented by application into commercial and institutional buildings, transportation infrastructure, water and wastewater infrastructure, industrial and manufacturing facilities, residential and multifamily buildings, and utilities and energy infrastructure. Commercial and institutional construction represents a major building-oriented application because precast systems combine structural framing, enclosure, fire resistance and architectural finishes while reducing dependence on sequential field trades. Parking structures are especially suited to prestressed double tees, beams, columns, spandrels and wall systems. Institutional applications include schools, healthcare buildings, civic facilities and public structures, while data centers and manufacturing facilities are creating additional opportunities for repeatable structural and enclosure components. Infrastructure applications remain equally important because concrete pipe, culverts, manholes, utility vaults, bridge elements, barriers and stormwater structures form part of essential transportation and utility networks. NPCA specifically identifies infrastructure, residential and non-residential construction as core precast applications.
Competitive Landscape
The US Precast Concrete Market combines large multi-state platforms with regional specialists. Competition depends strongly on manufacturing geography because precast components are heavy and transportation-sensitive. Major suppliers differentiate through plant networks, prestressing capability, engineering and design-assist services, architectural finishing, erection capability and exposure to infrastructure, data centers, parking structures and institutional construction. Consolidation is also reshaping the industry: Wells acquired GATE Precast and subsequently integrated that business into its unified national platform.
| Company | Establishment Year | Headquarters | Core Precast Capability | Key Products | Primary End Markets | Manufacturing Footprint | Engineering Capability | Installation/Erection Capability |
| Oldcastle Infrastructure | 1965* | Atlanta, Georgia | ~ | ~ | ~ | ~ | ~ | ~ |
| Wells | 1950s-era operations | Albany, Minnesota | ~ | ~ | ~ | ~ | ~ | ~ |
| Tindall Corporation | 1963 | Spartanburg, South Carolina | ~ | ~ | ~ | ~ | ~ | ~ |
| Metromont | 1925 | Greenville, South Carolina | ~ | ~ | ~ | ~ | ~ | ~ |
| Coreslab Structures | 1975 | Stoney Creek, Ontario | ~ | ~ | ~ | ~ | ~ | ~ |
US Precast Concrete Market Analysis
Growth Drivers
Infrastructure Renewal and Transportation Construction Supporting Structural Precast Demand
US infrastructure renewal is strengthening the addressable demand base for precast bridge elements, box culverts, barriers, drainage structures, retaining systems, utility vaults and prestressed structural components. Federal Highway Administration data recorded 623,218 bridges in its 2024 National Bridge Inventory dataset, comprising 274,859 bridges in good condition, 306,279 in fair condition and 42,080 in poor condition. The associated bridge deck inventory covered approximately 406.6 million square meters, including 19.8 million square meters classified as poor, demonstrating the physical scale of assets requiring continuing rehabilitation and replacement activity. Federal Highway Administration Texas alone contained 56,729 bridges, while Illinois had 26,928, Ohio 26,729, and California 25,848, creating geographically distributed demand for transportation-oriented precast manufacturing. Federal Highway Administration The wider macroeconomic environment provides additional capacity for infrastructure deployment: World Bank data place the US population at 340,110,988 people in 2024, supporting extensive transportation, municipal and utility networks. World Bank Open Data For precast producers, the significance lies in repeatable infrastructure components that can be manufactured under controlled plant conditions and transported for accelerated installation. Bridge rehabilitation, highway expansion and drainage modernization therefore create recurring demand for standardized and project-engineered precast concrete products across state and municipal infrastructure programs.
Water, Wastewater and Stormwater Modernization Expanding Precast Infrastructure Applications
Water infrastructure investment is another substantial demand driver for US precast concrete because treatment plants, transmission systems, stormwater networks and wastewater facilities consume manholes, concrete pipe, box culverts, catch basins, utility structures, tanks and other factory-produced concrete components. In September 2024, the US Environmental Protection Agency made USD 7.5 billion in WIFIA financing available for water infrastructure projects, alongside USD 50 billion secured for water infrastructure under the Bipartisan Infrastructure Law. US EPA Individual projects demonstrate the physical investment pipeline: EPA provided USD 196 million for Indiana drinking-water and wastewater projects serving 134,000 residents, while Pflugerville, Texas received USD 156 million for drinking-water infrastructure improvements. US EPA Central Florida’s Toho Water Authority received USD 188.3 million for infrastructure serving more than 450,000 residents, and King County received USD 194 million for wastewater improvements. US EPA This investment operates against a national population base of 340,110,988 people, according to World Bank 2024 data. World Bank Open Data These programs directly support precast demand because underground water and stormwater networks require durable, repeatable concrete structures capable of standardized factory production and rapid field installation.
Market Challenges
Heavy Product Logistics and Geographic Constraints on Precast Plant Service Areas
Transportation remains a structural challenge for US precast concrete because finished components combine substantial weight, large dimensions and project-specific delivery schedules, making production geography important to supplier competitiveness. The scale of the national construction ecosystem magnifies this issue. US Census Bureau data show USD 3.239 trillion in employer revenue across the construction sector in 2024, including USD 1.308 trillion from construction of buildings and USD 491.349 billion from heavy and civil engineering construction. Census Data Serving this geographically dispersed activity requires manufacturers to coordinate plant capacity, specialized trailers, lifting equipment, permitted routes and erection sequencing. Transportation infrastructure itself spans 620,762 public-road bridges across the 50 states and Washington, D.C., including 146,594 National Highway System bridges and 58,504 interstate bridges, illustrating the breadth of the physical network over which heavy precast components must move. Federal Highway Administration World Bank data record 340,110,988 US residents in 2024, reinforcing the geographic dispersion of construction demand across metropolitan and regional markets. World Bank Open Data Consequently, precast manufacturers cannot treat national construction demand as a single frictionless market: plant proximity, permissible transportation dimensions, delivery sequencing and erection access materially influence which projects can be supplied efficiently.
Aging Infrastructure Creates Execution Pressure Alongside Large Replacement Requirements
Aging infrastructure creates demand for precast concrete but simultaneously creates an execution challenge because producers must support replacement programs while managing manufacturing capacity, project-specific engineering and accelerated construction schedules. Federal Highway Administration records identify 42,080 bridges in poor condition within the 2024 National Bridge Inventory dataset, covering approximately 19.77 million square meters of deck area. Another 306,279 bridges were categorized as fair, indicating a considerably larger asset base requiring continued inspection, maintenance and eventual rehabilitation. Federal Highway Administration California alone recorded 1,527 poor bridges, while West Virginia recorded 1,370 and Wisconsin 942, demonstrating that rehabilitation requirements are distributed across multiple regional precast markets rather than concentrated in one corridor. Federal Highway Administration At the same time, the US construction sector generated approximately USD 3.239 trillion in employer revenue during 2024, according to the Census Bureau, showing the substantial workload competing for contractors, engineering resources and manufacturing capacity. Census Data World Bank data place the national population at 340.1 million people, increasing the importance of keeping essential infrastructure operational during rehabilitation. World Bank Open Data Precast suppliers therefore face simultaneous requirements for production scale, engineering accuracy, transportation coordination and rapid erection while infrastructure owners seek to minimize service disruptions.
Market Opportunities
Expansion of Water Infrastructure Programs Creating a Larger Pipeline for Precast Utility Products
Current federal water investment provides a strong foundation for future expansion of precast concrete applications in underground infrastructure. EPA made USD 7.5 billion of WIFIA financing available in 2024, consisting of USD 6.5 billion through WIFIA and USD 1 billion through SWIFIA, creating financing capacity for drinking-water, wastewater and stormwater projects. US EPA The active project base illustrates the diversity of future precast applications: Portland received a USD 319 million WIFIA loan for its Bull Run treatment program, supporting infrastructure serving nearly 1 million residents; Indiana received USD 196 million for statewide projects serving 134,000 residents; and Toho Water Authority received USD 188.3 million for systems serving more than 450,000 residents. US EPA Against a US population of 340,110,988 people in 2024, according to the World Bank, continuing modernization of municipal systems represents a broad infrastructure requirement rather than an isolated project cycle. World Bank Open Data This creates expansion opportunities for producers of precast pipe, manholes, vaults, chambers, culverts, treatment structures and stormwater products, particularly manufacturers positioned near metropolitan utilities and high-investment regional infrastructure corridors.
Industrial and Off-Site Construction Creating Opportunities for Higher-Value Structural Precast Systems
The scale of US industrial and building activity creates an opportunity for precast manufacturers to move further into engineered structural systems, wall panels, columns, beams, floor systems and repeatable off-site assemblies. Census Bureau data show that US construction businesses generated approximately USD 3.239 trillion in employer revenue in 2024, with construction of buildings contributing USD 1.308 trillion and heavy and civil engineering construction contributing USD 491.349 billion. Census Data Manufacturing businesses simultaneously generated approximately USD 6.981 trillion in employer shipments or revenue, demonstrating the scale of the domestic industrial base that requires factories, warehouses, utility infrastructure and associated built assets. Census Data The World Bank recorded 340,110,988 US residents in 2024, while the IMF reports a US population of approximately 342.942 million in its 2026 country profile, underscoring the continuing scale of the economy and its built-environment requirements. World Bank Open Data These conditions favor precast solutions where developers require repeatability and construction sequencing advantages. Manufacturers capable of integrating structural engineering, prestressing, architectural finishes, digital fabrication and erection coordination can address increasingly complex industrial, logistics, institutional and infrastructure projects while extending precast beyond conventional commodity products.
Future Outlook
The US Precast Concrete Market is expected to expand through 2035 as infrastructure renewal, water systems, transportation projects, data-center construction and off-site building methods create additional applications for factory-manufactured concrete components. The market should increasingly shift toward design-assist delivery, automated manufacturing, high-performance mixes and integrated structural-envelope systems. Infrastructure legislation and domestic-content requirements should also influence sourcing and plant investment, while transportation economics will continue to favor strategically located regional manufacturing facilities.
Data centers represent a particularly relevant opportunity because repeatable structural layouts, compressed project schedules and large-scale construction programs align with precast manufacturing. Water and wastewater infrastructure provides another durable demand base for pipe, manholes, culverts, vaults and treatment structures. Meanwhile, environmental product declarations and embodied-carbon requirements are encouraging manufacturers to measure plant- and product-specific environmental impacts. NPCA notes that some jurisdictions increasingly require plant-specific or product-specific Type III EPDs. NPCA
Major Players
- Oldcastle Infrastructure
- Wells
- Tindall Corporation
- Metromont
- GATE Precast Company
- Coreslab Structures
- Kerkstra Precast
- Forterra
- Jensen Precast|
- County Materials Corporation
- Nitterhouse Concrete Products
- Enterprise Precast Concrete
- High Concrete Group
- Molins Precast Solutions
- Mack Industries
Key Target Audience
- Precast and Prestressed Concrete Manufacturers
- Cement, Aggregate, Reinforcing Steel and Prestressing Strand Suppliers
- General Contractors and Precast Erection Contractors
- Real Estate, Industrial and Infrastructure Developers
- Transportation, Water, Wastewater and Utility Infrastructure Owners
- Engineering, Architecture and Design-Build Organizations
- Investments and Venture Capitalist Firms
- Government and Regulatory Bodies (Federal Highway Administration, US Department of Transportation, US Environmental Protection Agency, Occupational Safety and Health Administration, General Services Administration, State Departments of Transportation)
Research Methodology
Step 1: Identification of Key Variables
The initial phase involves mapping the US Precast Concrete Market ecosystem across cement and aggregate suppliers, precast manufacturers, prestressing facilities, contractors, engineers, transportation providers, infrastructure agencies and developers. Product-level variables include wall panels, double tees, hollow-core slabs, beams, girders, pipes, culverts, utility vaults and bridge components. Plant locations and production capabilities are incorporated because transportation radius materially affects competition.
Step 2: Market Analysis and Construction
Historical market construction combines producer-level revenue, precast production, construction activity, infrastructure investment, plant capacity and application demand. A bottom-up model assesses major manufacturers, production facilities and product categories, while the top-down framework evaluates construction and infrastructure activity. Cross-checks distinguish structural precast from underground, transportation, utility, architectural and water-management products to reduce double counting.
Step 3: Hypothesis Validation and Expert Consultation
Market hypotheses are validated through structured interviews with precast producers, plant managers, structural engineers, contractors, procurement executives, distributors and infrastructure stakeholders. Interviews assess plant utilization, product mix, transportation radius, lead times, prestressing capacity, bidding conditions and application demand. Findings are compared with secondary industry evidence and company disclosures to refine market assumptions and competitive positioning.
Step 4: Research Synthesis and Final Output
The final phase triangulates producer information, construction indicators, infrastructure programs and expert inputs. Bottom-up production estimates are reconciled with demand from commercial buildings, transportation, water infrastructure, utilities, industrial facilities and residential applications. Forecast scenarios incorporate plant expansion, prefabrication adoption, data-center construction, infrastructure modernization, manufacturing automation and low-carbon concrete development to establish the final US Precast Concrete Market outlook.

- Executive Summary
- Research Methodology (Market Definitions and Assumptions, US Precast Concrete Market Classification, Precast and Prestressed Concrete Scope, Product Mapping, Structural Component Mapping, Infrastructure Product Mapping, Architectural Precast Assessment, Structural Precast Assessment, Prestressed Concrete Assessment, Precast Pipe Assessment, Utility Structure Assessment, Bridge Component Assessment, Hollow-Core Slab Assessment, Double-Tee Assessment, Wall Panel Assessment, Production Capacity Assessment, Plant Utilization Assessment, PCI-Certified Plant Mapping, NPCA Producer Ecosystem Assessment, Supply-Side Assessment, Demand-Side Assessment, Top-Down Market Sizing, Bottom-Up Market Sizing, Primary Industry Interviews, Construction and Infrastructure Project Pipeline Assessment, Data Triangulation, Forecasting Framework)

- Definition and Scope
- US Precast Concrete Industry Evolution and Development of Structural Precast Systems, Prestressed Concrete Systems, Architectural Precast, Total Precast Buildings, Precast Wall Panels, Double Tees, Hollow-Core Slabs, Precast Beams and Girders, Precast Concrete Pipes, Box Culverts, Utility Vaults, Bridge Components, Modular Precast Systems, High-Performance Concrete, Automated Casting Technologies, Low-Carbon Precast Concrete
- Precast Concrete Value Chain Analysis
- Precast Concrete Supply Chain Analysis
- Cement Suppliers, Aggregate Producers, Supplementary Cementitious Material Suppliers, Reinforcing Steel Suppliers, Prestressing Strand Suppliers, Admixture Suppliers, Formwork and Mold Providers, Precast Manufacturing Plants, Prestressing Facilities, Engineering and Design Companies, Heavy-Haul Transportation Providers, Crane and Erection Contractors, General Contractors, Real Estate Developers, State Departments of Transportation, Municipalities, Utilities, Infrastructure Authorities, Certification and Testing Organizations

- Growth Drivers (Federal Infrastructure Investment, Bridge Replacement and Rehabilitation, Water and Wastewater Infrastructure Expansion, Data Center Construction, Off-Site Construction Adoption, Labor Productivity Requirements, Faster Construction Schedules, Industrial Megaproject Development, Parking Structure Demand, Resilient Infrastructure Investment, Utility Network Modernization, Standardized Component Manufacturing)
- Market Challenges (Heavy Component Transportation Constraints, Crane and Erection Requirements, Prestressing Steel Availability, Cement and Aggregate Supply Constraints, Skilled Plant Labor Requirements, Connection Engineering Complexity, Regional Manufacturing Coverage, Freight Radius Limitations, Project-Specific Mold Requirements, Capital-Intensive Manufacturing Plants, Construction Cycle Volatility, Late-Stage Design Modification Constraints)
- Market Opportunities (Data Center Structural Systems, Water and Wastewater Structures, Bridge Components, Utility Vaults, Total Precast Buildings, Institutional Construction, Modular Concrete Systems, Low-Carbon Concrete, Accelerated Bridge Construction, Precast Pavement Systems, Stormwater Management Infrastructure, Domestic-Sourcing-Compliant Infrastructure Products)
- Market Trends (Total Precast Construction, Design-Assist Procurement, Prefabrication and Off-Site Manufacturing, High-Performance Concrete, Self-Consolidating Concrete, Digital Production Planning, BIM-to-Fabrication Integration, Automated Reinforcement Placement, Robotic Mold Production, Carbon-Reduced Mix Designs, Supplementary Cementitious Material Adoption, Embedded Sensors, Digital Quality Control)
- Government Regulations and Standards (ACI Structural Concrete Requirements, ACI/PCI Structural Precast Requirements, PCI Certification Requirements, NPCA Plant Certification Requirements, ASTM Precast Product Standards, AASHTO Specifications, FHWA Requirements, Build America Buy America Requirements, State DOT Specifications, OSHA Plant and Erection Requirements, Environmental Permitting Requirements, Reinforcing and Prestressing Steel Standards)
- SWOT Analysis
- Porter’s Five Forces Analysis
- PESTLE Analysis
- Stakeholder Ecosystem
Precast Concrete Production and Construction Ecosystem

- By Market Value (2020-2025)
- By Precast Concrete Production Volume (2020-2025)
- By Precast and Prestressed Concrete Shipment Volume (2020-2025)
- By Structural Precast Production Volume (2020-2025)
- By Architectural Precast Production Volume (2020-2025)
- By Infrastructure Precast Production Volume (2020-2025)
- By Precast Concrete Pipe Production Volume (2020-2025)
- By Precast Wall Panel Production Volume (2020-2025)
- By Hollow-Core Slab Production Volume (2020-2025)
- By Double-Tee Production Volume (2020-2025)
- By Bridge Component Production Volume (2020-2025)
- By Utility and Underground Structure Production Volume (2020-2025)
- By Installed Precast Concrete Volume (2020-2025)
- By Production Capacity Utilization (2020-2025)

- By Product Type (In Value %)
Structural Building Components
Architectural Precast Panels
Precast Wall Panels
Prestressed Beams and Girders
Columns and Beams
Double Tees
Hollow-Core Slabs
Precast Floor and Roof Systems
Precast Concrete Pipes
Box Culverts
Manholes and Utility Vaults
Drainage Structures
Bridge Components
Noise Barriers and Retaining Walls
Precast Foundations and Piles - By Construction System (In Value %)
Structural Precast Systems
Prestressed Concrete Systems
Total Precast Building Systems
Architectural Precast Systems
Precast Envelope Systems
Hybrid Precast-Steel Systems
Hybrid Precast-Cast-in-Place Systems
Modular Precast Concrete Systems - By Application (In Value %)
Commercial Buildings
Institutional Buildings
Parking Structures
Residential Buildings
Industrial and Warehouse Buildings
Data Centers
Manufacturing Facilities
Bridges and Transportation Infrastructure
Water and Wastewater Infrastructure
Utility Infrastructure
Energy Infrastructure
Marine Structures
Government and Defense Facilities - By Manufacturing Technology (In Value %)
Conventional Wet-Cast Precast
Prestressed Precast
Dry-Cast Concrete
Self-Consolidating Concrete Precast
High-Performance Concrete Precast
Automated Precast Production
Modular and Volumetric Precast
Low-Carbon Precast Concrete - By Region (In Value %)
Northeast
Midwest
South
West

- Market Share of Major Players (By US Revenue, Precast Production Capacity, Number of Manufacturing Plants, Structural Precast Capacity, Prestressed Concrete Capacity, Architectural Precast Capability, Infrastructure Product Portfolio, PCI-Certified Capacity, NPCA-Certified Capacity, Geographic Coverage, Engineering and Design-Assist Capability, Heavy-Haul Capability, Erection Capability, Major Project Portfolio)
- Cross Comparison Parameters (Annual Precast Production Capacity, Manufacturing Plant Network, Structural and Prestressed Product Breadth, Infrastructure Product Portfolio, Prestressing and Long-Span Capability, Engineering and Design-Assist Capability, Heavy-Haul and Erection Capability, PCI and NPCA-Certified Manufacturing Footprint)
- SWOT Analysis of Major Players
- Competitive Positioning Matrix
- Major Companies
Oldcastle Infrastructure
Wells
Tindall Corporation
Metromont
GATE Precast Company
Coreslab Structures
Kerkstra Precast
Forterra
Jensen Precast
County Materials Corporation
Nitterhouse Concrete Products
Enterprise Precast Concrete
High Concrete Group
Molins Precast Solutions
Mack Industries

- Real Estate Developer Precast Requirement Assessment
- General Contractor Procurement Assessment
- Precast Erection Contractor Requirement Analysis
- Structural Engineer Specification Assessment
- State DOT Precast Procurement Assessment
- Commercial Building Precast Requirement Assessment
- Parking Structure Precast Requirement Assessment
- Data Center Precast Requirement Assessment
- Industrial and Warehouse Precast Requirement Assessment
- Bridge and Transportation Precast Assessment
- Water and Wastewater Utility Precast Assessment
- Precast Performance Requirement Assessment (Structural Load Capacity, Compressive Strength, Prestressing Performance, Fire Resistance, Freeze-Thaw Resistance, Chloride Resistance, Water Tightness, Durability, Service Life, Installation Speed)

- By Market Value (2026-2035)
- By Precast Concrete Production Volume (2026-2035)
- By Structural Precast Production Volume (2026-2035)
- By Prestressed Concrete Production Volume (2026-2035)
- By Architectural Precast Production Volume (2026-2035)
- By Infrastructure Precast Production Volume (2026-2035)
- By Precast Concrete Pipe Production Volume (2026-2035)
- By Bridge Component Production Volume (2026-2035)
- By Water and Wastewater Precast Demand (2026-2035)
- By Data Center Precast Demand (2026-2035)
- By Parking Structure Precast Demand (2026-2035)
- By Industrial and Manufacturing Precast Demand (2026-2035)
- By Total Precast Building System Demand (2026-2035)
- By Low-Carbon Precast Concrete Demand (2026-2035)


 Request a Sample
 Ask for Customization
 Get a Quote
 Enquire Now