
 Download PDF
 Download PDF
Market Overview
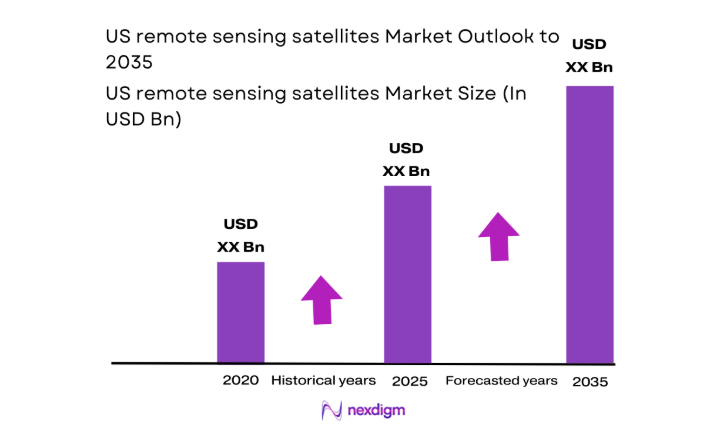
The US remote sensing satellites market current size stands at around USD ~ million, reflecting sustained deployment of imaging constellations and analytics integration across civil, commercial, and security applications. Investment flows remain directed toward constellation replenishment, sensor upgrades, and data processing platforms, with contract structures supporting multi-year service continuity. The market exhibits steady demand from environmental monitoring, infrastructure assessment, and situational awareness use cases, supported by long-term procurement cycles and expanding commercial adoption across downstream sectors nationwide.
Activity concentrates in California, Colorado, Virginia, Texas, and Florida, where launch services, spacecraft manufacturing, ground infrastructure, and analytics ecosystems cluster. Demand intensity aligns with proximity to federal agencies, defense installations, and commercial geospatial service hubs. Mature spaceflight infrastructure, experienced engineering talent pools, and supportive policy frameworks encourage rapid mission iteration. Strong data science communities and cloud integration capabilities further reinforce these regional nodes as centers for innovation, operations scaling, and enterprise adoption.
Market Segmentation
By Payload Type
Optical imaging remains the dominant payload category due to its broad applicability across mapping, urban planning, agriculture, and environmental monitoring workflows. High-resolution optical sensors are favored for regulatory reporting, infrastructure inspection, and disaster response coordination, supported by mature analytics pipelines and interoperability with legacy geospatial systems. Multispectral and hyperspectral payloads are gaining traction for resource monitoring and precision agriculture, while synthetic aperture radar expands adoption for persistent monitoring in adverse weather. Thermal infrared payloads serve niche monitoring needs, particularly for energy and wildfire assessment. The dominance of optical payloads is reinforced by established downstream user familiarity, standardized procurement specifications, and integration into existing geospatial data platforms across federal and commercial ecosystems.

By Application
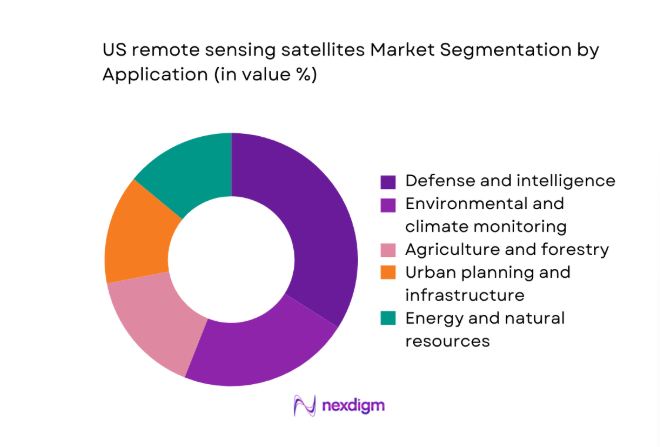
Defense and intelligence applications dominate demand due to persistent situational awareness needs, mission-critical reliability requirements, and integration with national security workflows. Environmental and climate monitoring follows closely, driven by regulatory compliance, disaster preparedness, and interagency coordination requirements. Agriculture and forestry applications expand through precision monitoring and yield optimization programs, while urban planning and infrastructure management leverage change detection and asset monitoring. Energy and natural resources applications remain selective but strategic for pipeline monitoring and offshore operations. Disaster management adoption continues to grow through rapid response frameworks and insurance-driven assessments. Dominance in defense and intelligence is sustained by long-term program continuity, specialized data requirements, and secure integration frameworks supporting classified and unclassified operational use.
Competitive Landscape
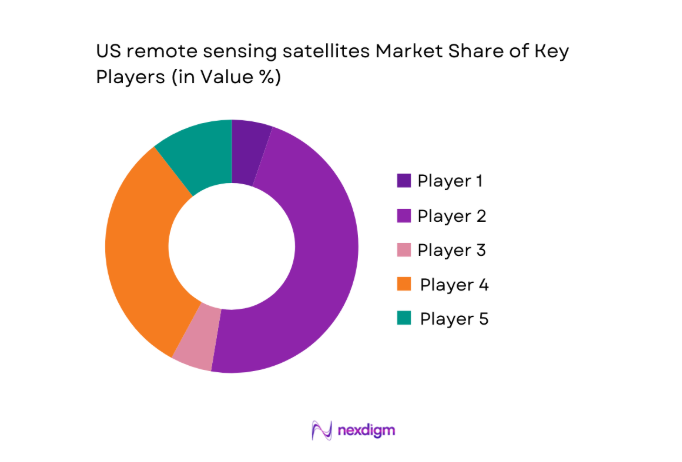
The competitive landscape is characterized by vertically integrated satellite operators, payload specialists, and analytics providers competing on constellation performance, data timeliness, regulatory readiness, and service integration across federal and commercial channels.
| Company Name | Establishment Year | Headquarters | Formulation Depth | Distribution Reach | Regulatory Readiness | Service Capability | Channel Strength | Pricing Flexibility |
| Maxar Technologies | 1969 | United States | ~ | ~ | ~ | ~ | ~ | ~ |
| Planet Labs | 2010 | United States | ~ | ~ | ~ | ~ | ~ | ~ |
| BlackSky | 2014 | United States | ~ | ~ | ~ | ~ | ~ | ~ |
| Capella Space | 2016 | United States | ~ | ~ | ~ | ~ | ~ | ~ |
| Spire Global | 2012 | United States | ~ | ~ | ~ | ~ | ~ | ~ |
US remote sensing satellites Market Analysis
Growth Drivers
Rising US defense and intelligence demand for persistent ISR
Persistent ISR demand intensified as operational theaters required near-continuous coverage, with 2022 authorizations enabling expanded tasking windows and 2023 procurement cycles prioritizing revisit cadence. The Department of Defense increased low earth orbit tasking frequencies from 12 to 24 passes daily for select regions, while interagency coordination frameworks expanded data sharing nodes from 6 to 11 locations in 2024. Secure ground stations rose from 38 to 57 sites supporting classified ingestion pipelines. In 2025, cloud ingestion endpoints supporting ISR workflows scaled from 9 to 16, reducing latency. Training cohorts for geospatial analysts expanded from 2,400 to 3,200 personnel across federal units.
Expansion of commercial earth observation analytics adoption
Commercial adoption accelerated as infrastructure operators integrated imagery analytics into asset management workflows across 2022 and 2023, expanding monitored asset nodes from 14,000 to 27,000 sites nationwide. Energy corridor monitoring programs increased inspection intervals from quarterly to monthly in 2024, supported by automation pipelines processing 4,800 scenes daily. Insurance loss assessment programs expanded adjuster geospatial access seats from 6,500 to 9,300 in 2025, shortening claim cycle times by 18 days. Municipal planning departments increased active geospatial workstations from 1,200 to 2,050 between 2023 and 2025, improving permitting review throughput and compliance monitoring using standardized imagery layers integrated with cloud GIS platforms.
Challenges
High capital intensity of constellation deployment and refresh
Constellation refresh cycles shortened from 5 to 3 years between 2022 and 2025, increasing replacement frequency and operational complexity. Launch scheduling constraints limited annual deployment windows from 14 to 9 slots in 2023 due to range congestion, compressing replenishment timelines. Payload qualification campaigns expanded from 7 to 13 test protocols in 2024 to meet mission assurance standards, extending preflight integration by 11 weeks. Ground segment scaling required expanding antenna networks from 22 to 41 nodes by 2025, increasing coordination burdens across sites. Workforce certification requirements rose from 4 to 7 modules for mission operators, constraining rapid staffing and onboarding during peak deployment cycles.
Regulatory constraints under NOAA remote sensing licensing
Regulatory review cycles extended from 120 to 210 days between 2022 and 2024 as licensing frameworks incorporated new sensor modalities. Compliance documentation expanded from 38 to 64 technical artifacts per mission, increasing preparation workloads for engineering teams. Security review checkpoints increased from 3 to 6 gates in 2023, lengthening approval sequences for higher resolution payloads. In 2025, reporting cadence for operational changes shifted from annual to quarterly submissions, requiring 4 cycles per year of updates. Interagency coordination meetings increased from 8 to 15 sessions annually, stretching legal and compliance resources and delaying schedule certainty for launch readiness and commercial contracting milestones.
Opportunities
Growth in SAR demand for all-weather imaging use cases
All-weather imaging demand rose as coastal resilience programs expanded coverage areas from 19 to 31 zones across 2022 to 2025, requiring uninterrupted observation during storm seasons. Floodplain mapping initiatives increased update frequency from annual to bi-monthly in 2024, supporting infrastructure resilience planning across 146 counties. Transportation agencies adopted nighttime corridor monitoring, expanding monitored route miles from 22,000 to 41,000 by 2025. Emergency management operations integrated rapid tasking protocols, reducing response mobilization windows from 48 to 12 hours. These shifts reflect durable institutional requirements for consistent coverage independent of cloud conditions, creating sustained pull for radar-based capabilities integrated into operational decision systems.
Commercial contracts with energy, insurance, and logistics sectors
Commercial contracting expanded as energy pipeline monitoring programs increased inspection cycles from 4 to 12 annually between 2022 and 2025, improving anomaly detection coverage across 68,000 route miles. Insurance catastrophe modeling teams expanded geospatial ingestion nodes from 18 to 37 in 2024, enabling faster post-event assessments across 112 counties. Logistics firms integrated port congestion monitoring into routing systems, increasing active terminals covered from 26 to 59 by 2025. These institutionalized workflows demonstrate recurring operational demand embedded into enterprise systems, supporting scalable service contracts and long term utilization anchored in compliance reporting, risk management, and network optimization requirements.
Future Outlook
The outlook through 2035 reflects sustained constellation modernization, deeper integration of analytics into operational workflows, and expanding dual-use applications across civil and security domains. Regulatory harmonization and licensing process optimization are expected to improve deployment predictability. Continued growth in all-weather sensing and data fusion with AI platforms will shape mission architectures. Partnerships across public agencies and commercial users will further embed remote sensing into routine decision-making processes.
Major Players
- Maxar Technologies
- Planet Labs
- BlackSky
- Capella Space
- Iceye US
- HawkEye 360
- Umbra
- Spire Global
- Satellogic
- Ball Aerospace
- Lockheed Martin
- Northrop Grumman
- Boeing Defense, Space & Security
- Raytheon Technologies
- L3Harris Technologies
Key Target Audience
- US Department of Defense procurement offices
- National security and intelligence agencies
- Federal civil agencies responsible for earth observation programs
- State and municipal emergency management authorities
- Commercial geospatial analytics buyers in energy and infrastructure
- Insurance and reinsurance firms
- Logistics and transportation network operators
- Investments and venture capital firms
Research Methodology
Step 1: Identification of Key Variables
Core variables included payload modality, orbit class, revisit cadence, ground segment capacity, regulatory readiness, and data integration maturity. Demand indicators were mapped to operational workflows across defense, civil agencies, and commercial users. Supply-side capabilities were aligned to mission lifecycle stages and compliance checkpoints.
Step 2: Market Analysis and Construction
Operational use cases were structured by application domain and mission architecture. Ecosystem mapping connected payload suppliers, launch interfaces, ground infrastructure, and analytics platforms. Adoption pathways were constructed around procurement cycles, licensing milestones, and data delivery workflows.
Step 3: Hypothesis Validation and Expert Consultation
Assumptions on adoption drivers and constraints were stress-tested through structured consultations with program managers, systems engineers, and procurement specialists. Operational bottlenecks, regulatory friction points, and workflow integration challenges were validated against current deployment practices.
Step 4: Research Synthesis and Final Output
Findings were synthesized into application-centric insights linking demand patterns to capability roadmaps. Scenario pathways were consolidated to reflect regulatory trajectories, technology refresh cycles, and institutional procurement dynamics, forming a coherent narrative for strategic planning.
- Executive Summary
- Research Methodology (Market Definitions and payload class segmentation for US remote sensing constellations, Analysis of FCC licensing and NOAA remote sensing permits, Primary interviews with US satellite operators and downstream analytics firms, Assessment of launch cadence and constellation replenishment cycles, Review of US defense and civil earth observation procurement programs, Geospatial data pricing and contract benchmarking)
- Definition and Scope
- Market evolution
- Mission and application pathways
- Ecosystem structure
- Supply chain and channel structure
- Regulatory environment

- Growth Drivers
Rising US defense and intelligence demand for persistent ISR
Expansion of commercial earth observation analytics adoption
Falling launch costs enabling frequent constellation refresh
Growth in climate monitoring and environmental compliance needs
Proliferation of smallsat platforms and standardized payloads
Increasing integration of EO data into AI-driven decision systems - Challenges
High capital intensity of constellation deployment and refresh
Regulatory constraints under NOAA remote sensing licensing
Spectrum coordination and interference risks
Data security and export control compliance burdens
Limited revisit rates for high-resolution optical in adverse weather
Dependence on launch availability and schedule reliability - Opportunities
Growth in SAR demand for all-weather imaging use cases
Commercial contracts with energy, insurance, and logistics sectors
Dual-use partnerships with US government agencies
On-orbit servicing and life-extension for EO satellites
Vertical integration into analytics and downstream platforms
International commercial sales within US regulatory frameworks - Trends
Shift toward large LEO constellations for high revisit rates
Rising adoption of hyperspectral imaging for resource intelligence
Increased use of hosted payloads on commercial platforms
Cloud-based EO data marketplaces and APIs
Integration of EO with IoT and digital twin platforms
Shorter satellite lifecycles with rapid technology refresh - Government Regulations
- SWOT Analysis
- Stakeholder and Ecosystem Analysis
- Porter’s Five Forces Analysis
- Competition Intensity and Ecosystem Mapping
- By Value, 2020–2025
- By Shipment Volume, 2020–2025
- By Active Systems, 2020–2025
- By Average Selling Price, 2020–2025
- By Orbit Type (in Value %)
LEO
MEO
GEO
Highly Elliptical Orbit - By Payload Type (in Value %)
Optical imaging
Synthetic aperture radar
Multispectral and hyperspectral
Thermal infrared - By Spatial Resolution (in Value %)
Very high resolution
High resolution
Medium resolution
Low resolution - By Application (in Value %)
Defense and intelligence
Environmental and climate monitoring
Agriculture and forestry
Urban planning and infrastructure
Energy and natural resources
Disaster management and emergency response - By End User (in Value %)
US Department of Defense and intelligence agencies
Federal civil agencies
State and local governments
Commercial enterprises
Research institutions and academia
- Market structure and competitive positioning
Market share snapshot of major players - Cross Comparison Parameters (payload resolution, revisit frequency, constellation size, data latency, pricing model, regulatory compliance, analytics integration, contract flexibility)
- SWOT Analysis of Key Players
- Pricing and Commercial Model Benchmarking
- Detailed Profiles of Major Companies
Maxar Technologies
Planet Labs
BlackSky
Capella Space
Iceye US
HawkEye 360
Umbra
Spire Global
Satellogic
Ball Aerospace
Lockheed Martin
Northrop Grumman
Boeing Defense, Space & Security
Raytheon Technologies
L3Harris Technologies
- Demand and utilization drivers
- Procurement and tender dynamics
- Buying criteria and vendor selection
- Budget allocation and financing preferences
- Implementation barriers and risk factors
- Post-purchase service expectations
- By Value, 2026–2035
- By Shipment Volume, 2026–2035
- By Active Systems, 2026–2035
- By Average Selling Price, 2026–2035


 Request a Sample
 Ask for Customization
 Get a Quote
 Enquire Now