
 Download PDF
 Download PDF
Market Overview
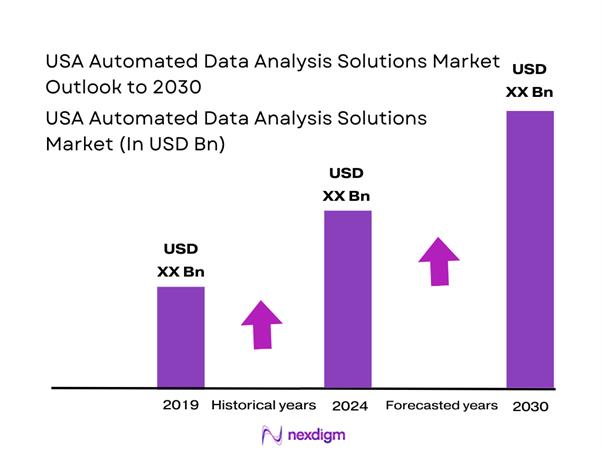
The USA automated data analysis solutions market is valued at USD ~ billion, supported by the U.S. business intelligence software market sizing published by ~. A comparable, widely-cited global benchmark shows business intelligence software at USD ~ billion in the prior reported year, reflecting how strongly the U.S. sits inside the broader BI and automated analytics value pool. Demand is being pulled by automated insight generation (anomaly detection, auto narratives), cloud BI standardization, and AI/ML-assisted analysis that reduces analyst time and accelerates decision cycles.
Dominance concentrates in major U.S. tech and finance hubs because they combine dense enterprise buyer bases, deep cloud/data infrastructure, and large data talent pools. The Northeast remains a leading consumption region due to the concentration of Fortune ~ headquarters and financial institutions, while the West accelerates fastest because platform engineering, cloud-native adoption, and product-led analytics innovation are heavily anchored there. At the vendor and ecosystem level, the U.S. benefits from hyperscalers, data cloud/lakehouse platforms, and high levels of AI and cloud investment intensity that keeps modern analytics procurement active.
Market Segmentation
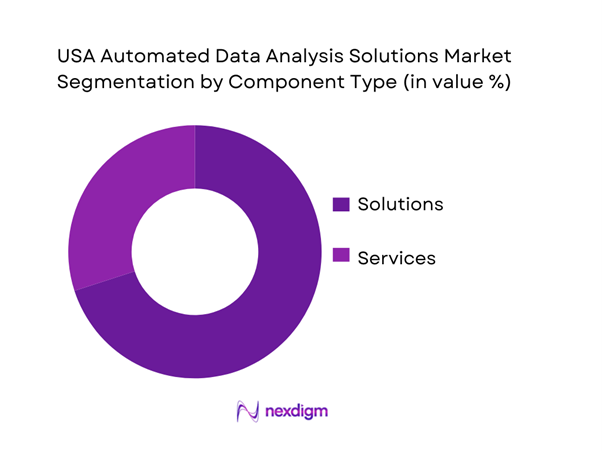
By Component Type
The USA automated data analysis solutions market is segmented by component type into solutions and services. Solutions dominate because buyers prioritize platforms that directly automate reporting, insight discovery, and narrative explanations, while also standardizing KPI logic and enabling governed self-service. In large enterprises, automation value is realized fastest when packaged as repeatable product features—auto dashboards, anomaly alerts, natural-language Q&A, and predictive widgets—rather than labor-heavy bespoke work. Services remain essential, but they are typically attached to deployments for data modeling, governance design, enablement, and ongoing optimization. This pushes spend concentration toward solutions platforms first, with services expanding as organizations scale to more departments and harden controls.
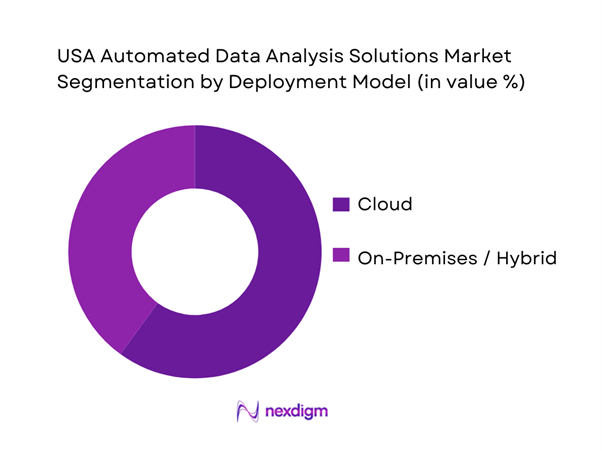
By Deployment Model
The market is segmented by deployment model into cloud and on-premises/hybrid. Cloud dominates because automated analytics features increasingly depend on elastic compute, frequent model refresh, and integration with cloud-native data stores (lakehouses, warehouses, and SaaS operational systems). Cloud deployment also reduces procurement friction by shifting costs to subscriptions and consumption-based scaling, allowing faster pilots and quicker enterprise rollouts. For many organizations, cloud BI becomes the control plane that unifies dashboards, semantic models, and governance policies while enabling remote and cross-functional access. On-premises and hybrid remains relevant where regulated data, legacy constraints, or procurement policies require tighter control—yet even these buyers increasingly adopt hybrid patterns with cloud analytics layers and controlled data movement.
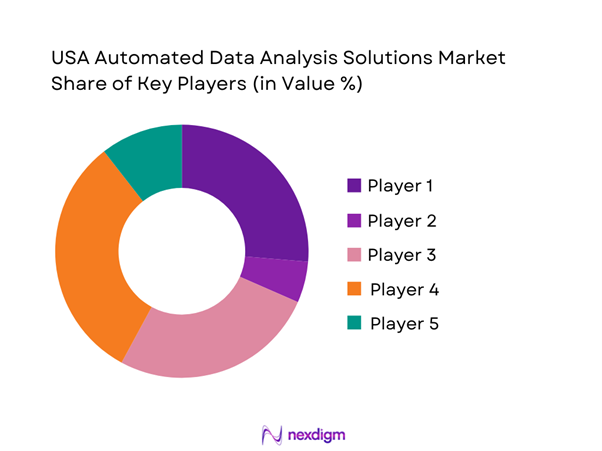
Competitive Landscape
The USA automated data analysis solutions market is competitive and relatively fragmented, with consolidation pressure coming from suite vendors and hyperscalers bundling analytics into broader data and cloud contracts. At the same time, best-of-breed vendors remain strong where automation depth, data preparation, or industry-specific workflows matter. The market is characterized as fragmented and highlights continuous innovation and new competitor entry, which keeps differentiation centered on automation reliability, governance, and integration breadth.
| Company | Est. Year | HQ | Primary Automation Strength | Typical Buyer Motion | Data Stack Fit | Governance & Controls | Deployment Focus | Differentiation Signal |
| Microsoft (Power BI / Fabric) | 1975 | Redmond, WA | ~ | ~ | ~ | ~ | ~ | ~ |
| Salesforce (Tableau) | 2003 | Seattle, WA | ~ | ~ | ~ | ~ | ~ | ~ |
| Qlik | 1993 | U.S. | ~ | ~ | ~ | ~ | ~ | ~ |
| SAS | 1976 | Cary, NC | ~ | ~ | ~ | ~ | ~ | ~ |
| Alteryx | 1997 | Irvine, CA | ~ | ~ | ~ | ~ | ~ | ~ |
USA Automated Data Analysis Solutions Market Dynamics and Performance Analysis
Growth Drivers
Time-to-Insight Compression
US enterprises are operating in a high-velocity economic environment where decision latency directly impacts productivity. According to the U.S. Bureau of Economic Analysis, the U.S. produced USD ~ trillion in GDP, with services contributing more than USD ~ trillion, creating extremely data-dense operational environments. Simultaneously, the World Bank reports that the U.S. generated over ~ zettabytes of data traffic annually through fixed broadband and mobile networks combined, reflecting continuous data inflow into enterprises. This scale of data overwhelms manual analytics, forcing adoption of automated analysis solutions that compress insight cycles from days to minutes by automating data preparation, anomaly detection, and narrative generation across business functions.
Self-Service Analytics at Enterprise Scale
Enterprise-scale self-service analytics adoption is driven by workforce structure and digital skill distribution in the U.S. The U.S. Bureau of Labor Statistics reports ~ million employed persons, while only ~ million are classified under data science, analytics, and mathematical occupations. This imbalance forces enterprises to democratize analytics beyond specialists. Additionally, the World Bank confirms ~ internet users per ~ people in the U.S., enabling widespread internal access to cloud analytics platforms. Automated data analysis solutions allow non-technical staff across finance, operations, and sales to generate insights without relying on centralized data teams, making automation essential to scale analytics usage across large enterprises.
Challenges
Data Quality and Observability Gaps
Data quality remains a structural challenge due to enterprise data fragmentation. The U.S. Census Bureau reports over ~ million employer establishments, many operating across disconnected IT systems. Meanwhile, the World Bank confirms that U.S. firms utilize more than ~ distinct data systems on average for operations and reporting. Poor lineage visibility, inconsistent data definitions, and missing observability metrics reduce the effectiveness of automated analytics, as automation amplifies upstream data errors. Without strong macro-level data governance maturity, automated analysis solutions face trust barriers, limiting full enterprise adoption despite strong demand drivers.
AI Hallucination and Explainability Risks
AI explainability concerns are intensified by regulatory scrutiny. The Federal Trade Commission recorded over ~ million AI-related consumer complaints tied to automated decisioning and digital services. Simultaneously, the U.S. Department of Justice reports increasing litigation linked to opaque algorithmic outcomes in financial and employment decisions. The IMF highlights that over ~% of U.S. jobs are exposed to AI-assisted decision processes, increasing accountability risks. These macro indicators force enterprises to scrutinize automated analytics outputs, slowing deployment when explanation, traceability, and auditability are insufficient.
Opportunities
Agentic Analytics and Autonomous Insights
Agentic analytics adoption is supported by national AI infrastructure readiness. The National Science Foundation confirms over ~ national AI research institutes, while the World Bank reports U.S. cloud computing penetration exceeding ~% among large enterprises. These conditions allow analytics platforms to deploy autonomous agents capable of continuous monitoring, hypothesis testing, and proactive alerts. Enterprises are increasingly comfortable delegating recurring analytical tasks to AI agents, freeing human analysts for strategic work. Current infrastructure maturity enables rapid scaling of autonomous analytics without waiting for new macro investments.
Domain-Specific Analytics Applications
Verticalized analytics opportunities are driven by sector complexity. The U.S. Department of Health and Human Services reports over ~ million hospital admissions annually, while the U.S. Department of Transportation tracks over ~ billion freight movements. Each sector generates unique data structures requiring specialized automation logic. The World Bank confirms sustained digitization across healthcare, logistics, and finance, enabling analytics platforms to build domain-specific models and workflows. These conditions favor growth of tailored automated analytics solutions that embed regulatory logic, KPIs, and operational context directly into platforms.
Future Outlook
Over the next five years, the USA automated data analysis solutions market is expected to expand as organizations operationalize GenAI inside analytics workflows and push automation closer to daily decisions. The biggest growth pull is the shift from “dashboard consumption” to “decision automation,” where platforms detect anomalies, explain drivers, and recommend actions within business applications. Cloud migration, lakehouse convergence, and stronger governance patterns will reduce friction for scaling automation enterprise-wide. At the same time, buyers will tighten trust requirements—audit trails, model governance, and privacy controls—driving demand for platforms that balance automation with explainability and policy enforcement.
Major Players
- Microsoft
- Salesforce
- Amazon Web Services
- IBM
- Oracle
- SAP
- Snowflake
- Databricks
- Palantir
- SAS
- Qlik
- Alteryx
- MicroStrategy
Key Target Audience
- Enterprise CIO / IT Strategy Leadership
- Chief Data & Analytics Officers / Data Platform Owners
- Finance & FP&A Leadership
- Risk, Fraud & Compliance Leaders in BFSI
- Healthcare Provider Network and Revenue Cycle Leadership
- Retail & eCommerce Growth and RevOps Leadership
- Investments and Venture Capitalist Firms
- Government and Regulatory Bodies
Research Methodology
Step 1: Identification of Key Variables
We build an ecosystem map across platform vendors, hyperscalers, data cloud/lakehouse layers, SIs, and buyer industries. Desk research consolidates definitions and boundaries for “automated analysis” (NLQ, auto-insights, anomaly detection, auto-narratives). We finalize sizing variables such as paid platform revenue, deployment mix, and buyer adoption drivers.
Step 2: Market Analysis and Construction
We construct the market using a bottom-up model across solution platforms and services attachments, then triangulate with published market benchmarks. We normalize revenue recognition to reduce double-counting across bundled analytics suites. Segment splits are anchored to observed U.S. BI market segmentation signals (component and deployment) and validated with buyer procurement patterns.
Step 3: Hypothesis Validation and Expert Consultation
We run CATI-style interviews with platform leaders, SIs, security stakeholders, and enterprise analytics owners. Hypotheses tested include cloud acceleration drivers, governance barriers, and adoption thresholds for AI copilots. We apply confidence scoring by segment and reconcile variances through follow-up expert checks.
Step 4: Research Synthesis and Final Output
We synthesize findings into an executive decision framework: where automation creates measurable cycle-time reduction, where governance constraints reshape architectures, and which industries are scaling fastest. Final outputs are stress-tested with scenario analysis on cloud adoption, compliance tightening, and platform consolidation effects.
- Executive Summary
- Research Methodology (Market Definitions and Assumptions, Abbreviations, Inclusion and Exclusion Criteria, Solution Taxonomy, Data Triangulation Framework, Bottom-Up Adoption Modeling, Top-Down Spend Benchmarking, Primary Interviews Mix, Buyer Surveys and Voice-of-Customer Inputs, Validation Workshops, Limitations and Sensitivity Checks)
- Definition and Scope
- Market Genesis and Evolution
- Category Map
- Market Stakeholder Landscape
- US Demand Context

- Growth Drivers
Time-to-insight compression
Self-service analytics at enterprise scale
GenAI assistant adoption across business functions
Real-time and operational decisioning demand
Analytics embedded in frontline workflows - Challenges
Data quality and observability gaps
AI hallucination and explainability risks
Access control and data security concerns
Legacy semantic and metric inconsistencies
Analytics tool sprawl and adoption friction - Opportunities
Agentic analytics and autonomous insights
Domain-specific analytics applications
Automated governance and policy-as-code
Embedded analytics within SaaS platforms
Verticalized AI copilots - Trends
Standardization of semantic layers and metrics stores
Integration of vector search with BI platforms
RAG-based enterprise analytics
Auto-documentation and data productization - Regulatory & Policy Landscape
- SWOT Analysis
- Stakeholder & Ecosystem Analysis
- Porter’s Five Forces Analysis
- Competitive Intensity & Ecosystem Mapping
- By Value, 2019–2024
- By Deployment Spend, 2019–2024
- By Buyer Spend Pools, 2019–2024
- By Technology Architecture (in Value %)
Augmented Business Intelligence Platforms
Automated Data Preparation and Wrangling Tools
AutoML and Data Science Automation Platforms
GenAI-Powered Analytics Assistants
Embedded and Composable Analytics Platforms - By Application (in Value %)
Financial Performance Analytics
Sales and Revenue Analytics
Marketing and Attribution Analytics
Supply Chain and Operations Analytics
Risk, Compliance, and Governance Analytics - By Connectivity Type (in Value %)
Cloud-Native SaaS Deployment
Hybrid Cloud Deployment
On-Premise Deployment
Federated and Virtualized Data Access - By End-Use Industry (in Value %)
Banking and Financial Services
Healthcare and Life Sciences
Retail and eCommerce
Manufacturing and Industrial
Telecom and Media - By Region (in Value %)
Northeast
Midwest
South
West
- Market Positioning and Presence Assessment
- Cross Comparison Parameters (GenAI and NLQ maturity, Automation coverage depth, Semantic layer and metrics governance, Connector and data platform interoperability, Security and compliance posture, Scalability and cost control mechanisms, Embedded analytics readiness, Implementation speed and adoption instrumentation)
- SWOT Analysis of Major Players
- Partnership Ecosystem
- Pricing and Commercial Model Review
- Detailed Profiles of Major Companies
Amazon Web Services
Domo
Google
IBM
Microsoft
MicroStrategy
Oracle Analytics Cloud
Qlik
Salesforce
SAP Analytics Cloud
SAS Viya
Sisense
ThoughtSpot
TIBCO Spotfire
Yellowfin
- Buyer Personas and Decision Units
- Budget Flows and Approval Pathways
- Vendor Evaluation Criteria
- Adoption and Change Management
- Value Realization Framework
- By Value, 2025–2030
- By Deployment Spend, 2025–2030
- By Buyer Spend Pools, 2025–2030


 Request a Sample
 Ask for Customization
 Get a Quote
 Enquire Now