
 Download PDF
 Download PDF
Market Overview
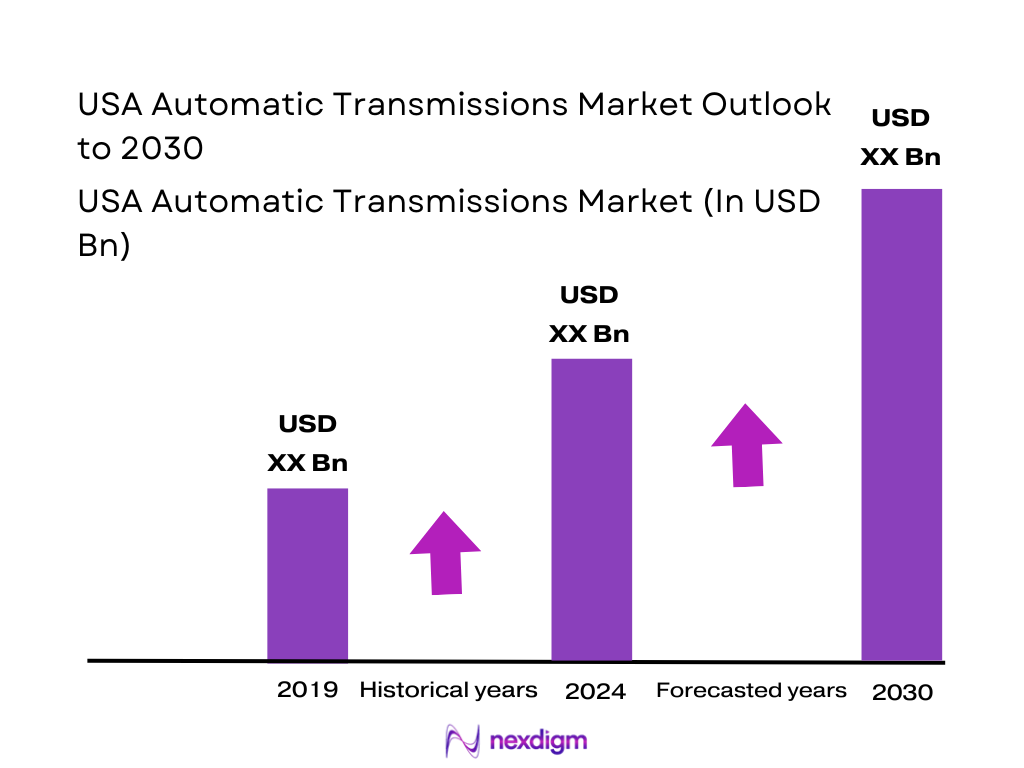
The USA Automatic Transmissions Market is embedded within the broader automotive transmission sector, which reflects increasing consumer preference for comfort-oriented vehicles. Based on a combination of regional estimates from global transmission reports, North America — and specifically the United States — is one of the largest adopters of automatic transmissions. North America accounts for a significant market portion of the global automotive transmission industry, which is valued at USD ~ billion in 2024 and projected to grow to USD ~ billion by 2030 at a 5.6% CAGR, indicating robust demand for automatic systems in high-technology vehicles and stricter emissions compliance that automatic variants support. Automatic transmissions continue to be driven by consumer demand for convenience, safety, and smoother driving characteristics which align with increasing SUV/EV/HEV sales in the U.S., as reported in broader powertrain market analyses.
The U.S. automatic transmission market gravitating around major auto manufacturing hubs such as Detroit (MI), San Antonio (TX), Nashville (TN), and plants in Ohio, Indiana, and Kentucky dominates due to proximity to OEMs like GM, Ford, Stellantis, Toyota, and Hyundai. These regions benefit from deep supplier ecosystems, skilled workforce, and technological clusters specializing in transmission hardware and mechatronics. Proximity to high vehicle production and engineering centers enhances collaboration across OEMs and first-tier suppliers, reducing logistics cost and supporting faster program launches.
Market Segmentation
By Transmission Type
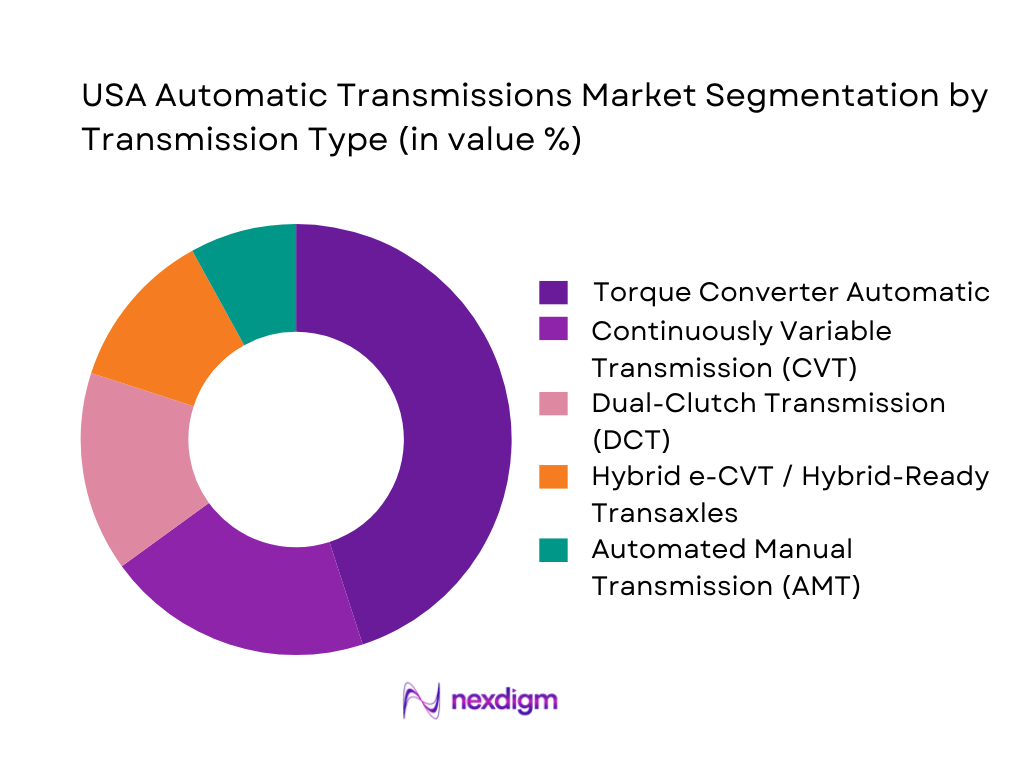
USA Automatic Transmissions Market is segmented by type into torque converter automatic, CVT, DCT, hybrid e-CVT/transaxles, and AMT. Torque converter automatics dominate due to long-standing adoption in U.S. passenger cars, SUVs, and light trucks where smooth shift feel, durability, and familiarity remain key buyer priorities. OEMs such as Ford and GM integrate advanced torque converters paired with 8-10+ speed gear trains to balance fuel economy with performance, especially in heavier vehicle segments like pickups and SUVs. CVTs are increasingly preferred in smaller cars and hybrids for fuel economy benefits, while DCTs are used in performance-oriented vehicles; however, both remain less pervasive than torque converter systems due to legacy fleet preference and heavier truck/SUV market structure.
By Vehicle Class
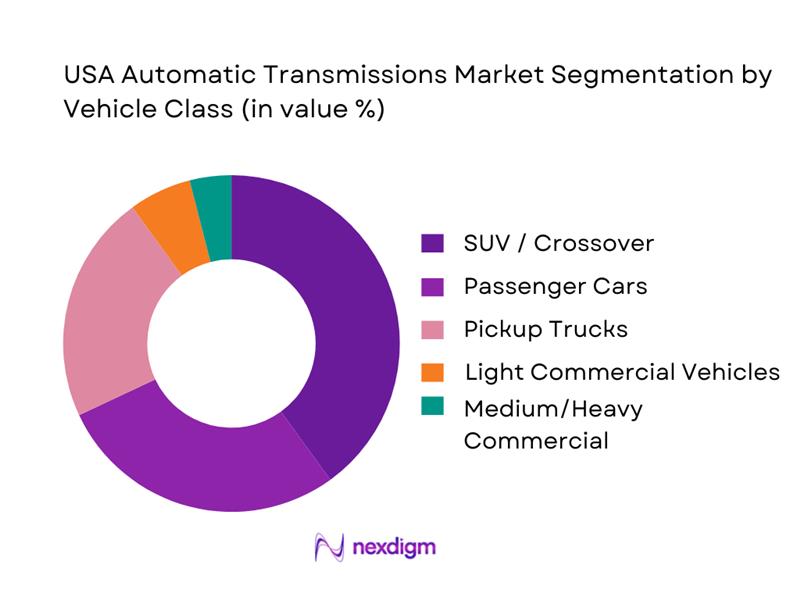
Under the vehicle class segmentation, SUV/Crossover vehicles hold the largest share — driven by the continued strong U.S. appetite for larger vehicles with automatic transmissions as standard offerings. SUVs often couple powerful engines with multi-speed automatics to handle higher torque, higher towing demands, and better on-road comfort, aligning with consumer preference for capability and ease of driving. Passenger cars follow due to volume sales but increasingly shift toward CVTs and hybrid e-CVTs for economy. Pickup trucks contribute noticeably because automatics are effectively the default choice for towing performance and driver convenience, especially with advanced 10+ speed units.
Competitive Landscape
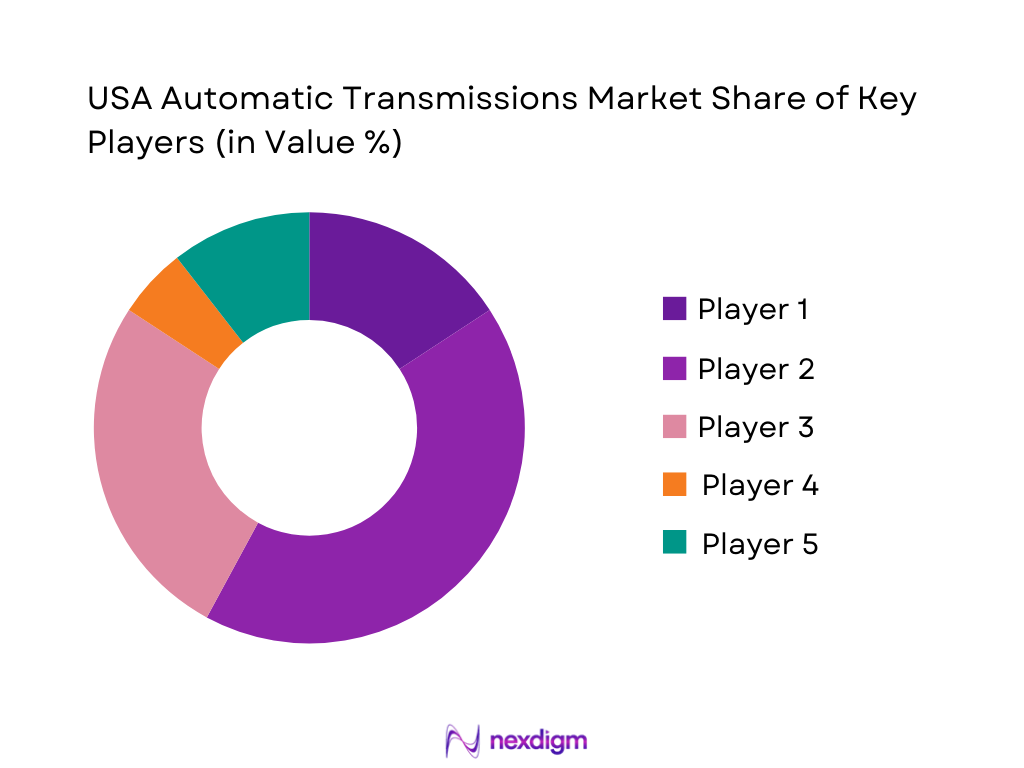
The competitive landscape of the USA Automatic Transmissions Market reflects strong positions of global Tier-1s and OEM in-house capabilities. Major players lead through technology differentiation, program awards with U.S. automakers, and localized manufacturing footprints. The market is consolidated around a mix of specialized global suppliers and OEM captive operations that provide automatic transmission systems, modules, and controls for North American vehicle platforms. These companies compete on technology robustness, local supply footprints, integration with electronic controls, and aftermarket support — factors critical in the U.S. auto ecosystem that emphasizes fuel efficiency, emissions performance, and drive quality.
| Company | Establishment Year | Headquarters | Transmission Type Focus | U.S. Ops Footprint | OEM Contracts | Aftermarket/Reman Presence |
| ZF Friedrichshafen | 1915 | Germany | ~ | ~ | ~ | ~ |
| Aisin | 1949 | Japan | ~ | ~ | ~ | ~ |
| Allison Transmission | 1915 | USA | ~ | ~ | ~ | ~ |
| BorgWarner | 1928 | USA | ~ | ~ | ~ | ~ |
| Magna Powertrain | 1957 | Canada | ~ | ~ | ~ | ~ |
USA Automatic Transmissions Market Analysis
Growth Drivers
Fuel-efficiency regulation pull
U.S. powertrain roadmaps keep pushing automatic-transmission efficiency because compliance is enforced at the vehicle level but often delivered through drivetrain optimization (gear spread, torque-converter control, shift scheduling, lock-up strategy, and reduced parasitic losses). In the U.S., macro headroom for capex and platform refresh is supported by the country’s GDP of USD ~ trillion and GDP per capita of USD ~, which sustain high vehicle affordability and ongoing model change cycles. On the demand side, the U.S. continues to run extremely high utilization: FHWA’s Traffic Volume Trends reports ~ million vehicle-miles of travel for the year-to-date total and ~ million miles in December alone—usage levels that amplify OEM focus on real-world fuel economy and emissions robustness via transmission calibration. The mix of new-vehicle volume also matters for regulation-driven technology diffusion: BTS shows ~ new vehicle sales/leases in the latest year, creating a large base where even “per-model” transmission improvements compound into major compliance leverage across fleets.
Multi-speed adoption
Multi-speed automatics remain structurally favored in the U.S. because the national operating profile combines long-distance highway mileage with urban congestion—conditions where tighter ratio steps help keep engines in efficient operating zones while maintaining drivability. The U.S. economic scale underpins continued OEM and Tier-1 investment in control software, mechatronics validation, and high-throughput machining capacity needed for modern planetary gearsets, clutch packs, and valve bodies. Utilization intensity reinforces the case: FHWA reports year-to-date travel of ~ million vehicle-miles, which raises lifetime duty-cycle exposure and increases the payoff of optimized shift logic that multi-speed architectures enable. The U.S. new-vehicle market is also large enough to sustain multiple transmission families in parallel, with BTS reporting ~ new vehicle sales/leases, including ~ light trucks—where multi-speed automatics are especially central to towing, gradeability, and NVH targets.
Challenges
Platform consolidation
OEM platform consolidation reduces the number of unique transmission “slots” but raises the engineering burden per slot: a single automatic-transmission family must cover broader torque bands, multiple drive layouts, and varied emissions/driveability calibrations—tightening supplier selection and amplifying consequences of design flaws. The U.S. still delivers very high annual new-vehicle volume—~ new sales/leases—so consolidation decisions scale quickly across large build counts and long program lives. Macroeconomic scale sustains a highly competitive OEM landscape where fewer platforms must serve more trims and derivatives, which increases validation matrices and line-change risk. The operational environment is demanding: ~ million vehicle-miles traveled in the year-to-date total creates a harsh real-world exposure base, so any consolidated design has to be robust across temperature, grade, towing, and congestion patterns without quality spillover across millions of vehicles.
High validation cost
Transmission validation is “high-cost” operationally because regulatory and warranty frameworks force long-horizon durability proof across multiple subsystems. Without citing costs, the scale of mandated durability windows can be shown in hard numbers: federal emissions-related warranty structures commonly reference 2 years/~ miles for many emissions-related parts and 8 years/~ miles for specified major emissions components—durability horizons that indirectly pressure transmission calibrations to maintain emissions performance over long service life. Combine this with U.S. driving intensity— ~ miles traveled year-to-date—creating wide real-world variance that must be covered by test plans. Macro capacity exists, but that same scale produces more variants and faster refresh pressure, which expands validation matrices rather than shrinking them.
Opportunities
Hybrid-ready transmissions
Hybrid-ready automatic transmissions and transaxles represent a near-term growth pathway because current U.S. electrified volumes are already large enough to force architectural choices—yet many OEM fleets still require familiar packaging and manufacturing scalability. BTS shows ~ hybrid-electric vehicle sales and ~ plug-in hybrid sales in the latest year, indicating a sizeable base for hybrid-compatible geartrains, integrated e-motor modules, upgraded wet-clutch packs, and advanced thermal strategies—all while leveraging existing automatic-transmission manufacturing ecosystems. The U.S. market’s light-truck dominance strengthens this opportunity: ~ new light-truck sales/leases create demand for hybrid solutions that can deliver towing-capable torque management and refined drivability—areas where hybrid-ready automatics can outperform simpler single-speed e-drives in certain duty cycles. With national utilization at ~ million vehicle-miles traveled year-to-date, hybrid systems that improve real-world efficiency while maintaining durability can scale quickly into meaningful fleet outcomes—without needing future projections to justify the engineering and industrial focus.
Modular AWD-compatible units
Modular, AWD-compatible automatic transmissions are positioned to benefit from the U.S. preference for capability-focused vehicles—where AWD/4WD packaging, torque management, and drivability are purchase-critical. BTS confirms the U.S. volume center is light trucks: ~ light-truck new sales/leases versus ~ passenger cars, making modular AWD-capable transmission families strategically valuable because they can serve multiple high-volume nameplates with shared core components and localized adaptations. The installed base and use intensity reinforce aftermarket/service pull: ~ total truck registrations support long-life servicing ecosystems where modularity can reduce repair complexity and improve parts commonality. Add the reality of ~ miles of annual road travel, and AWD-compatible modular units become a practical opportunity for suppliers to differentiate on durability, thermal stability, and shift quality under diverse U.S. operating conditions—without relying on any forward-looking statistics.
Future Outlook
The future outlook for the USA Automatic Transmissions Market is marked by continued growth albeit with evolving structural forces. Demand remains strong as transportation preferences continue moving towards comfort, efficiency, and electrification integration. OEMs are increasingly pairing automatic systems with hybrid and electrified powertrains to meet regulatory efficiency obligations and deliver seamless driver experience across segments — especially SUVs, pickups, and electrified models. The aftermarket and reman sectors will grow parallelly as vehicle parc ages and service cycles expand. Additionally, automation in vehicles and advanced shift logic will push software and control systems to the forefront of differentiation in the automatic transmissions landscape.
Major Players
- ZF Friedrichshafen
- Aisin Corporation
- Allison Transmission
- BorgWarner
- Magna Powertrain
- Hyundai Transys
- JATCO
- Eaton
- Ford Transmission Operations
- GM Powertrain Transmissions
- Stellantis Powertrain
- Toyota Powertrain
- Honda Powertrain
- Nissan
Key Target Audience
- Automotive OEMs
- Tier-1 Transmission System Suppliers
- Aftermarket Distributors & Remanufacturers
- Parts & Component Manufacturers
- Investments and Venture Capitalist Firms
- Fleet Operators & Logistics Companies
- Government and Regulatory Bodies
- Automotive Electronics & Software Providers
Research Methodology
Step 1: Market Scoping & Variable Identification
Define the automation transmission domain in the USA by mapping all stakeholders — OEMs, Tier-1 suppliers, remanufacturers, aftermarket channels. Desk research, industry publications, and syndicated reports identify key performance, technology, and adoption variables influencing the market.
Step 2: Data Collection & Segmentation Modelling
Collect historical market size data, vehicle parc data, and adoption trends from reliable sources. Segment based on transmission type, vehicle class, and application. Cross-reference with OEM production statistics and supplier award news for accuracy.
Step 3: Expert Validation & Industry Consultation
Validate preliminary findings through structured interviews with automotive engineers, procurement heads, and supply chain experts in the U.S. These insights ensure reliability in adoption drivers, forecast drivers, and challenges.
Step 4: Forecast Construction & Synthesis
Build future forecasts using bottom-up (production & take-rate) and top-down (market drivers like electrification & fuel economy standards) approaches. Triangulate results with industry benchmarks and comparative regional trends to finalize market outlook.
- Executive Summary
- Research Methodology (Market Definition & Boundary Conditions, Transmission Taxonomy & Inclusion/Exclusion, Data Sources & Validation Ladder, Primary Interview Mix Across OEM–Tier1–Reman–Repair, Plant/Capacity & Platform Mapping, Bottom-Up Build-Rates & Top-Down Vehicle Parc Reconciliation, Pricing/ASP & Content-per-Vehicle Framework, Assumptions, Sensitivity Checks, Limitations)
- Definition, Scope and Classification
- Technology Evolution: Torque-Converter AT vs CVT vs DCT vs Hybrid Transaxles
- Platform Strategy Context: FWD Transaxle vs RWD Longitudinal vs AWD Modules
- Business Cycle: Launch–Ramp–Maturity–Refresh–Service Tail
- USA Supply Chain, Value Chain & Localization Map

- Growth Drivers
Fuel-efficiency regulation pull
Multi-speed adoption
Truck/SUV mix
Hybridization pathways
Fleet uptime requirements - Challenges
Platform consolidation
High validation cost
Mechatronics sourcing risk
Quality escapes/recalls
Margin pressure vs OEM cost-down - Opportunities
Hybrid-ready transmissions
Modular AWD-compatible units
Reman value pools
Software-enabled shift quality differentiation
Domestic capacity localization - Trends
10-speed class evolution
Hybrid transaxle scaling
Integrated e-drive modules at the boundary of “automatic transmission”
Digital diagnostics, predictive maintenance - Regulation & Standards Landscape
- Porter’s Five Forces
- Stakeholder Ecosystem
- By Value, 2019-2024
- By Volume (Units), 2019-2024
- Installed Base / Vehicle Parc Equipped with Automatic Transmissions, 2019-2024
- OEM-Fitment vs Service Replacement Mix, 2019-2024
- Average Realization per Unit & Content-per-Vehicle, 2019-2024
- By Transmission Type (in Value %)
Torque-converter AT
CVT
DCT
Hybrid transaxle/eCVT
Automated manual for commercial
- By Vehicle Class (in Value %)
Passenger cars
CUV/SUV
Pickup
LCV/van
M&H commercial
- By Drive Layout (in Value %)
FWD transaxle
RWD longitudinal
AWD/4WD module-compatible
- By Propulsion / Powertrain Pairing (in Value %)
ICE
HEV
PHEV
Range-extender architectures where applicable
- By Sales Channel (in Value %)
OEM factory-fit
OES service
IAM replacement
Remanufactured units
Performance/upgraded builds
- By Region (in Value %)
Key auto-manufacturing corridors
Logistics and plant proximity dynamics)
- Market Share Snapshot
- Cross Comparison Parameters (Platform Coverage & Torque-Capacity Bands, USMCA Footprint & Localization Depth, Architecture & Feature Stack, Electronics/Mechatronics Ownership, Efficiency & Compliance Enablement, Quality System & Field Performance, Commercial Terms & Program Flexibility, Aftersales / Reman Ecosystem Strength)
- SWOT of Major Players
- Pricing & Cost Stack Benchmarking
- Strategic Moves Tracker
- Detailed Profiles of Major Companies
ZF Friedrichshafen
Aisin
JATCO
Allison Transmission
BorgWarner
Magna Powertrain
Hyundai Transys
General Motors
Ford
Stellantis
Toyota
Honda
Nissan
Tremec
- OEM Purchasing & Program Award Process
- Aftermarket Demand & Installer Decision Tree
- Fleet & Commercial Requirements
- Pain Points & Unmet Needs
- By Value, 2025-2030
- By Volume, 2025-2030
- Installed Base / Vehicle Parc Equipped with Automatic Transmissions, 2025-2030
- OEM-Fitment vs Service Replacement Mix, 2025-2030
- Average Realization per Unit & Content-per-Vehicle, 2025-2030


 Request a Sample
 Ask for Customization
 Get a Quote
 Enquire Now