
 Download PDF
Market Overview
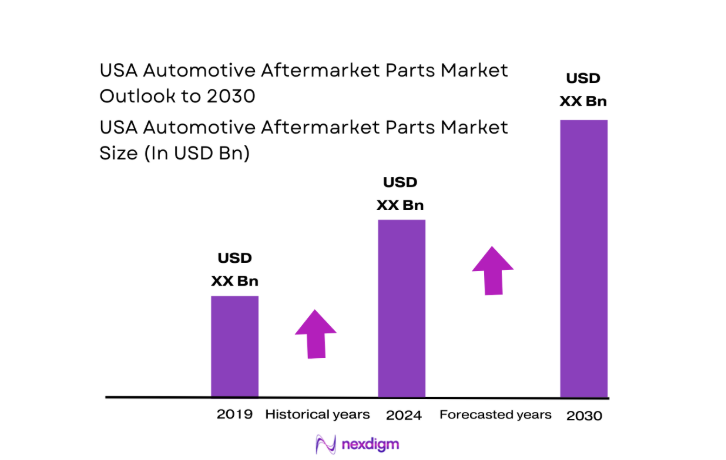
The USA Automotive Aftermarket Parts Market current size stands at around USD ~ million, reflecting steady replacement demand across aging vehicle fleets, rising repair intensity for complex systems, and expanding omnichannel availability of components. The market spans mechanical, electrical, body, and consumables categories, supported by installer networks and retail distribution. Procurement patterns are shaped by service turnaround expectations, parts availability, and warranty considerations, while product standards and certification norms influence sourcing strategies across professional and DIY segments nationwide.
Demand concentration is strongest across high-density metro corridors with extensive commuter traffic and logistics activity, including Southern California, the Texas Triangle, the Northeast corridor, and the Great Lakes region. Mature distributor footprints, dense installer ecosystems, and advanced warehousing infrastructure reinforce regional hubs. Policy environments emphasizing emissions compliance and safety inspections shape replacement cycles. Port access and interstate connectivity strengthen inventory velocity, while regional climate variability influences wear patterns for brakes, suspension, batteries, and thermal management components.
Market Segmentation
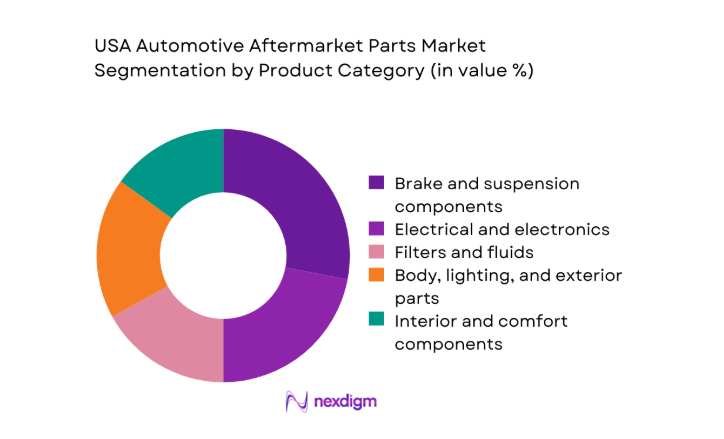
By Product Category
Brake and suspension systems dominate due to frequent replacement cycles driven by urban stop-start driving, heavier curb weights of light trucks and SUVs, and deteriorating road surfaces across freight corridors. Electrical and electronics follow as vehicles integrate advanced driver assistance features, sensors, and power management modules, increasing failure points and diagnostic complexity. Filters and fluids maintain steady turnover from routine maintenance, while body and lighting parts benefit from collision repair volumes in dense metro areas. Interior comfort components grow with rideshare utilization that accelerates wear on seating, HVAC actuators, and infotainment interfaces, reinforcing demand through professional installer channels.
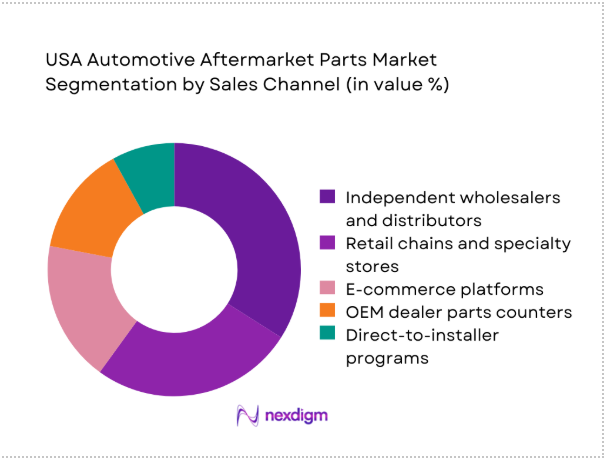
By Sales Channel
Independent wholesalers and distributors lead due to breadth of SKU availability, rapid fulfillment to installers, and localized inventory positioning near service clusters. Retail chains and specialty stores remain influential for fast-moving maintenance items and emergency replacements, supported by extended operating hours. E-commerce platforms expand reach through VIN-based fitment tools and same-day delivery partnerships in urban areas. OEM dealer parts counters retain relevance for late-model vehicles and warranty-linked repairs. Direct-to-installer programs gain traction via pricing incentives, technical support, and streamlined returns, improving loyalty among high-throughput service bays.
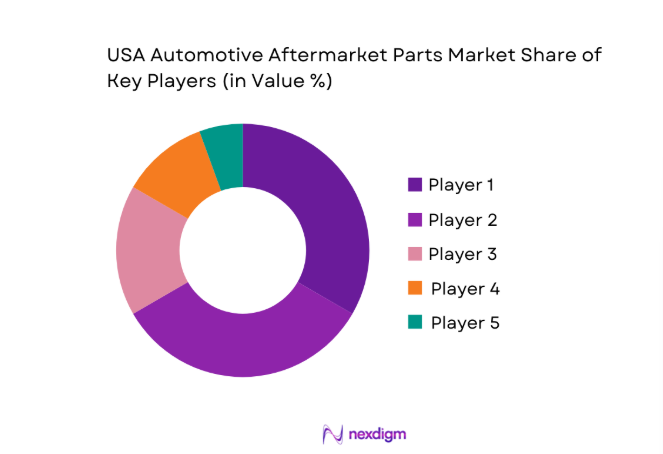
Competitive Landscape
The competitive environment is characterized by broad assortments, rapid fulfillment capabilities, and deep relationships with installer networks. Differentiation centers on inventory depth, private label penetration, logistics speed, digital fitment accuracy, and service programs that reduce bay downtime. Regulatory readiness and recall management capabilities influence professional channel trust.
| Company Name | Establishment Year | Headquarters | Formulation Depth | Distribution Reach | Regulatory Readiness | Service Capability | Channel Strength | Pricing Flexibility |
| AutoZone | 1979 | Memphis, TN | ~ | ~ | ~ | ~ | ~ | ~ |
| Advance Auto Parts | 1932 | Raleigh, NC | ~ | ~ | ~ | ~ | ~ | ~ |
| O’Reilly Auto Parts | 1957 | Springfield, MO | ~ | ~ | ~ | ~ | ~ | ~ |
| Genuine Parts Company (NAPA) | 1928 | Atlanta, GA | ~ | ~ | ~ | ~ | ~ | ~ |
| LKQ Corporation | 1998 | Chicago, IL | ~ | ~ | ~ | ~ | ~ | ~ |
USA Automotive Aftermarket Parts Market Analysis
Growth Drivers
Rising average vehicle age and deferred new vehicle purchases
Vehicle parc aging accelerated as registrations of vehicles older than 10 years reached 86 in 2023 across multiple states, with inspection backlogs of 14 days in dense metros extending maintenance cycles. Household transport costs increased 6 in 2024, shifting owners toward repair over replacement. State safety inspection volumes exceeded 31 in 2023 for high-traffic corridors, lifting routine parts replacement frequency. Commercial delivery fleets logged 58 million additional route miles in 2024, intensifying brake, tire, and suspension wear. Higher utilization of light trucks increased axle loads by 320 kilograms, raising component fatigue rates.
Growth in miles driven post-pandemic and regional commuting patterns
Vehicle miles traveled rose 34 billion in 2023 and added 21 billion in 2024 across major interstates, driven by resumed commuting and logistics expansion. Urban congestion indices increased 9 points in 2023, elevating stop-start cycles that accelerate brake pad and rotor wear. Highway freight tonnage expanded 4 in 2024, increasing axle stress events per vehicle. Tourism-linked corridor traffic added 12 million trips in 2023, raising demand for roadside repairs. State DOT maintenance reports recorded 18 percent growth in pothole incidents, increasing suspension and alignment service frequency across metro service bays.
Challenges
Price competition and margin compression among distributors
Warehouse labor turnover reached 42 in 2023, increasing fulfillment costs and pressuring distributor margins amid aggressive price matching across channels. Same-day delivery coverage expanded to 176 metro zones in 2024, raising last-mile expense per order. Inventory carrying days increased from 47 in 2022 to 61 in 2024 due to SKU proliferation tied to vehicle complexity. Credit terms shortened from 45 to 30 days for many installers, tightening distributor cash cycles. Freight rate volatility showed swings of 23 in 2023, complicating replenishment economics and contract pricing stability for fast-moving parts.
Counterfeit and substandard parts in online marketplaces
Customs seizures of non-compliant automotive components reached 2,400 cases in 2023, up from 1,700 in 2022, reflecting growing online cross-border flows. Product authentication claims rose 29 in 2024 among professional installers reporting premature failures. Warranty claim processing time increased 11 days on average due to verification steps. Online marketplace seller counts expanded 38 in 2023, diluting quality oversight. State enforcement actions recorded 64 penalties in 2024 tied to labeling and safety non-compliance, eroding installer trust and increasing verification costs for legitimate distributors.
Opportunities
Private label expansion by retailers and distributors
Private label SKUs expanded by 1,200 lines in 2023 across maintenance and wear categories, enabling assortment control and faster replenishment. Shelf penetration in high-turn categories reached 19 in 2024, supported by improved packaging compliance and standardized fitment guides. Regional DC throughput increased 27 loads per day following private label consolidation, improving service levels. Installer repeat purchase rates rose 8 points where private labels met quality thresholds verified through 12-month failure tracking. Shorter sourcing lead times, reduced by 21 days through nearshore suppliers, improve responsiveness to localized demand spikes.
Data-driven assortment optimization by vehicle parc analytics
VIN-level data coverage expanded to 96 million records in 2024, enabling precise SKU rationalization for aging fleets. Predictive demand models improved fill rates by 7 points across top 500 SKUs in urban hubs. Installer bay utilization increased 14 hours per week with improved first-time fit accuracy. Regional assortment turns improved from 3.2 in 2022 to 4.1 in 2024 using vehicle age cohort mapping. Integration of telematics alerts generated 420,000 service triggers in 2024, enabling proactive stocking of high-failure components aligned with observed duty cycles.
Future Outlook
Through 2030, the market is expected to benefit from sustained vehicle aging, higher utilization of light trucks and delivery fleets, and deeper digitization of parts matching and fulfillment. Regional fulfillment densification and EV-specific aftermarket offerings will shape channel strategies. Policy emphasis on safety and emissions compliance will continue to influence replacement cycles.
Major Players
- AutoZone
- Advance Auto Parts
- O’Reilly Auto Parts
- Genuine Parts Company (NAPA Auto Parts)
- LKQ Corporation
- Dorman Products
- BorgWarner
- Tenneco
- Robert Bosch LLC
- Continental Automotive
- ZF Aftermarket
- Magna International
- Gates Corporation
- 3M Automotive Aftermarket
- Aisin USA
Key Target Audience
- Independent automotive parts distributors
- Retail automotive parts chains
- Professional installer networks and garage groups
- Fleet operators and logistics service providers
- Vehicle leasing and rental companies
- E-commerce automotive parts platforms
- Investments and venture capital firms
- Government and regulatory bodies including the U.S. Department of Transportation and the Environmental Protection Agency
Research Methodology
Step 1: Identification of Key Variables
Core variables included vehicle parc age by powertrain, service bay throughput, SKU failure frequency, fulfillment lead times, and channel inventory velocity. Regulatory compliance thresholds and inspection cycles were mapped to replacement intensity. Regional climate and road condition indices were included to model wear patterns across component classes.
Step 2: Market Analysis and Construction
Demand proxies were constructed from miles driven, freight corridor utilization, and inspection volumes. Channel performance was assessed through fill rates, returns, and last-mile coverage density. Product complexity was benchmarked using electronic content per vehicle and diagnostic dependency to estimate replacement cadence.
Step 3: Hypothesis Validation and Expert Consultation
Hypotheses on replacement cycles and channel shifts were validated through structured interviews with installers, warehouse operators, and compliance specialists. Observations were cross-checked against institutional transport statistics, inspection backlogs, and logistics throughput indicators to ensure consistency with observed operating conditions.
Step 4: Research Synthesis and Final Output
Findings were synthesized into channel, product, and regional lenses. Scenario pathways were developed around vehicle aging, electrification mix, and fulfillment densification. Insights were translated into actionable implications for assortment strategy, logistics investments, and compliance readiness.
- Executive Summary
- Research Methodology (Market Definitions and aftermarket part taxonomy, OEM and aftermarket channel mapping and margin analysis, Distributor and retailer sell-in sell-through tracking, Installer survey of part failure rates and replacement cycles, Vehicle parc and age cohort modeling by powertrain, Pricing intelligence from POS and e-commerce scraping, Regulatory and recall database analysis)
- Definition and Scope
- Market evolution
- Usage and maintenance pathways
- Ecosystem structure
- Supply chain and channel structure
- Regulatory environment

- Growth Drivers
Rising average vehicle age and deferred new vehicle purchases
Growth in miles driven post-pandemic and regional commuting patterns
Expansion of e-commerce and same-day delivery to installers
Increasing complexity of vehicle electronics driving replacement demand
Growth of ride-hailing and delivery fleets increasing wear-and-tear
Warranty expirations shifting demand from OEM to independent aftermarket - Challenges
Price competition and margin compression among distributors
Counterfeit and substandard parts in online marketplaces
Supply chain volatility for semiconductors and specialty components
EV adoption reducing demand for select ICE components
Installer labor shortages affecting service throughput
Regulatory compliance costs for emissions and safety standards - Opportunities
Private label expansion by retailers and distributors
Data-driven assortment optimization by vehicle parc analytics
EV-specific aftermarket components and accessories
Connected parts replenishment via telematics-triggered demand
Subscription maintenance programs for fleets
Consolidation of regional distributors improving scale economics - Trends
Private equity-backed roll-ups of distributors and installer networks
Growth of BOPIS and rapid fulfillment models
Rising adoption of remanufactured and sustainable parts
Increased use of VIN-based parts matching and diagnostics integration
Dynamic pricing and promotions tied to local demand signals
Omnichannel integration between retail and professional channels - Government Regulations
- SWOT Analysis
- Stakeholder and Ecosystem Analysis
- Porter’s Five Forces Analysis
- Competition Intensity and Ecosystem Mapping
- By Value, 2019–2024
- By Volume, 2019–2024
- By Installed Base, 2019–2024
- By Average Selling Price, 2019–2024
- By Product Category (in Value %)
Engine and powertrain parts
Brake and suspension components
Electrical and electronics
Filters and fluids
Body, lighting, and exterior parts
Interior and comfort components - By Vehicle Type (in Value %)
Passenger cars
Light trucks and SUVs
Commercial vehicles
Two-wheelers and powersports - By Powertrain Type (in Value %)
ICE vehicles
Hybrid vehicles
Battery electric vehicles - By Sales Channel (in Value %)
OEM dealer parts counters
Independent wholesalers and distributors
Retail chains and specialty stores
E-commerce platforms
Direct-to-installer programs - By End User (in Value %)
DIY consumers
Professional installers and garages
Fleet operators
Car rental and leasing companies
- Market structure and competitive positioning
Market share snapshot of major players - Cross Comparison Parameters (product breadth, private label penetration, channel coverage, fulfillment speed, pricing competitiveness, digital capabilities, installer loyalty programs, geographic footprint)
- SWOT Analysis of Key Players
- Pricing and Commercial Model Benchmarking
- Detailed Profiles of Major Companies
AutoZone
Advance Auto Parts
O’Reilly Auto Parts
Genuine Parts Company (NAPA Auto Parts)
LKQ Corporation
Dorman Products
BorgWarner
Tenneco
Robert Bosch LLC
Continental Automotive
ZF Aftermarket
Magna International
Gates Corporation
3M Automotive Aftermarket
Aisin USA
- Demand and utilization drivers
- Procurement and tender dynamics
- Buying criteria and vendor selection
- Budget allocation and financing preferences
- Implementation barriers and risk factors
- Post-purchase service expectations
- By Value, 2025–2030
- By Volume, 2025–2030
- By Installed Base, 2025–2030
- By Average Selling Price, 2025–2030


 Request a Sample
 Ask for Customization
 Get a Quote
 Enquire Now