
 Download PDF
 Download PDF
Market Overview
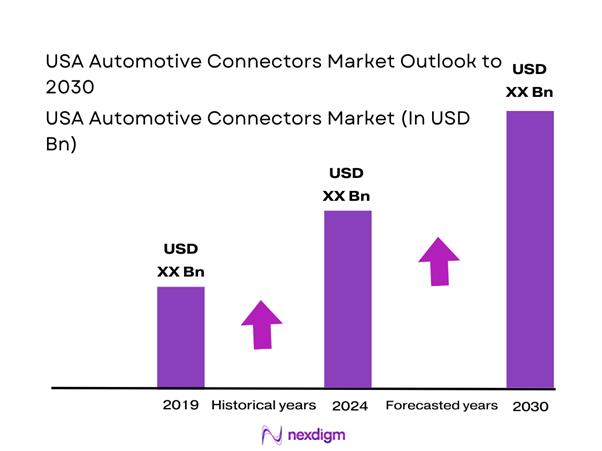
The USA Automotive Connectors market is valued at USD ~ billion in 2024, supported by a multi-layer electronics content cycle spanning electrified powertrains, ADAS/safety ECUs, zonal E/E architectures, high-speed in-vehicle data links, and higher connector counts per vehicle as harness complexity rises. The demand backdrop is reinforced by U.S. new-vehicle sales moving from ~ million units to ~ million units, which supports higher production pull-through for OEM/Tier-1 harnesses and connector suppliers.
Within the U.S., the connector demand gravity sits where OEM final assembly, Tier-1 harness production, electronics integration, and testing labs are densest—especially the Midwest and Southern manufacturing corridors, where high-volume vehicle assembly and Tier-1 supply bases concentrate. One driver is the U.S. export engine: the country shipped ~ new light vehicles and ~ medium/heavy trucks, which typically increases connector qualification rigor, PPAP throughput, and supplier consolidation around proven automotive-grade platforms. Cities/regions with strong OEM/Tier-1 clusters and logistics access dominate due to shorter validation loops, faster engineering change implementation, and proximity to end-customer plants and service networks.
Market Segmentation
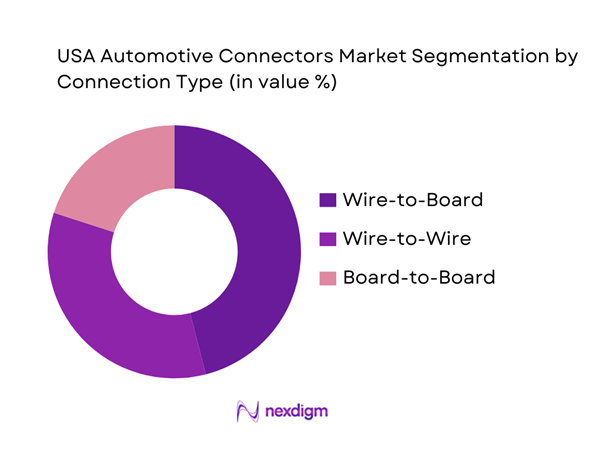
By connection type
The USA Automotive Connectors market is segmented into wire-to-wire, wire-to-board, and board-to-board connectors. Wire-to-board dominates because the U.S. vehicle electronics stack keeps adding ECUs and distributed modules (gateways, radars/cameras, body controllers, battery management, inverters, HVAC, seat modules), and most of these nodes terminate harness circuits onto PCB headers. Wire-to-board also scales across power + signal domains: low-voltage sensor networks, shielded high-speed data (Ethernet/FPD-Link/GMSL), and higher-current lines for actuators and thermal systems. As OEMs push for modular platforms and faster serviceability, standardized wire-to-board interfaces reduce assembly time and enable quicker module swaps during recalls or field failures. In EV architectures, wire-to-board demand expands further with added power electronics, thermal control modules, and dense monitoring circuits around packs and chargers, raising connector count per vehicle.
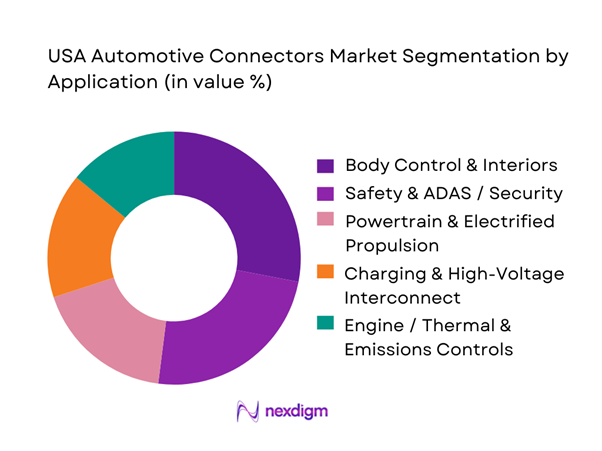
By application
The USA Automotive Connectors market is segmented into body control & interiors, safety/ADAS & security, powertrain/electrified propulsion, charging/high-voltage interconnect, and engine/thermal/emissions controls. Body control & interiors leads because it spans the widest set of high-volume harness circuits—doors, seats, lighting, infotainment interfaces, HVAC controls, switches, and distributed comfort ECUs. These systems exist across every vehicle class and trim level, and they drive large connector volumes through repetitive use across multiple modules per vehicle (e.g., multiple doors, seats, lighting nodes). As U.S. consumers continue to buy feature-rich vehicles (larger screens, powered seats, ambient lighting, advanced HVAC, premium audio), the number of interior modules—and therefore connector endpoints—rises. The segment also sees high replacement/aftermarket activity tied to collision repair and interior component swaps, keeping demand steady even when powertrain mix shifts.
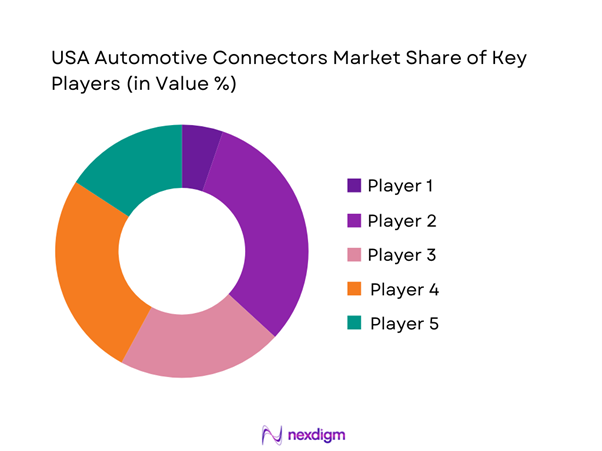
Competitive Landscape
The USA Automotive Connectors market is consolidated around large global connector manufacturers and harness ecosystem leaders that can meet automotive-grade qualification, validation depth, and multi-year supply continuity. Winning suppliers typically combine broad connector portfolios (signal + power + sealed), high-mix manufacturing capability, and deep OEM/Tier-1 program support (design-in, PPAP/APQP, and change control).
| Company | Est. year | HQ | U.S. manufacturing / footprint signal | Automotive connector strength | Sealing & harsh-environment capability | High-speed data capability | EV/high-voltage readiness | Typical routes-to-market |
| TE Connectivity | 2007 | Ireland/Switzerland* | ~ | ~ | ~ | ~ | ~ | ~ |
| Aptiv (Connectors/Interconnect) | 2017 | Ireland* | ~ | ~ | ~ | ~ | ~ | ~ |
| Amphenol (Automotive units) | 1932 | USA | ~ | ~ | ~ | ~ | ~ | ~ |
| Molex | 1938 | USA | ~ | ~ | ~ | ~ | ~ | ~ |
| Yazaki | 1941 | Japan | ~ | ~ | ~ | ~ | ~ | ~ |
USA Automotive Connectors Market Analysis
Growth Drivers
Software-defined vehicle transition
The USA automotive connectors market is being structurally pulled by the rising “software content per vehicle,” which forces OEMs to redesign E/E architectures and, in turn, the connector mix (high-speed data, power distribution, shielding/grounding, and serviceability). A macro tailwind is the scale of the U.S. economy—nominal GDP is reported at USD ~—supporting sustained consumer demand, fleet renewals, and technology investment cycles that translate into higher electronic BOM intensity per vehicle platform. On the investment side, U.S. private fixed investment in software is reported at USD ~, a useful proxy for the broader digitalization base that also feeds automotive embedded software ecosystems (middleware, OTA tooling, cybersecurity tooling, in-vehicle networking stacks). As SDV programs scale, connector design requirements tighten around signal integrity, EMI/EMC control, return-loss performance, and service loops for modular ECUs/zonal controllers—raising demand for engineered connector families rather than commodity terminals. This shift also increases validation loads (component-level + harness-level), expanding demand for suppliers who can document conformance against automotive-grade environmental and reliability test matrices.
ADAS sensor density expansion
ADAS growth increases the number of sensing nodes and data pathways per vehicle—cameras, radars, ultrasonic sensors, steering/braking actuators—each adding connectors at the sensor, intermediate harness breakouts, ECU interfaces, and power distribution points. A direct U.S. operating-condition driver is road utilization: U.S. travel reached ~ billion vehicle-miles on a rolling basis, sustaining a large exposure surface for ADAS deployment and iterative feature upgrades in high-mileage environments (fleet, ride-hail, logistics). More miles also intensify failure-mode sensitivity (fretting corrosion, micro-motion, pin/terminal relaxation, seal degradation), which pushes OEMs and Tier-1s toward higher-spec connector systems—better CPA/TPA locks, improved secondary retention, and more robust sealing/venting strategies for underhood and wheel-well sensor placements. The driver is not only “more sensors,” but “more connectors per sensor stack,” because sensor modules increasingly require separate interfaces for power, data, and diagnostic/service access. As U.S. platforms proliferate higher-level driver-assist configurations, the connector opportunity grows in high-reliability categories such as sealed multi-pin sensor connectors, shielded coax interfaces, and board-to-board/bulkhead connector systems used in centralized compute and zonal designs.
Challenges
Copper and resin price volatility
Volatility in upstream materials creates planning and margin pressure across connector ecosystems (terminals, busbars, shields, and polymer housings). Instead of using market prices, U.S. federal mineral statistics show how supply/demand tightness can shift: U.S. mine production is reported at ~ thousand metric tons and ~ thousand metric tons, while net import reliance is reported at ~. These supply-side fundamentals matter because connector programs are volume-sensitive and often locked to OEM sourcing cycles; sudden input variability pushes suppliers to renegotiate, re-source, or redesign (e.g., alternate alloys, plating thickness optimization, or polymer substitution). On the polymer side, U.S. producer-price tracking for plastics material and resin manufacturing (primary products) shows meaningful index movement across recent periods: ~, ~, and ~. Even when OEM pricing is fixed by contract windows, such swings increase risk around tooling amortization, resin qualification rework, and inventory strategy. For the U.S. automotive connectors market, the operational challenge is maintaining supply continuity and spec compliance (flammability, outgassing, and thermal performance) while input conditions fluctuate—especially for sealed connectors and underhood housings where polymer grade selection is tightly constrained.
Crimp quality and termination reliability
Crimp quality is a persistent failure-risk vector because connectors are only as reliable as the termination process that binds the conductor to the terminal—especially under U.S. duty cycles with high mileage and vibration exposure. Federal road-use reporting shows ~ billion vehicle-miles on a rolling basis, which represents billions of miles of mechanical excitation acting on harnesses, terminations, and connector interfaces. Under such conditions, small process drift (insufficient crimp height control, strand cut, insulation support mis-set, or improper seal compression) can produce intermittent faults that are hard to diagnose and expensive to service, particularly in ADAS and EV architectures where fault tolerance is tighter and diagnostics are more complex. The risk is compounded by increased connector counts per vehicle from EV/ADAS proliferation; more terminations increase the statistical exposure to a “tail risk” of defects, raising the need for automated crimp force monitoring, camera-based inspection, and traceability down to lot/tooling cavity. The macro context matters because large-scale vehicle deployment and ongoing upgrades are supported by the scale of the U.S. economy (GDP at USD ~), meaning production volumes can be high even when individual plants face labor variability and shift changes. In this environment, termination reliability becomes a competitive differentiator—and a bottleneck when suppliers lack robust inline QA and operator-proofing.
Opportunities
High-voltage safety interlock scaling
HV architectures create a large forward-growth runway for safety-interlock and touch-proof connector systems because electrification expands both the installed base and the service footprint that must be made HV-safe. Current U.S. indicators already show material scale: EV registrations are reported at ~ as of a late-year reference point, while public charging infrastructure is reported at ~ charge points—each of which implies increasing HV connector interfaces across vehicles and the charging ecosystem. In addition, public U.S. sales tracking reports over ~ plug-in electric vehicles sold in a single year, meaning a continuing stream of vehicles entering service networks where HV-safe disconnects, interlocks, and serviceable connector designs reduce maintenance risk and downtime. For connector suppliers, the opportunity is to standardize HV interlock architectures (consistent keying, secondary lock systems, and clear labeling conventions), expand sealed HV connector families for harsh zones, and support OEM validation requirements around dielectric withstand and arc prevention. Critically, this can be captured without relying on future statistics: the current installed base and charging count already support higher attach rates of HV safety interlocks per vehicle and per service event, raising demand for proven, automotive-grade HV interconnect platforms in the U.S.
Automated termination and press-fit adoption
Automation in termination and assembly is a high-leverage opportunity because higher connector counts (EV/ADAS) increase the cost of quality escapes, while miniaturization reduces tolerance for manual variability. The U.S. investment environment is supportive: private fixed investment in software is reported at USD ~, a proxy for the broader digitization and automation base that also underpins factory analytics, vision systems, and traceability platforms. On the demand side, U.S. road utilization at ~ billion vehicle-miles means vehicles experience extensive real-world stress—so improving termination consistency (crimp force monitoring, automated insertion verification, end-of-line electrical tests) directly reduces field-failure probability. Press-fit and automated termination methods can also improve repeatability for high-density connectors used in zonal controllers and centralized compute modules, especially where board-level integration and harness modularity are increasing. The opportunity for U.S. connector ecosystems is to couple automation with compliance-grade traceability: cavity-level logging, tool health monitoring, and lot genealogy—so Tier-1s and OEMs can isolate defects quickly and protect warranty exposure. With current U.S. SDV/EV deployment already at scale, the business case for automation is supported by today’s operational volumes and duty-cycle realities, not speculative future assumptions.
Future Outlook
Over the next five years, the USA Automotive Connectors market is expected to expand as U.S. OEMs accelerate electrification, ADAS compute deployment, and E/E architecture modernization. The growth engine is not only higher vehicle production but also more connectors per vehicle driven by: (i) high-voltage and high-current pathways in EVs, (ii) denser sensor suites and zonal gateways, (iii) faster data interfaces inside vehicles, and (iv) higher reliability demands under heat/vibration/chemical exposure. Forecast-wise, one widely cited industry estimate places the market at USD ~ with a projected CAGR of ~.
Major Players
- TE Connectivity
- Aptiv
- Amphenol
- Molex
- Yazaki
- Sumitomo Electric Industries
- Lear Corporation
- Furukawa Electric
- Japan Aviation Electronics
- Hirose Electric
- Rosenberger
- JST
- HARTING
- LAPP
Key Target Audience
- Automotive OEM procurement & supplier quality teams
- Tier-1 harness and E/E system integrators
- EV platform manufacturers & battery pack integrators
- Power electronics and thermal system suppliers
- Automotive electronics EMS/ODM manufacturers
- Automotive distributors and authorized interconnect channel partners
- Investments and venture capitalist firms
- Government and regulatory bodies
Research Methodology
Step 1: Identification of Key Variables
We map the U.S. connector ecosystem across OEMs, Tier-1s, harness makers, connector manufacturers, distributors, materials suppliers (copper alloys, plating metals, engineering polymers), and test/validation labs. We define variables such as connector type mix, sealing rate, data-rate requirements, and EV/ICE build mix.
Step 2: Market Analysis and Construction
We compile historical demand signals using vehicle sales/production, export activity, and platform complexity indicators, then translate electronics content shifts into connector value pools by application and connection type. We structure the market into measurable segments aligned to automotive APQP/PPAP program workflows.
Step 3: Hypothesis Validation and Expert Consultation
We validate assumptions through expert interviews with program managers, supplier quality leaders, and engineering teams across connector OEMs, Tier-1 harness suppliers, and EV subsystem manufacturers. This step stress-tests BOM assumptions, qualification cycles, and sourcing trends (dual-sourcing, localization).
Step 4: Research Synthesis and Final Output
We triangulate findings with bottom-up program mapping, competitive benchmarking, and supply chain risk checks (lead times, resin/plating constraints, counterfeits). The final output is synthesized into segment-level shares, competitive positioning, and decision-ready insights for buyers and investors.
- Executive Summary
- Research Methodology (Market Definitions & Boundary Conditions, Scope-to-Deliverables Mapping, Abbreviations, Data Triangulation Logic, Bottom-Up Build (OEM/Supplier Bill-of-Materials Mapping), Top-Down Build (Vehicle Parc & Production × Connector Content), Primary Interview Program (OEM/Tier-1/Tier-2/Distributor), Pricing & BOM Normalization, Validation & Sensitivity Tests, Assumptions Register, Limitations & Confidence Scoring)
- Definition and Scope
- Market Genesis and Adoption Narrative
- Industry Timeline and Platform Inflection Points
- Automotive Electrical/Electronic Architecture Context
- Supply Chain and Value Chain Map
- Business Cycle and Demand Cyclicality Linkages

- Growth Drivers
Software-defined vehicle transition
ADAS sensor density expansion
EV and high-voltage harness proliferation
Automotive Ethernet adoption
Thermal and vibration ruggedization demand - Challenges
Copper and resin price volatility
Crimp quality and termination reliability
Miniaturization versus durability trade-offs
Counterfeit connector circulation
Lead-time and capacity constraints - Opportunities
High-voltage safety interlock scaling
Automated termination and press-fit adoption
Mini-FAKRA and Ethernet connector growth
USMCA-driven localization
Circular material recovery - Trends
- Regulatory & Policy Landscape
- SWOT Analysis
- Stakeholder & Ecosystem Analysis
- Porter’s Five Forces Analysis
- Competitive Intensity & Ecosystem Mapping
- By Value, 2019–2024
- By Volume, 2019–2024
- By ASP Waterfall, 2019–2024
- By Fleet Type (in Value %)
Passenger Cars
Light Trucks and SUVs
Commercial Vehicles
Off-Highway and Industrial Vehicles
Specialty Fleets - By Application (in Value %)
Powertrain and Electrification
ADAS and Sensing
Infotainment and Telematics
Body and Comfort Systems
Lighting - By Technology Architecture (in Value %)
ICE Architecture
Hybrid Electric Architecture
Plug-in Hybrid Architecture
Battery Electric Architecture
Zonal Electrical Architecture - By Connectivity Type (in Value %)
Low-Voltage Signal Connectors
Low-Voltage Power Connectors
High-Speed Data Connectors
Coaxial and RF Connectors
High-Voltage and HVIL Connectors - By End-Use Industry (in Value %)
OEM Vehicle Manufacturing
Tier-1 Harness Manufacturing
Tier-2 Component Integration
Aftermarket and Service
Fleet Maintenance and Upfitting - By Region (in Value %)
West Coast
Midwest
South
Northeast
Southeast
- Market Share Benchmarking
- Cross Comparison Parameters (HV and HVIL portfolio depth, high-speed data portfolio maturity, SAE and USCAR qualification coverage, sealing and thermal rating capability, crimp and termination ecosystem strength, manufacturing footprint and localization readiness, field quality and traceability performance, lead-time and capacity scalability)
- Strategic Moves Tracker
- SWOT Analysis of Key Players
- Pricing and SKU Benchmarking
- Detailed Profiles of Major Companies
TE Connectivity
Amphenol Corporation
Aptiv
Yazaki Corporation
Molex
Sumitomo Electric Industries
Lear Corporation
Leoni
Korea Electric Terminal
Rosenberger Hochfrequenztechnik
Luxshare Precision Industry
JST Manufacturing
HARTING Technology Group
Furukawa Electric
ITT Cannon
- Demand Centers
- Sourcing and Nomination Workflow
- Decision Criteria and Weighting
- Pain Points
- Serviceability and Repair Ecosystem
- By Value, 2025–2030
- By Volume, 2025–2030
- By ASP, 2025–2030


 Request a Sample
 Ask for Customization
 Get a Quote
 Enquire Now