
 Download PDF
 Download PDF
Market Overview
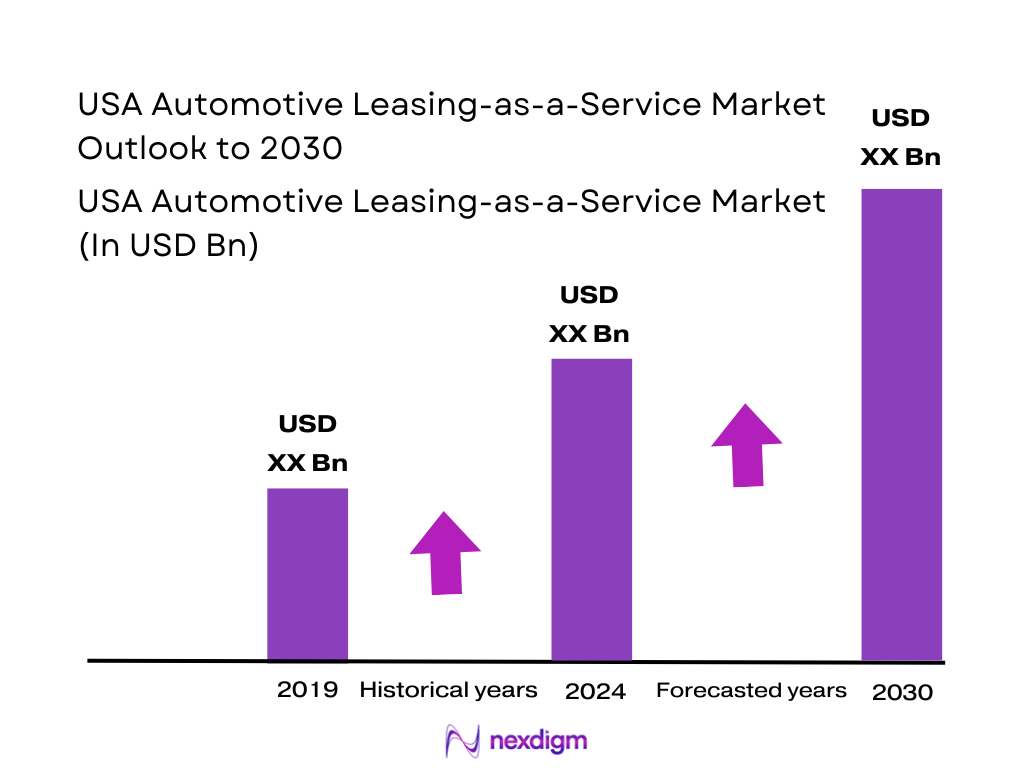
The USA Automotive Leasing-as-a-Service market (vehicle subscription/flexible bundled leasing) is valued at USD ~ million in the prior year and USD ~ million in the latest year, reflecting a fast-scaling shift toward “access over ownership” bundles that wrap the vehicle, maintenance, roadside, and often insurance into one monthly payment. Growth is pushed by consumer sensitivity to rate-driven monthly affordability, the desire for term flexibility (shorter commitments, swap options), and OEMs/rental fleets monetizing recurring mobility revenue via app-led origination and fleet utilization optimization.
Demand concentrates in large metro corridors such as New York City, Los Angeles, the San Francisco Bay Area, Miami, Chicago, Dallas–Fort Worth, Seattle, and Washington DC/Northern Virginia, where high population density, strong professional inflows/relocations, and digital-first consumers make “monthly mobility” attractive versus long commitments. The broader car market also remained sizable—~ new-vehicle sales in the prior year and ~ in the latest year—supporting larger pools for OEM/captive programs, rental fleets, dealer logistics, and remarketing networks that make subscriptions operationally feasible in these metros.
Market Segmentation
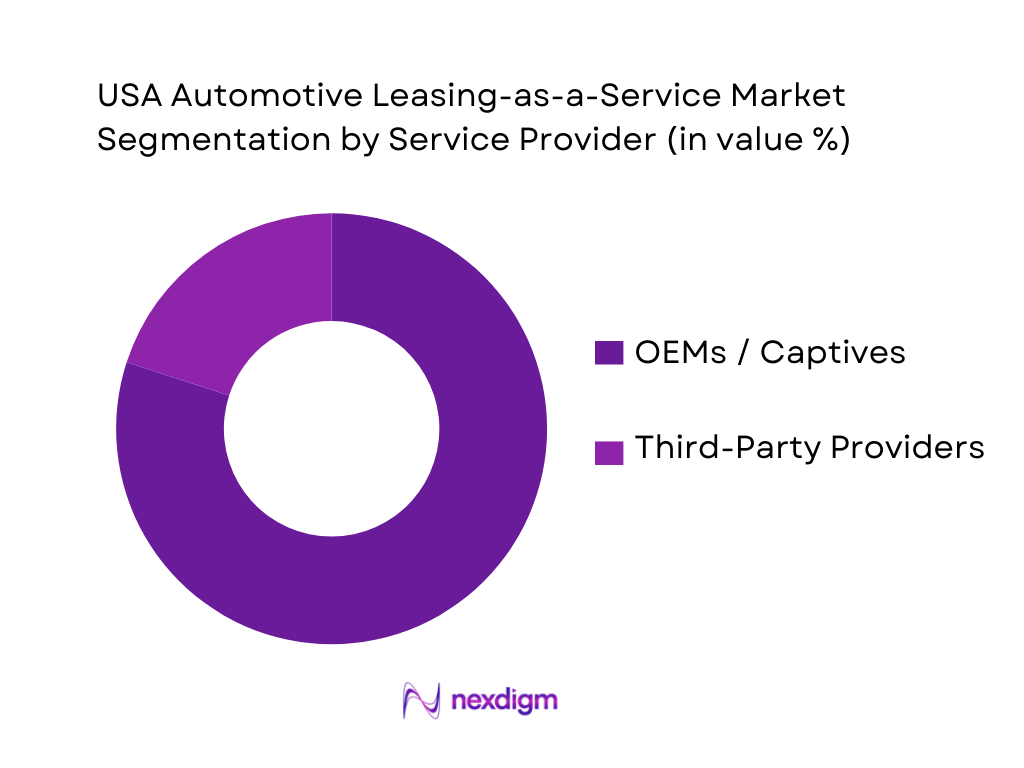
By Service Provider
The USA Automotive Leasing-as-a-Service market is segmented into OEMs/captives and third-party providers. Recently, OEMs/captives hold the dominant share because they control the most critical levers: vehicle supply (allocation of high-demand trims), pricing support (incentives, subvention capability), and integrated servicing through dealer networks. Captives also benefit from established credit decisioning, remarketing channels, and residual-value governance—key to preventing losses when used-vehicle prices move. Finally, OEM programs can bundle brand loyalty perks (upgrades, service lanes, connected features) and use subscriptions as a “trial funnel” for EVs and premium models, lifting lifetime value and reducing churn friction compared with standalone platforms.
By Subscription Type
Automotive Leasing-as-a-Service is commonly structured as single-brand or multi-brand programs. Recently, single-brand subscriptions dominate because OEMs can design bundles around their own warranty rules, dealer service standards, telematics stack, and residual strategies, making unit economics more predictable. Brand programs also simplify customer expectations (consistent vehicle experience, service process, damage policy), enabling clearer pricing and higher trust—important when the monthly fee is higher than a conventional lease payment. In addition, OEM/captive programs can push subscriptions through existing dealer relationships and loyalty databases, while multi-brand platforms must continuously balance fleet mix, procurement costs, and reconditioning variability across multiple makes and models.

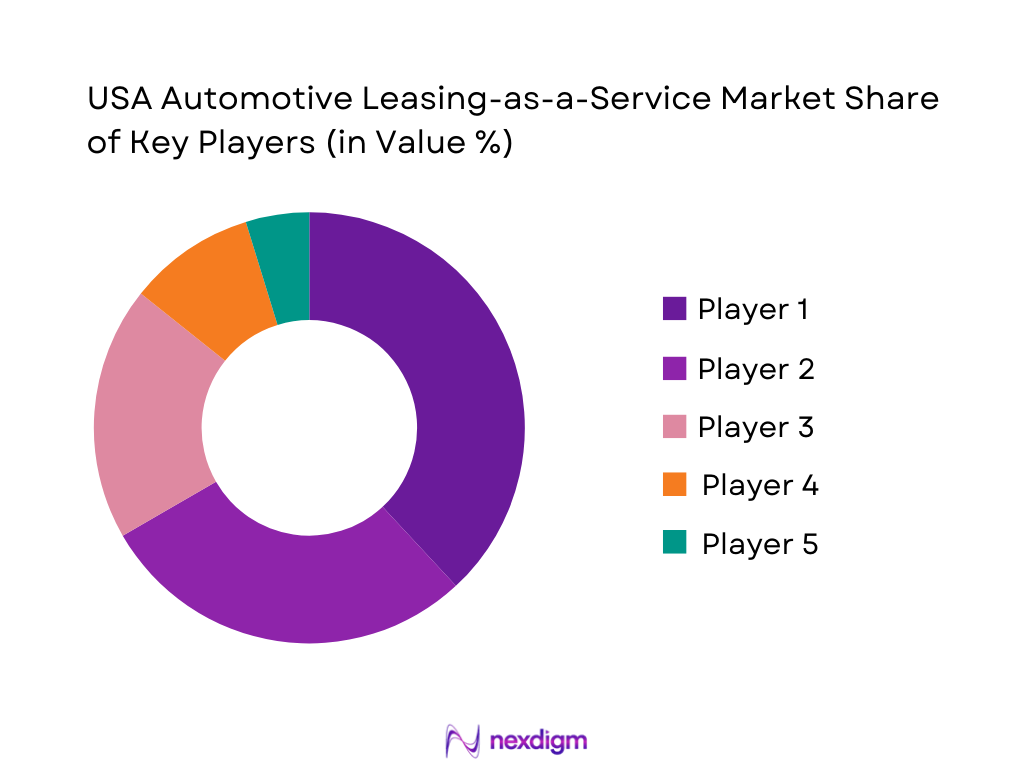
Competitive Landscape
The USA Automotive Leasing-as-a-Service market is led by a combination of OEM/captive programs and large mobility operators (rental and fleet lessors), with a smaller set of pure-play subscription providers concentrated in major metros. This structure reflects the operational intensity of the model—fleet procurement, underwriting, insurance/claims, servicing SLAs, and remarketing—where scaled players with supply and networks can compete on reliability, availability, and economics, while niche providers differentiate via flexibility and speed of approval.
| Company | Est. Year | Headquarters | Primary Model | Core Customer Focus | Coverage Style | Vehicle Mix Focus | Swap/Term Flexibility | Bundle Depth (insurance/maintenance) |
| Flexcar | 2000 | Boston, Massachusetts (USA) | ~ | ~ | ~ | ~ | ~ | ~ |
| SIXT (SIXT+) | 1912 | Pullach, Germany | ~ | ~ | ~ | ~ | ~ | ~ |
| FINN | 2019 | Munich, Germany | ~ | ~ | ~ | ~ | ~ | ~ |
| Enterprise Fleet Management | 1971 | St. Louis, Missouri (USA) | ~ | ~ | ~ | ~ | ~ | ~ |
| Hertz | 1918 | Estero/Naples area, Florida (USA) | ~ | ~ | ~ | ~ | ~ | ~ |
USA Automotive Leasing-as-a-Service Market Analysis
Growth Drivers
Digitized origination and approval workflows
Leasing-as-a-Service platforms are benefiting from the scale and reliability of the U.S. digital infrastructure that supports identity verification, document exchange, underwriting automation, and always-on customer servicing. The U.S. hosts ~ secure internet servers per ~ people, enabling high-volume encrypted transactions and integrations with insurers, payment rails, and fleet telematics providers. This matters because LaaS relies on end-to-end digital “quote-to-deliver” execution across many counterparties (OEM/dealer groups, lenders, insurers, maintenance networks). Demand strength is also supported by the broader economic base: the U.S. economy is USD ~ trillion, and GDP per capita is USD ~, which underpins higher smartphone penetration, digital payments adoption, and a customer expectation of instant approvals and app-based servicing—key to subscription-style mobility journeys.
Rising corporate fleet outsourcing
Corporate fleet outsourcing is accelerating because operating fleets at scale is becoming more operationally complex while utilization needs remain high. In the U.S., vehicle activity is structurally large: cumulative travel is ~ vehicle miles, and total motor vehicles registered are ~. These operating volumes translate into constant requirements for vehicle provisioning, replacements, downtime minimization, compliance management, and lifecycle maintenance—areas where LaaS models provide standardized SLAs, centralized billing, and unified policy controls. Businesses also face increasing financial discipline around balance-sheet flexibility and cost predictability; leasing-as-a-service can shift administrative burden away from internal fleet teams and reduce fragmented vendor management (separate contracts for leasing, insurance, tires, and servicing). The macro backdrop matters: the U.S. economic scale at USD ~ trillion supports a wide base of multi-site employers across logistics, services, construction, and field operations, where fleets are mission-critical and where outsourcing is often justified by governance, internal controls, and procurement requirements.
Challenges
Residual value volatility
Residual value uncertainty is a major constraint for LaaS because pricing and risk models depend on predictable end-of-term vehicle values. In the U.S., used-vehicle price dynamics have been unstable across recent periods, which increases portfolio risk for lessors and subscription operators. A practical indicator is the CPI index for used cars and trucks, which was ~ in Aug after moving materially across prior months and years; this volatility affects remarketing proceeds and can force repricing or tighter eligibility. LaaS operators also face the interaction between residuals and utilization: when road use is high—cumulative travel at ~ vehicle miles—wear-and-tear dispersion increases, which creates higher variance in condition-based remarketing outcomes. Additionally, technology shifts (ADAS features, EV battery specs, and software-driven vehicle updates) accelerate model obsolescence and can widen value differences between trim levels. The macro context matters because the U.S. economic base (USD ~ trillion) supports large used-vehicle ecosystems and financing volumes, but it also magnifies the systemic impact of residual swings across millions of vehicles.
Credit tightening and approval constraints
LaaS growth can be constrained when consumer and SME credit becomes harder to access, because subscriptions and leases still require underwriting discipline and loss-control policies. A key market reality is that U.S. household balance sheets carry significant auto exposure: auto loan balances stand at USD ~ trillion. When underwriting tightens, approval funnels narrow, deposits/guarantors may be required, and customer acquisition costs rise—particularly for thin-file borrowers and gig-economy applicants with variable income. For business fleets, credit tightening can shift demand toward larger corporate accounts with stronger financials, concentrating revenue but limiting addressable breadth. This is not just a financial-market story; it is tied to macro fundamentals. The U.S. economy is USD ~ trillion, meaning small changes in financing conditions can cascade across large volumes of vehicle transactions and renewals. LaaS providers must therefore invest more heavily in risk segmentation, fraud detection, and portfolio monitoring—capabilities that raise operational costs but are essential to avoid charge-offs and repossession complexity.
Opportunities
EV-focused subscription and leasing programs
A near-term opportunity is to design EV-first LaaS offerings optimized around utilization, charging access, and predictable total operating experience—without relying on customers to manage multiple vendor relationships. Current conditions support this: U.S. road usage remains very high at ~ vehicle miles, which makes reliability and uptime central; EV subscriptions can be positioned as “operationally managed electrification,” including home/depot charging enablement, service scheduling, and replacement-vehicle guarantees. Digital readiness further supports EV LaaS: the U.S. has ~ secure internet servers per ~ people, enabling the integrations needed for charging payments, telematics-based energy optimization, and automated driver policy controls. The macro base—GDP at USD ~ trillion and GDP per capita at USD ~—supports early adoption cohorts (tech-forward consumers and corporates) and higher willingness to pay for convenience. Importantly, the opportunity is not “future-hyped”; it is grounded in current operating realities where customers want to test EV fit while avoiding long-term ownership risk.
Employer-sponsored mobility benefits
Employer-sponsored mobility is a strong whitespace opportunity for LaaS because it converts transportation access into a managed benefit—especially for roles that require commuting reliability, field travel, or frequent relocation. The underlying demand base is supported by U.S. economic scale (USD ~ trillion GDP) and high mobility intensity (cumulative travel ~ vehicle miles). Employers face direct operational risk when employees lack reliable transportation, and LaaS can be structured as a controlled program (policy-based eligibility, capped personal use, bundled insurance, and maintenance SLAs). This model can also address credit-access friction: with USD ~ trillion in auto loan balances, not every worker can qualify for a standalone lease or finance product, whereas employer-backed programs can incorporate payroll deduction or corporate guarantees while improving retention and productivity. Digitization capacity also matters—secure internet servers at ~ per ~ people support identity verification, onboarding, and recurring benefit administration at scale.
Future Outlook
Over the next several years, the USA Automotive Leasing-as-a-Service market is expected to expand rapidly as consumers and SMEs prioritize flexibility, and as OEMs/rental fleets improve operational economics through better underwriting, telematics-driven risk controls, and faster reconditioning cycles. The market’s revenue trajectory to USD ~ million by the end of the forecast window implies a high-growth runway, with increasing experimentation around EV subscriptions, bundled charging/perks, and employer-supported mobility programs.
Major Players
- Flexcar
- SIXT+
- FINN
- Autonomy
- Hertz
- Avis
- Fair
- Care by Volvo
- Porsche Drive
- Toyota Financial Services
- Ford Motor Credit
- GM Financial
- Enterprise Fleet Management
- Element Fleet Management
Key Target Audience
- OEM Strategy & Mobility Business Unit Heads
- Captive Auto Finance Product Leaders
- Rental Fleet & Mobility Platform Executives
- Corporate Fleet Directors & Procurement Heads
- Auto Insurance Carriers & Usage-Based Insurance Leaders
- Remarketing & Auction Network Leadership
- Investments and venture capitalist firms
- Government and regulatory bodies
Research Methodology
Step 1: Identification of Key Variables
The first phase builds an ecosystem map covering OEMs, captives, rental fleets, subscription platforms, dealers, insurers, and remarketers. We define the revenue boundary for “Leasing-as-a-Service” (subscription and flexible bundled leasing) and identify key variables such as active fleet deployed, average monthly bundle, churn, claims intensity, and reconditioning cycle time.
Step 2: Market Analysis and Construction
We compile historical market indicators (subscription revenues, fleet deployment signals, and program footprints) and align them with the service-provider segmentation used in published databases. A bottom-up build is run using program pricing bands, utilization assumptions, and operational KPIs, then triangulated against top-down published market revenue benchmarks.
Step 2: Hypothesis Validation and Expert Consultation
Market hypotheses are validated through structured interviews with OEM mobility teams, captive finance leaders, fleet operators, insurers/TPAs, and remarketing partners. Discussions focus on underwriting approval rates, loss ratios, residual management practices, and operational bottlenecks (delivery, service SLAs, swaps, reconditioning).
Step 4: Research Synthesis and Final Output
All insights are synthesized into a consistent model and stress-tested via scenarios (rate changes, used-car price swings, EV incentives, insurance volatility). Outputs are finalized after reconciliation of conflicting data points, ensuring the market sizing and segment narrative align with observed program realities and published datapoints.
- Executive Summary
- Research Methodology (Market Definitions and Assumptions, Abbreviations, Service Scope Boundaries, Market Sizing Approach, Triangulation Framework, Primary Interviews and Stakeholder Coverage, Secondary Research Sources, Data Validation and Confidence Scoring, Limitations and Forward Assumptions)
- Definition and Scope
- Overview Genesis
- Timeline of Major Players
- Business Cycle
- Supply Chain and Value Chain Analysis

- Growth Drivers
Digitized origination and approval workflows
Rising corporate fleet outsourcing
EV access without ownership risk
Bundled insurance and maintenance demand - Challenges
Residual value volatility
Credit tightening and approval constraints
Insurance cost inflation
Multi-state regulatory complexity - Opportunities
EV-focused subscription and leasing programs
Employer-sponsored mobility benefits
Usage-based and flexible tenure leasing
Embedded finance and platform partnerships - Trends
AI-driven underwriting and fraud detection
Telematics-led asset utilization optimization
End-to-end digital contracting
Automated remarketing and resale platforms - Regulatory & Policy Landscape
- SWOT Analysis
- Stakeholder & Ecosystem Analysis
- Porter’s Five Forces Analysis
- Competitive Intensity & Ecosystem Mapping
- By Value, 2019–2024
- By Volume, 2019–2024
- By Average Monthly Payment and Effective Rate, 2019–2024
- Installed Lease Portfolio Outstanding, 2019–2024
- Service Revenue Mix, 2019–2024
- By Fleet Type (in Value %)
Retail Individual Customers
SME and Small Fleets
Enterprise and Corporate Fleets
Government and Public Sector Fleets
Gig Economy and Platform Drivers - By Application (in Value %)
Personal Mobility
Corporate and Employee Mobility
Last-Mile and Urban Logistics
Field Service and Utility Fleets
Executive and Premium Mobility - By Technology Architecture (in Value %)
ICE Vehicle Leasing Platforms
Hybrid Vehicle Leasing Platforms
Battery Electric Vehicle Leasing Platforms
Plug-in Hybrid Leasing Platforms - By Connectivity Type (in Value %)
Telematics-Enabled Leasing
Non-Connected Traditional Leasing
AI and Data-Driven Smart Leasing Platforms - By End-Use Industry (in Value %)
Logistics and Transportation
IT and Professional Services
Retail and E-commerce
Public Sector and Utilities
Healthcare and Life Sciences - By Region (in Value %)
Northeast
Midwest
South
West
- Market Share of Major Players by Leasing Model and Fleet Scale
- Cross Comparison Parameters (origination and underwriting model, residual value ownership strategy, service bundle depth and SLA coverage, telematics and data integration capability, funding structure and cost of capital approach, digital customer journey and time-to-delivery, remarketing and reconditioning network strength, multi-state compliance operating model)
- Strategic Initiatives and Recent Developments
- SWOT Analysis of Major Players
- Pricing and Packaging Benchmarking
- Detailed Profiles of Major Companies
Element Fleet Management
Wheels
Donlen
ARI Fleet Management
Merchants Fleet
Enterprise Fleet Management
Holman
Ayvens (ALD Automotive and LeasePlan)
Ryder System
Penske Truck Leasing
GM Financial
Ford Credit
Toyota Financial Services
BMW Financial Services
- Market Demand and Utilization Patterns
- Budgeting and Accounting Considerations
- Needs, Desires, and Pain Point Analysis
- Decision-Making Process and Stakeholder Roles
- Buyer Personas and Use-Case Mapping
- By Value, 2025–2030
- By Volume, 2025–2030
- By Average Monthly Payment and Effective Rate, 2025–2030
- Installed Lease Portfolio Outstanding, 2025–2030
- Service Revenue Mix, 2025–2030


 Request a Sample
 Ask for Customization
 Get a Quote
 Enquire Now