 Download PDF
Market Overview
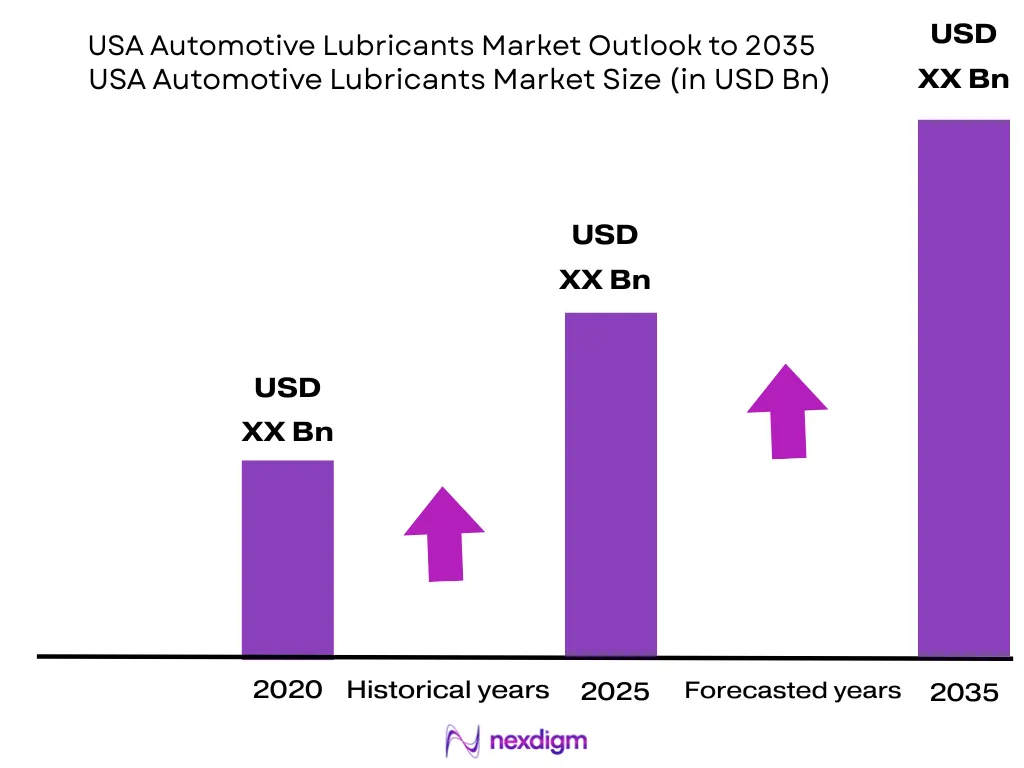
The USA Automotive Lubricants Market is valued at approximately ~ billion, compared with ~ billion in the preceding reporting period. Demand is supported by a registered vehicle base that increased from 284,614,269 units to 297,525,836 units, alongside extensive passenger, pickup, commercial-truck, motorcycle, and fleet activity. Engine oils, transmission fluids, gear oils, greases, coolants, and specialty fluids remain essential for scheduled maintenance, component protection, fuel economy, and vehicle longevity. Texas, California, the Gulf Coast, the Great Lakes, and major metropolitan markets including Houston, Dallas, Los Angeles, Chicago, Atlanta, and New York dominate the USA Automotive Lubricants Market. California reported 31,057,329 registered vehicles, while Texas recorded 23,477,492 vehicles in the preceding reporting period. These locations lead because they combine dense vehicle populations, freight corridors, refining and base-oil infrastructure, lubricant blending, distributor networks, quick-lube outlets, dealerships, repair workshops, ports, and large commercial fleets. The USA Automotive Lubricants Market includes passenger-car motor oils, heavy-duty diesel engine oils, automatic and manual transmission fluids, continuously variable transmission fluids, dual-clutch fluids, gear oils, axle fluids, greases, brake fluids, power-steering fluids, coolants, compressor lubricants, hydraulic fluids, electric-drive fluids, and battery thermal-management fluids. Market revenue covers factory-fill and service-fill products sold through retail stores, quick-lube centres, dealerships, independent workshops, distributors, e-commerce platforms, and direct fleet contracts.
Market Segmentation
By Product Type
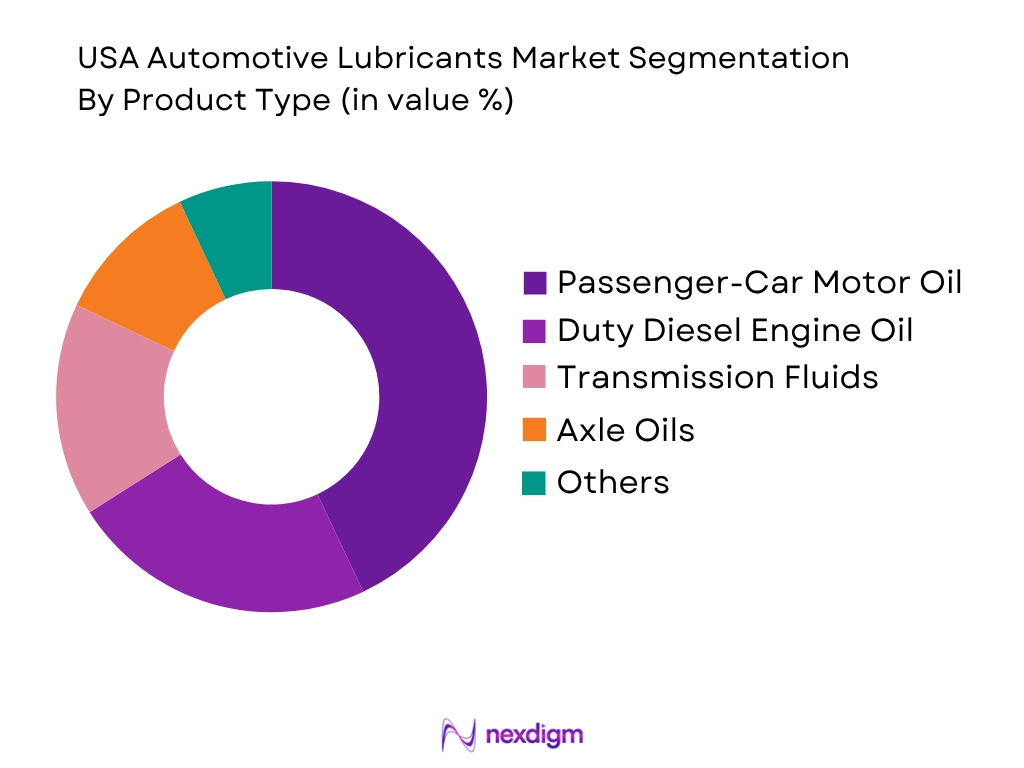
By product type, the USA Automotive Lubricants Market is segmented into passenger-car motor oil, heavy-duty diesel engine oil, transmission fluids, gear and axle oils, automotive greases, coolants and antifreeze, brake and steering fluids, and electric-vehicle functional fluids. Passenger-car motor oil holds the dominant market share because the United States has an exceptionally large light-duty vehicle parc and extensive do-it-yourself and do-it-for-me maintenance channels. Passenger cars, SUVs, crossovers, vans, and pickup trucks require repeated oil changes throughout their service lives. The segment also benefits from significant product differentiation by viscosity, base-oil technology, vehicle age, mileage, engine design, and OEM specification. Full-synthetic, synthetic-blend, high-mileage, turbocharged-engine, hybrid, European-vehicle, and extended-drain oils allow suppliers to serve multiple price tiers. Retailers and installers dedicate substantial inventory and promotional space to five-quart jugs, quart bottles, bulk motor oils, filters, and bundled oil-change services. Although longer drain intervals constrain volume, premium synthetic conversion and an ageing vehicle base support value generation.
By Sales Channel
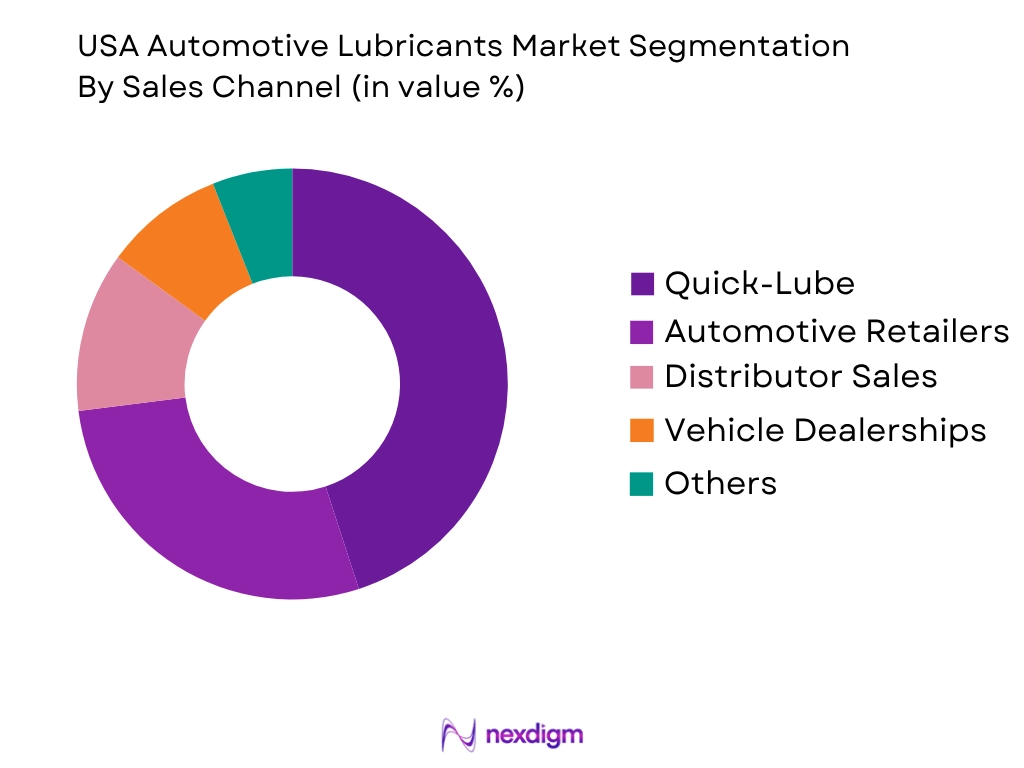
By sales channel, the USA Automotive Lubricants Market is segmented into quick-lube and service centres, automotive parts retailers, vehicle dealerships, independent workshops, direct fleet and distributor sales, mass merchandisers, warehouse clubs, fuel stations, and e-commerce. Quick-lube and professional service channels hold the dominant market share because many motorists prefer installation convenience, service reminders, fluid inspection, and correct product selection over purchasing and replacing lubricants independently. Quick-lube operators manage high vehicle throughput and purchase passenger-car motor oils in bulk, allowing them to offer conventional, synthetic-blend, full-synthetic, diesel, and high-mileage service packages. Dealerships and workshops contribute through OEM-approved products, warranty-related maintenance, transmission services, differential-fluid replacement, coolant exchange, and multipoint inspections. Installer recommendations influence viscosity and brand selection, particularly as specifications become more complex. Commercial fleets also purchase through distributors and direct contracts, but professional light-vehicle service locations benefit from frequent consumer visits, bundled filters, labour revenue, and centralised used-oil collection.
Competitive Landscape
The USA Automotive Lubricants Market is concentrated among integrated energy companies, established lubricant specialists, independent blenders, OEM-branded suppliers, and private-label manufacturers. Competition is shaped by brand recognition, API and OEM approvals, synthetic-product breadth, base-oil access, blending capacity, distributor coverage, quick-lube relationships, fleet technical support, pricing, and innovation in hybrid and electric-vehicle fluids. Large integrated companies benefit from feedstock access, national distribution, recognised brands, and extensive product portfolios. Specialist companies compete through application expertise, racing credentials, extended-drain technology, high-mileage formulations, direct-to-consumer distribution, and premium positioning. Private labels place additional pressure on mainstream packaged motor oils, particularly through mass retail and automotive-parts channels.
| Company | Established | Headquarters | Major Automotive Brands | Core Products | Base-Oil Position | Primary Channels | Heavy-Duty Capability | EV/Hybrid Fluid Readiness |
| ExxonMobil | 1999 corporate combination; heritage from 1870 | Spring, Texas | ~ | ~ | ~ | ~ | ~ | ~ |
| Shell USA | More than 100 years of US operations | Houston, Texas | ~ | ~ | ~ | ~ | ~ | ~ |
| Chevron | 1879 | Houston, Texas | ~ | ~ | ~ | ~ | ~ | ~ |
| Valvoline Global Operations | 1866 | Lexington, Kentucky | ~ | ~ | ~ | ~ | ~ | ~ |
| Phillips 66 | 2012 as an independent company; earlier operating heritage | Houston, Texas | ~ | ~ | ~ | ~ | ~ | ~ |
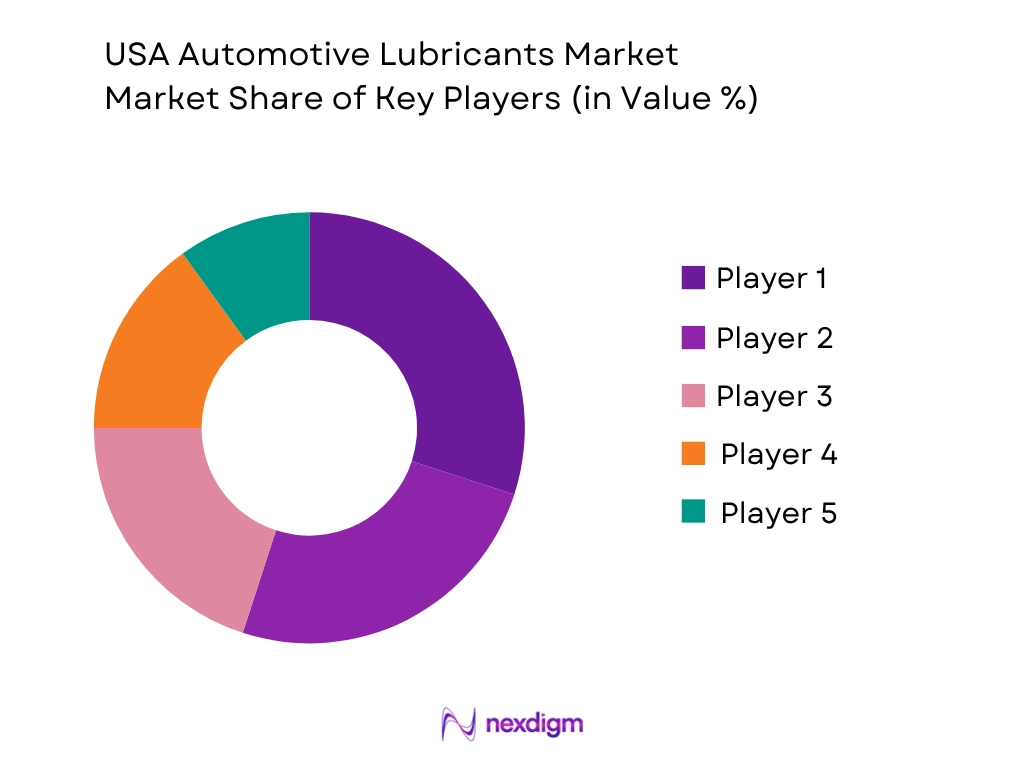
USA Automotive Lubricants Market Analysis
Growth Drivers
Large Vehicle Parc and Expanding Road Usage
The extensive US vehicle parc creates recurring demand for engine oils, transmission fluids, axle lubricants, greases, coolants and other service-fill products. The Federal Highway Administration recorded 297,525,836 registered motor vehicles in 2024, compared with 284,614,269 vehicles in 2023. The 2024 total included 271,085,742 light-duty vehicles, 12,599,614 single-unit trucks, 3,482,896 combination trucks, 9,261,249 motorcycles and 1,096,335 buses. Vehicles travelled approximately 3.294 trillion miles, including 2.924 trillion light-duty vehicle miles and 192.520 billion combination-truck miles. These operating volumes generate lubricant replacement through engine hours, thermal cycling, oxidation, contamination and mechanical wear. Combination trucks averaged 55,276 miles per vehicle, supporting heavy-duty engine oils, transmission fluids, differential lubricants, coolants and chassis greases. The broader economy also supports maintenance expenditure and fleet investment: the US Bureau of Economic Analysis reported current-dollar GDP at an annualised USD 29.35 trillion during the third quarter of 2024. The combination of nearly 298 million vehicles, extensive road utilisation and large commercial fleets provides a durable demand base for packaged, bulk and professionally installed automotive lubricants.
Growth of Synthetic, Low-Viscosity and Specification-Compliant Lubricants
Modern engine architecture is increasing demand for technically advanced lubricants rather than basic mineral oils. Turbocharged gasoline engines, direct injection, hybrid powertrains, tighter clearances, oil-life monitoring and emission-control systems require products with stronger oxidation stability, deposit control, wear protection and low-temperature flow. The American Petroleum Institute’s licensing framework covers passenger-car and heavy-duty engine oils and provides recognised quality marks for compliant formulations. Suppliers must accommodate API SQ, ILSAC GF-7A, ILSAC GF-7B, API CK-4 and other application-specific categories while maintaining compatibility with numerous OEM specifications. The potential service population is substantial: FHWA counted 205,550,881 short-wheelbase light-duty vehicles and 65,534,861 long-wheelbase light-duty vehicles in 2024. These vehicles travelled a combined 2.924 trillion miles, creating repeated opportunities for full-synthetic, synthetic-blend, high-mileage and fuel-economy oils. Average fuel efficiency increased to 25.6 miles per gallon for short-wheelbase light-duty vehicles and 18.5 miles per gallon for long-wheelbase vehicles, reinforcing manufacturer emphasis on lower-friction lubricants. This specification transition supports premium product mix, installer training, API licensing, laboratory testing, differentiated packaging and higher-value service packages across retail, dealership and quick-lube channels.
Market Challenges
Extended Drain Intervals and Declining Lubricant Consumption per Vehicle
Improved lubricant chemistry and modern engine-management systems are reducing the frequency of engine-oil replacement, limiting volume growth despite expansion of the vehicle parc. Full-synthetic oils offer better oxidation control, viscosity retention, thermal stability and deposit management, enabling longer service intervals under normal driving conditions. Oil-life monitoring systems also calculate maintenance timing using engine temperature, load, operating hours and trip patterns instead of relying only on fixed mileage. FHWA data show that average annual travel across all registered motor vehicles declined from 11,408 miles per vehicle in 2023 to 11,071 miles in 2024. Average travel for short-wheelbase light-duty vehicles declined from 11,026 miles to 10,812 miles, while long-wheelbase light-duty vehicles declined from 11,360 miles to 10,707 miles. Combination trucks averaged 55,276 miles, below 58,890 miles in the preceding year. Lower mileage and longer drain intervals can reduce annual lubricant litres consumed per vehicle and increase competition for each service event. Suppliers must therefore rely increasingly on synthetic premiumisation, high-mileage products, transmission services, coolant exchanges, gear oils and bundled maintenance. The challenge is strongest for conventional passenger-car motor oils and operators dependent on frequent low-value oil changes.
Electrification and Increasing Powertrain Complexity
Battery-electric vehicles create a structural challenge because they eliminate crankcase engine oil and reduce demand for several conventional service fluids. The US Energy Information Administration recorded approximately 1.482 million battery-electric vehicles and 430,900 plug-in hybrid vehicles in California alone during 2024. Florida recorded about 323,400 battery-electric vehicles and 67,900 plug-in hybrids, while Colorado had approximately 122,700 battery-electric vehicles and 46,900 plug-in hybrids. Nationally, electric drivetrains are gradually shifting lubricant demand toward e-axle fluids, reduction-gear oils, low-conductivity coolants, compressor lubricants, electric-motor bearing greases and battery thermal-management fluids. These products are technically valuable but generally require lower replacement volumes than internal-combustion engine oil. The challenge is compounded by powertrain diversity: suppliers must simultaneously support gasoline engines, diesel engines, hybrids, plug-in hybrids, battery-electric vehicles, natural-gas fleets and legacy vehicles. This creates more SKUs, complex compatibility requirements and higher inventory-management costs for retailers, distributors and workshops. Companies also need dielectric testing, material-compatibility expertise and new OEM approvals. The market must therefore manage declining conventional oil intensity while investing in fluid technologies whose service intervals and aftermarket replacement patterns remain less mature.
Market Opportunities
Electric Vehicle and Hybrid Functional Fluid Development
Electrification creates a product-development opportunity even as it reduces conventional engine-oil demand. Registered electric light-duty vehicles already represent a meaningful installed base in major automotive states. California recorded approximately 1.913 million combined battery-electric and plug-in hybrid vehicles, Florida recorded 391,300, Colorado recorded 169,600, Arizona recorded 135,700, and Connecticut recorded 59,700 during 2024. These vehicles require specialised fluids for reduction gears, integrated electric drive units, bearings, thermal loops, high-voltage compressors and battery systems. Product requirements include electrical insulation, controlled conductivity, copper compatibility, heat-transfer performance, oxidation stability, foam control and resistance to degradation around polymers and electronic materials. Plug-in hybrids provide an additional opportunity because they retain combustion engines that may operate intermittently, creating moisture accumulation, corrosion, fuel dilution and low-temperature deposit concerns. Lubricant suppliers can develop hybrid-specific engine oils alongside e-transmission fluids and battery coolants, allowing them to serve both transitional and fully electric powertrains. The scale of the US economy, including current-dollar GDP of USD 29.35 trillion during the third quarter of 2024, supports vehicle technology investment and premium-fluid commercialisation. Current EV registrations justify immediate formulation, qualification, installer education and distribution investment without relying on speculative long-term vehicle forecasts.
Re-Refined Lubricants and Closed-Loop Fleet Programs
The large volume of lubricants replaced across nearly 297.526 million registered vehicles creates an opportunity for used-oil collection, re-refining and closed-loop lubricant supply. The Environmental Protection Agency applies the federal used-oil management standards under 40 CFR Part 279 until used oil is disposed of or sent for disposal. These requirements affect quick-lube facilities, service stations, dealerships, repair workshops, fleet garages, transporters, processors and re-refiners. Commercial fleets are particularly suited to closed-loop programs because they generate predictable used-oil volumes from central maintenance locations and can purchase re-refined engine oils, transmission fluids and hydraulic products through bulk contracts. The opportunity is reinforced by extensive vehicle activity: US vehicles travelled 3.294 trillion miles in 2024 and consumed approximately 171.812 billion gallons of fuel, creating substantial routine maintenance activity. Suppliers can combine lubricant delivery, used-oil collection, oil analysis, bulk-tank monitoring, waste documentation and sustainability reporting under multi-year contracts. Re-refined base oils can support passenger-car, heavy-duty and fleet formulations when products meet applicable performance requirements. This model can reduce raw-material exposure, strengthen customer retention and differentiate suppliers through circularity, traceability and regulatory support rather than competing only through packaged-product pricing.
Future Outlook
The USA Automotive Lubricants Market is forecast to expand at approximately ~XX% CAGR during the outlook period. Growth will be driven primarily by premium synthetic conversion, an ageing vehicle parc, high annual mileage, commercial-fleet activity, hybrid ownership, high-mileage formulations, and specialised transmission, coolant, and electric-drive fluids. The market’s product mix will change faster than its physical volume. Longer drain intervals and electric-vehicle adoption will reduce conventional engine-oil consumption per vehicle, but higher-value products will partially offset this pressure. Full-synthetic formulations will gain further adoption because they provide stronger oxidation control, cold-start protection, deposit control, turbocharger protection, and compatibility with modern oil-life systems. API SQ and ILSAC GF-7 will support reformulation and product replacement across passenger-car motor oils. Suppliers will need to manage licensing, testing, packaging transitions, installer training, and retail inventory as older and newer specifications coexist. API’s licensing system establishes requirements for qualification and use of recognised quality marks, making compliance and traceability important competitive capabilities. Heavy-duty lubricants will remain strategically important because combination trucks accumulate substantially higher mileage than most vehicle types. FHWA data indicate average annual travel of approximately 58,890 miles per combination truck, compared with around 11,106 miles per light-duty vehicle in the preceding reporting period. High utilisation supports demand for diesel engine oil, axle fluid, transmission fluid, coolant, chassis grease, oil analysis, and extended-drain programmes.
Major Players
- ExxonMobil
- Shell USA
- Chevron
- BP Lubricants USA
- Valvoline Global Operations
- Phillips 66 Lubricants
- HF Sinclair Lubricants and Specialties
- Fuchs Lubricants
- TotalEnergies Lubricants USA
- Petro-Canada Lubricants
- Amsoil
- Warren Distribution
- Quaker Houghton
- Lubrication Engineers
- Safety-Kleen Systems
Key Target Audience
- Automotive lubricant manufacturers and blenders
- Base-oil refiners and lubricant additive suppliers
- Automotive parts retailers and e-commerce operators
- Quick-lube chains, dealerships and independent workshops
- Passenger, commercial and off-highway fleet operators
- Used-oil collectors, processors and re-refiners
- Investments and venture capitalist firms
- Government and regulatory bodies (US Environmental Protection Agency, Federal Trade Commission, National Highway Traffic Safety Administration, Federal Highway Administration, California Department of Resources Recycling and Recovery and state environmental agencies)
Research Methodology
Step 1: Identification of Key Variables
The initial phase maps base-oil producers, additive suppliers, lubricant blenders, packagers, distributors, retailers, installers, fleets, OEMs, and used-oil processors. Variables include consumption volume, viscosity, specification, package size, vehicle type, drain interval, price, channel margin, synthetic penetration, and vehicle mileage.
Step 2: Market Analysis and Construction
Historical vehicle registrations, vehicle-miles travelled, lubricant shipments, oil-change frequency, fleet utilisation, retail sales, packaged-product pricing, bulk supply, factory-fill demand, service-fill demand, and used-oil collection are compiled. Top-down and bottom-up models are reconciled by product and channel.
Step 3: Supply-Side Assessment
Suppliers are compared by engine-oil portfolio, API licensing, OEM approvals, base-oil access, blending and packaging footprint, distributor network, retail presence, fleet capability, synthetic products, re-refined oils, EV fluids, and technical service.
Step 4: Demand-Side Assessment
Individual motorists, quick-lube operators, dealerships, workshops, trucking fleets, delivery fleets, municipal fleets, construction operators, and agricultural customers are assessed by vehicle mix, annual mileage, lubricant consumption, purchase frequency, package preference, and maintenance strategy.

- Executive Summary
- Research Methodology (Market Definitions and Assumptions, Abbreviations, Automotive Lubricant Market Boundary, Factory-Fill and Service-Fill Assessment, Passenger and Commercial Vehicle Parc Mapping, Lubricant Consumption Modelling, Oil Change Frequency Assessment, Top-Down Analysis, Bottom-Up Analysis, Demand-Side Assessment, Supply-Side Assessment, Blender and Packaging Capacity Mapping, Distributor and Installer Interviews, SKU Price Benchmarking, Data Triangulation, Forecasting Framework, Limitations and Future Conclusions)

- Definition and Scope
- Market Evolution and Industry Genesis
- Timeline of Major Industry Developments
- Evolution from Conventional Mineral Oils to Full-Synthetic Lubricants
- Transition toward Lower-Viscosity Engine Oils

- Growth Drivers (Aging Vehicle Parc, High Vehicle Miles Travelled, Light Truck Dominance, Synthetic Adoption, Commercial Fleet Activity, Extended Vehicle Ownership)
- Market Challenges (Electrification, Extended Drain Intervals, Base Oil Volatility, Private-Label Competition, Specification Complexity, Counterfeit Risk)
- Market Opportunities (EV Fluids, Re-Refined Oil, Premium Synthetics, Fleet Analytics, E-Commerce, Sustainable Packaging)
- Market Trends (Lower Viscosity, Synthetic Conversion, OEM Approvals, Digital Maintenance, Circular Lubricants, Premiumisation)
- Government Regulations and Industry Standards (API EOLCS, ILSAC Specifications, EPA Used-Oil Rules, FTC Labeling, OSHA Handling, State Recycling Requirements)
- SWOT Analysis
- Porter’s Five Forces Analysis
- PESTLE Analysis

- By Market Value (2020-2025)
- By Lubricant Consumption Volume (2020-2025)
- By Factory-Fill Lubricant Volume (2020-2025)

- By Product Type (In Value %)
Passenger Car Motor Oil
Heavy-Duty Diesel Engine Oil
Automatic Transmission Fluid
Manual Transmission Fluid
Continuously Variable Transmission Fluid - By Vehicle Type (In Value %)
Passenger Cars
Sport Utility Vehicles
Crossovers
Pickup Trucks
Vans and Minivans
Light Commercial Vehicles - By Sales Channel (In Value %)
Automotive Parts Retailers
Mass Merchandisers
Warehouse Clubs
Home Improvement Retailers
Convenience Stores and Fuel Stations - By Region (In Value %)
Northeast
Midwest
South
West

- Market Share of Major Players (By Value, Volume, Product Type, Vehicle Type, Distribution Channel)
- Cross Comparison Parameters (API–ILSAC–OEM Approval Portfolio, Passenger Car and Heavy-Duty SKU Breadth, Synthetic and High-Mileage Product Penetration, Quick-Lube–Retail–Distributor–Fleet Channel Reach, Base Oil–Blending–Packaging Integration, Factory-Fill and Service-Fill OEM Relationships, Used-Oil Collection and Re-Refined Lubricant Capability, EV Fluids–Hybrid Oils–Ultra-Low-Viscosity Innovation Readiness)
- SWOT Analysis of Major Players
- Detailed Profiles of Major Companies
ExxonMobil
Shell USA
Chevron
BP Lubricants USA
Valvoline Global Operations
Phillips 66 Lubricants
HF Sinclair Lubricants and Specialties
Quaker Houghton
Fuchs Lubricants
TotalEnergies Lubricants USA
Petro-Canada Lubricants
Amsoil
Lereta and Warren Distribution
Kendall Motor Oil
Lubrication Engineers

- Individual Vehicle Owner Analysis
- DIY Consumer Analysis
- Do-It-for-Me Consumer Analysis
- Passenger Vehicle Fleet Analysis
- Ride-Hailing Fleet Analysis

- By Market Value (2026-2035)
- By Lubricant Consumption Volume (2026-2035)
- By Passenger Car Motor Oil Value (2026-2035)


 Request a Sample
 Ask for Customization
 Get a Quote
 Enquire Now