
 Download PDF
Market Overview
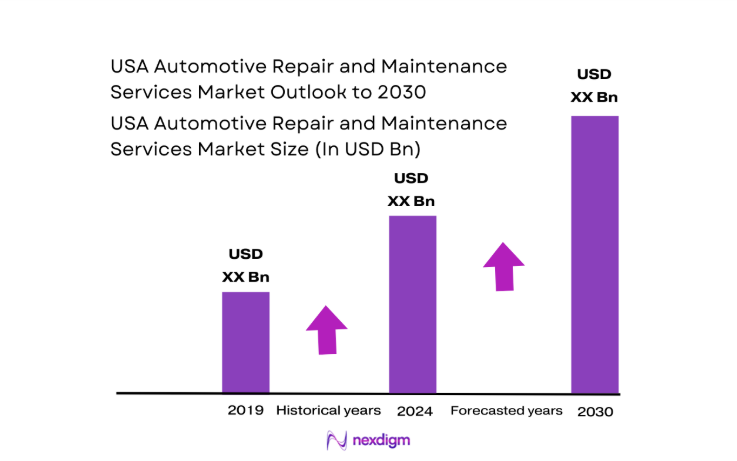
The USA Automotive Repair and Maintenance Services market current size stands at around USD ~ million, reflecting the breadth of routine servicing, mechanical repair, collision restoration, diagnostics, and calibration delivered across independent workshops, franchise chains, and authorized service centers nationwide. Demand intensity is anchored in a large, aging vehicle parc, rising out-of-warranty service needs, and complex electronic architectures requiring specialized equipment and certified technicians. Service ecosystems span parts distribution, tool suppliers, training providers, insurers, and fleet managers.
Service activity is most concentrated in California, Texas, Florida, New York, and Illinois, supported by dense vehicle ownership, logistics corridors, and large fleet operations. Metropolitan areas such as Los Angeles, Dallas–Fort Worth, Miami, New York City, and Chicago anchor advanced diagnostic capabilities and collision networks. Ecosystem maturity is reinforced by strong aftermarket parts distribution, insurer-linked repair networks, and regulatory oversight around safety inspections, emissions compliance, warranty practices, and right-to-repair policies that shape service accessibility and competition dynamics.
Market Segmentation
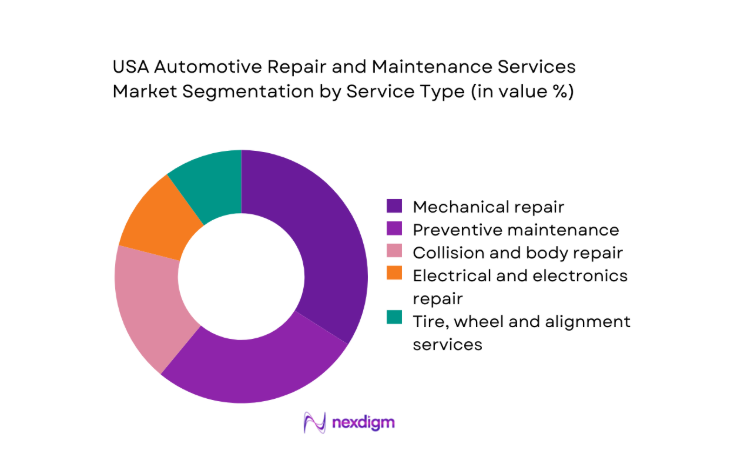
By Service Type
Mechanical repair and preventive maintenance dominate service demand due to high frequency needs such as braking systems, suspension components, powertrain servicing, fluid changes, and routine inspections. Collision and body repair volumes are driven by dense urban traffic, insurance claim workflows, and weather-related incidents, while electrical and electronics repair continues to expand as vehicles integrate advanced driver assistance and connectivity modules. Tire, wheel, and alignment services benefit from predictable replacement cycles and road condition wear. Diagnostics and inspection services increasingly act as entry points for multi-service conversion, supported by standardized inspection protocols and insurer-mandated assessments across regional service networks.
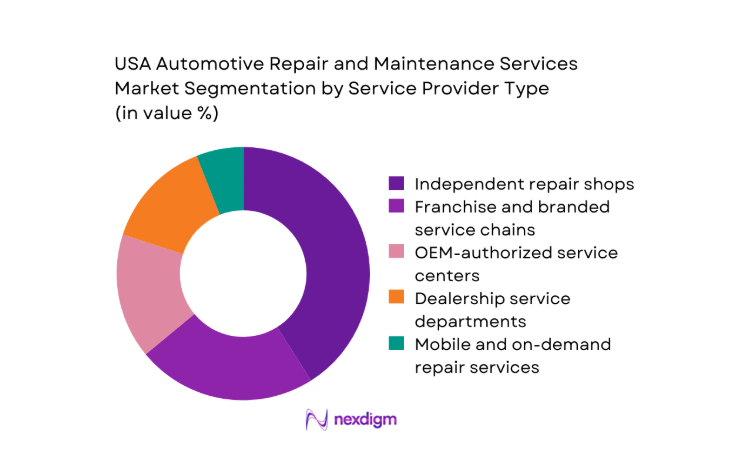
By Service Provider Type
Independent repair shops remain dominant due to neighborhood proximity, price flexibility, and long-standing customer relationships, particularly for routine maintenance and mechanical repairs. Franchise and branded service chains scale standardized service processes, marketing reach, and bundled service offerings, improving throughput in suburban corridors. OEM-authorized service centers retain strength in warranty-linked repairs, software updates, and calibration of advanced systems, while dealership service departments benefit from certified technicians and proprietary tools. Mobile and on-demand repair services are gaining traction in urban settings, supported by convenience expectations, fleet servicing needs, and digital booking platforms that reduce vehicle downtime.
Competitive Landscape
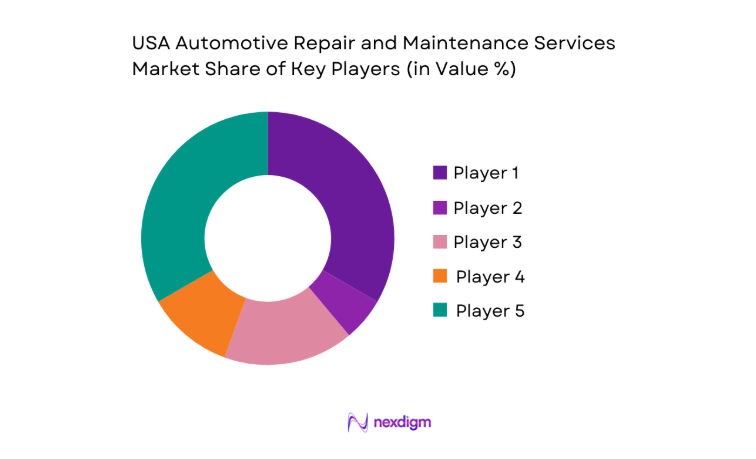
The competitive environment is fragmented, characterized by a mix of national chains, regional networks, and independent operators. Competitive positioning is shaped by service breadth, technician certification depth, access to diagnostic tools, insurer partnerships, and omnichannel booking capabilities, with scale advantages emerging through consolidation and standardized operating models.
| Company Name | Establishment Year | Headquarters | Formulation Depth | Distribution Reach | Regulatory Readiness | Service Capability | Channel Strength | Pricing Flexibility |
| AutoZone | 1979 | Memphis, Tennessee | ~ | ~ | ~ | ~ | ~ | ~ |
| O’Reilly Auto Parts | 1957 | Springfield, Missouri | ~ | ~ | ~ | ~ | ~ | ~ |
| Advance Auto Parts | 1932 | Raleigh, North Carolina | ~ | ~ | ~ | ~ | ~ | ~ |
| Monro, Inc. | 1957 | Rochester, New York | ~ | ~ | ~ | ~ | ~ | ~ |
| Caliber Collision | 1997 | Lewisville, Texas | ~ | ~ | ~ | ~ | ~ | ~ |
USA Automotive Repair and Maintenance Services Market Analysis
Growth Drivers
Rising average vehicle age and out-of-warranty parc
Vehicle longevity continues to reshape service demand as the national vehicle parc ages beyond factory warranty coverage, increasing reliance on aftermarket service networks. Federal Highway Administration records show registered vehicles reached 283000000 in 2023, with average vehicle age exceeding 12 in 2024 according to industry registries. Higher mileage accumulation from logistics and commuter travel accelerates wear on braking systems, suspensions, and drivetrains. State inspection programs logged 147000000 inspections in 2024, highlighting routine service triggers. Warranty expirations after 36000 miles shift maintenance decisions toward independent providers, expanding multi-service visits and diagnostic complexity across metropolitan service corridors nationwide.
Increasing vehicle miles traveled and urban congestion wear
National transportation indicators show vehicle miles traveled surpassed 3300000000000 in 2023, reflecting commuting recovery and freight activity. Urban congestion metrics recorded average delay of 54 hours per commuter in 2024 across major metropolitan regions, intensifying brake, tire, and suspension wear. Freight volumes through interstate corridors exceeded 21000000 daily truck movements in 2024, increasing maintenance cycles for light commercial fleets. State departments of transportation reported pavement condition alerts across 19 corridors, driving alignment and tire replacement frequency. Higher utilization compresses maintenance intervals, elevating workshop throughput and driving demand for quick-service formats near logistics hubs and suburban arterials.
Challenges
Technician shortages and skills gap for advanced electronics
Labor supply constraints persist as vocational program enrollments totaled 142000 trainees in 2023, insufficient against replacement needs for retiring technicians estimated at 92000 positions in 2024. Advanced driver assistance calibration requires certified training hours exceeding 120 per technician, stretching training pipelines. Community college automotive programs reported 17 program closures in 2024 due to equipment funding gaps. Certification bodies issued 38000 electronics credentials in 2024, below service network requirements. Immigration policy adjustments reduced skilled technician inflows by 14000 in 2023. Skills mismatches slow service throughput, extend wait times, and limit adoption of complex diagnostics in regional markets.
High capital costs for diagnostic tools and calibration equipment
Service centers face escalating equipment requirements as vehicles integrate lidar, radar, and camera systems. State safety inspection mandates expanded calibration protocols across 11 states in 2024, increasing compliance burdens. Equipment utilization rates averaged 62 across multi-bay workshops in 2023, indicating underused assets during off-peak periods. Utility grid interconnection approvals for high-load equipment extended installation timelines by 90 days in 2024 in several municipalities. Occupational safety compliance audits increased by 18000 inspections in 2023, necessitating facility upgrades. Capital intensity constrains smaller operators from upgrading bays, widening capability gaps between chains and independents.
Opportunities
EV and ADAS calibration service expansion
Electrified vehicle registrations exceeded 3000000 in 2024, driving demand for high-voltage safety protocols and specialized calibration bays. Federal charging infrastructure programs approved 85000 new chargers by 2024, increasing EV utilization intensity and service touchpoints. State fleet electrification mandates covered 260000 vehicles in 2023, creating predictable maintenance cycles for battery cooling and braking systems. ADAS-equipped models surpassed 140000000 on roads in 2024, raising calibration events after windshield replacements and collision repairs. Certification programs issued 42000 EV safety credentials in 2024, enabling service networks to monetize specialized workflows across urban corridors.
Predictive maintenance enabled by connected vehicle data
Connected vehicle subscriptions reached 96000000 active accounts in 2024, enabling condition-based service scheduling through telematics alerts. Transportation agencies deployed 18000 roadside sensors in 2023, improving incident detection and post-collision service referrals. Fleet telematics platforms tracked 2300000 vehicles in 2024, generating maintenance triggers for oil life, brake wear, and battery health. Municipal open-data initiatives released 1200 datasets in 2024, supporting routing and service proximity optimization. Cybersecurity frameworks issued 14 technical standards updates in 2023, improving data trust. Predictive workflows reduce unplanned downtime, lift bay utilization, and improve parts readiness planning.
Future Outlook
The market is expected to advance through 2030 as electrification, software-defined vehicles, and right-to-repair policies reshape service models. Urban density and fleet electrification will accelerate calibration and high-voltage service demand. Consolidation will improve scale advantages, while digital booking and telematics-driven maintenance will standardize customer journeys. Technician upskilling and equipment access will remain pivotal to service quality and throughput.
Major Players
- AutoZone
- O’Reilly Auto Parts
- Advance Auto Parts
- Genuine Parts Company
- Monro, Inc.
- Bridgestone Retail Operations
- Goodyear Tire & Rubber Company
- Midas
- Meineke Car Care Centers
- Valvoline Instant Oil Change
- Jiffy Lube
- Pep Boys
- Service King Collision Repair
- Gerber Collision & Glass
- Caliber Collision
Key Target Audience
- Independent automotive repair shop owners
- Franchise and branded service chain operators
- Fleet operators and logistics companies
- Insurance companies and claims administrators
- Automotive parts distributors and wholesalers
- Automotive diagnostic and equipment manufacturers
- Investments and venture capital firms
- Government and regulatory bodies with agency names such as the U.S. Department of Transportation and Environmental Protection Agency
Research Methodology
Step 1: Identification of Key Variables
Service categories, provider types, vehicle technologies, technician certification pathways, parts channels, and regulatory touchpoints were mapped to define the operational scope and boundaries. Demand triggers, inspection regimes, and fleet servicing cycles were prioritized to frame measurable indicators.
Step 2: Market Analysis and Construction
Operational workflows, service mix, and channel dynamics were structured into comparable analytical modules. Regional infrastructure maturity, insurer linkages, and parts logistics dependencies were synthesized to construct consistent evaluation lenses.
Step 3: Hypothesis Validation and Expert Consultation
Assumptions on utilization drivers, skills gaps, and calibration demand were stress-tested through structured consultations with workshop operators, trainers, and fleet maintenance leads. Regulatory interpretations were validated against inspection and safety compliance frameworks.
Step 4: Research Synthesis and Final Output
Findings were integrated into cohesive narratives aligning ecosystem dynamics with operational constraints and opportunity pathways. Scenario framing emphasized policy impacts, technology adoption readiness, and service delivery scalability across regions.
- Executive Summary
- Research Methodology (Market Definitions and service scope mapping, Primary interviews with independent garages and franchise service chains, Teardown analysis of service bays and diagnostic tool usage, OEM and aftermarket parts sales channel triangulation, Fleet operator maintenance contract analysis, Telematics and vehicle parc data modeling, Regulatory and warranty policy review)
- Definition and Scope
- Market evolution
- Usage and care pathways
- Ecosystem structure
- Supply chain and channel structure
- Regulatory environment

- Growth Drivers
Rising average vehicle age and out-of-warranty parc
Increasing vehicle miles traveled and urban congestion wear
Growth in advanced driver assistance systems requiring calibration
Expansion of fleet, last-mile delivery and ridesharing vehicles
Insurance-driven collision repair volumes and claim frequency
Rising consumer focus on preventive maintenance and vehicle longevity - Challenges
Technician shortages and skills gap for advanced electronics
High capital costs for diagnostic tools and calibration equipment
Parts supply chain volatility and pricing pressure
Complexity of servicing electric and software-defined vehicles
Margin pressure from price-sensitive consumers
Fragmented market with limited scale for independents - Opportunities
EV and ADAS calibration service expansion
Predictive maintenance enabled by connected vehicle data
Consolidation and roll-up of independent workshops
Growth of mobile repair and convenience services
Subscription-based maintenance plans for consumers and fleets
Partnerships with insurers and fleet operators - Trends
Digitization of service booking and CRM platforms
Increased use of telematics for maintenance scheduling
OEM restrictions and right-to-repair policy shifts
Growth of certified used vehicle reconditioning services
Adoption of remanufactured and sustainable parts
Expansion of quick-service formats in suburban markets - Government Regulations
- SWOT Analysis
- Stakeholder and Ecosystem Analysis
- Porter’s Five Forces Analysis
- Competition Intensity and Ecosystem Mapping
- By Value, 2019–2024
- By Volume, 2019–2024
- By Installed Base, 2019–2024
- By Revenue per Service Order, 2019–2024
- By Service Type (in Value %)
Mechanical repair
Collision and body repair
Preventive maintenance and servicing
Electrical and electronics repair
Tire, wheel and alignment services
Diagnostics and inspection services - By Vehicle Type (in Value %)
Passenger vehicles
Light commercial vehicles
Heavy commercial vehicles
Electric vehicles
Hybrid vehicles - By Service Provider Type (in Value %)
Independent repair shops
Franchise and branded service chains
OEM-authorized service centers
Dealership service departments
Mobile and on-demand repair services - By Channel and Booking Mode (in Value %)
Walk-in and offline booking
Online booking platforms
Subscription and service plans
Fleet and corporate contracts
Insurance-linked repair networks - By Geography (in Value %)
Northeast
Midwest
South
West
- Market structure and competitive positioning
Market share snapshot of major players - Cross Comparison Parameters (service portfolio breadth, geographic footprint, EV and ADAS capability, technician certification depth, parts sourcing strategy, digital booking maturity, fleet contract penetration, pricing transparency)
- SWOT Analysis of Key Players
- Pricing and Commercial Model Benchmarking
- Detailed Profiles of Major Companies
AutoZone
O’Reilly Auto Parts
Advance Auto Parts
Genuine Parts Company
Monro, Inc.
Bridgestone Retail Operations
Goodyear Tire & Rubber Company
Midas
Meineke Car Care Centers
Valvoline Instant Oil Change
Jiffy Lube
Pep Boys
Service King Collision Repair
Gerber Collision & Glass
Caliber Collision
- Demand and utilization drivers
- Procurement and tender dynamics
- Buying criteria and vendor selection
- Budget allocation and financing preferences
- Implementation barriers and risk factors
- Post-purchase service expectations
- By Value, 2025–2030
- By Volume, 2025–2030
- By Installed Base, 2025–2030
- By Revenue per Service Order, 2025–2030


 Request a Sample
 Ask for Customization
 Get a Quote
 Enquire Now