
 Download PDF
 Download PDF
Market Overview
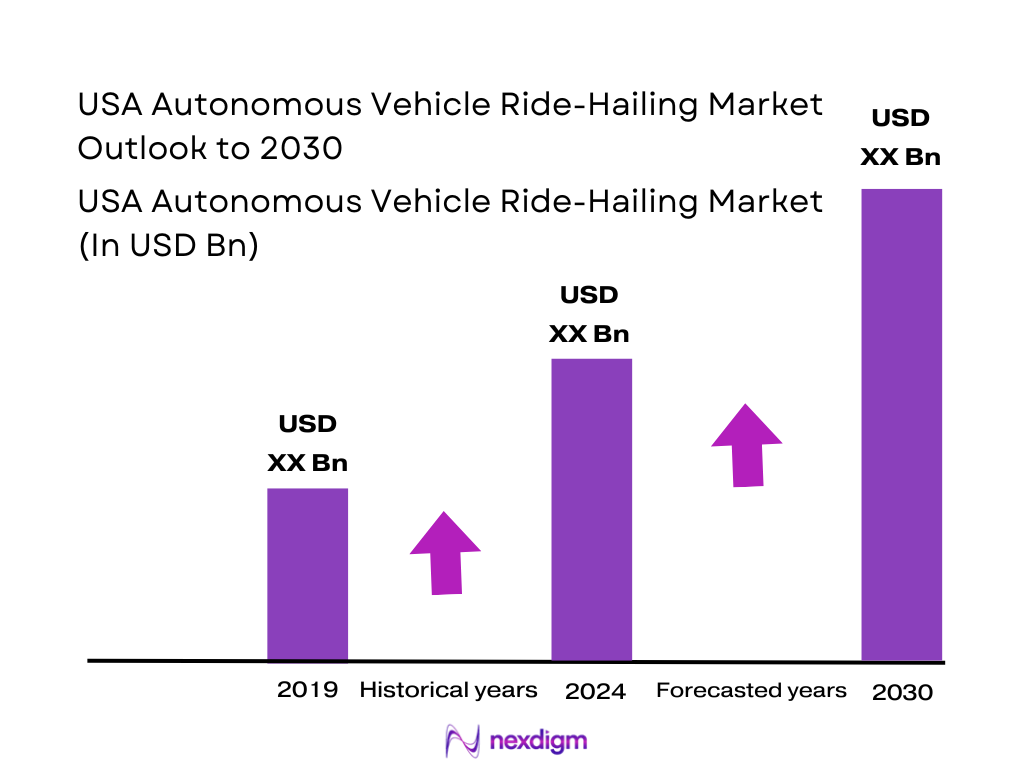
The U.S. autonomous vehicle ride-hailing market is valued at USD ~ billion based on a published industry estimate, with growth supported by city-level deployments and platform integrations that accelerate paid trip volume and consumer access. A key demand catalyst is the expansion of fully driverless ride-hailing availability through major mobility apps and direct operator apps, which improves discovery, reduces friction in onboarding, and increases utilization per vehicle. Commercial scaling remains capex-intensive—illustrated by USD ~ billion in losses reported for a leading U.S. robotaxi developer in the prior year—reinforcing why fleet efficiency and regulatory continuity are central to near-term monetization.
U.S. adoption is concentrated in Phoenix, San Francisco Bay Area, Los Angeles, Austin, and Atlanta, as these metros combine permissive operating environments, dense ride demand, and strong AV testing ecosystems. City and state frameworks supporting geofenced operations, safety case approvals, and structured pilot scaling have created repeatable deployment playbooks. In practice, this is visible in Waymo’s multi-city expansion and its integration with Uber for autonomous ride-hailing in select geographies, while other players such as Zoox have prioritized Las Vegas and San Francisco to validate purpose-built robotaxi operations in high-visibility corridors and controlled service areas.
Market Segmentation
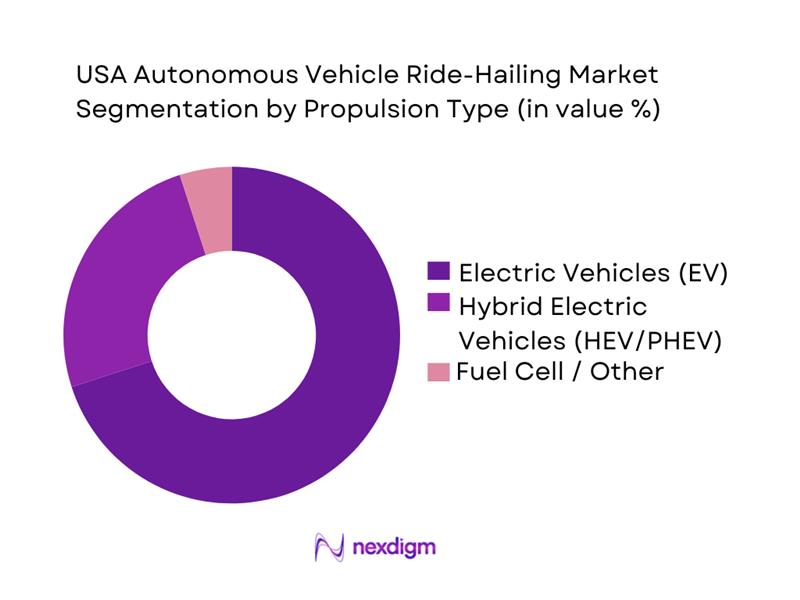
By Propulsion Type
The U.S. autonomous ride-hailing market is segmented by propulsion type into electric vehicles, hybrids, and fuel-cell/other. EVs dominate because robotaxi economics are highly sensitive to cost per mile and vehicle uptime, and EVs are structurally advantaged on energy cost stability, reduced mechanical complexity, and suitability for stop-start urban duty cycles. The U.S. robotaxi commercialization path is also heavily city-centric; urban deployments benefit from expanding charging availability and fleet-operator charging partnerships that support predictable charging windows within geofenced service zones. Additionally, leading operators have standardized around EV platforms to simplify fleet maintenance, remote diagnostics, and standardized parts planning across multi-city operations. EVs are identified as the revenue-leading propulsion type for U.S. robo-taxis, reinforcing that electrification is currently the default architecture for scalable autonomous ride-hailing operations.
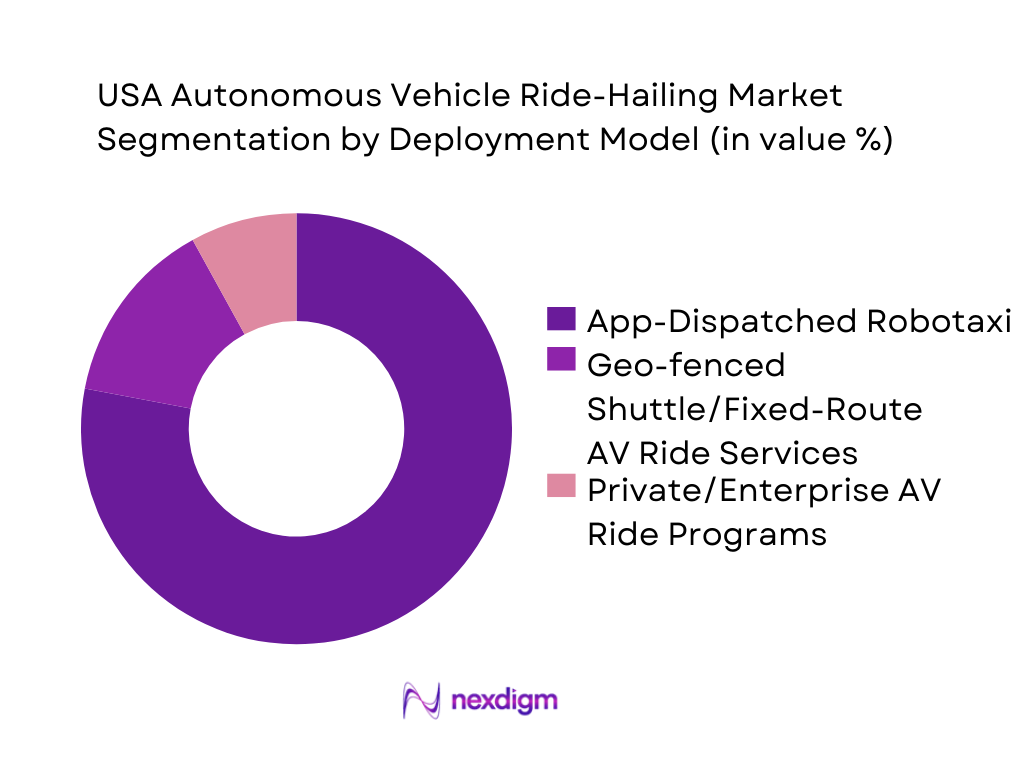
By Service Deployment Model
The U.S. autonomous ride-hailing market can be segmented into app-dispatched on-demand robotaxi, geofenced shuttle/fixed-route AV rides, and private/enterprise programs. App-dispatched robotaxi dominates because it mirrors established ride-hailing behavior (instant booking, dynamic routing, stored payments) and can scale demand quickly once coverage expands. The strongest signal is the acceleration of platform distribution: Uber and Waymo launched autonomous ride-hailing service availability in Atlanta after an earlier rollout in Austin, enabling riders to request autonomous trips through the mainstream Uber workflow rather than a niche pilot process. Waymo’s scale at over ~ rides per week across operating cities shows that on-demand ride-hailing is already generating repeat usage at meaningful volume relative to other AV service formats.
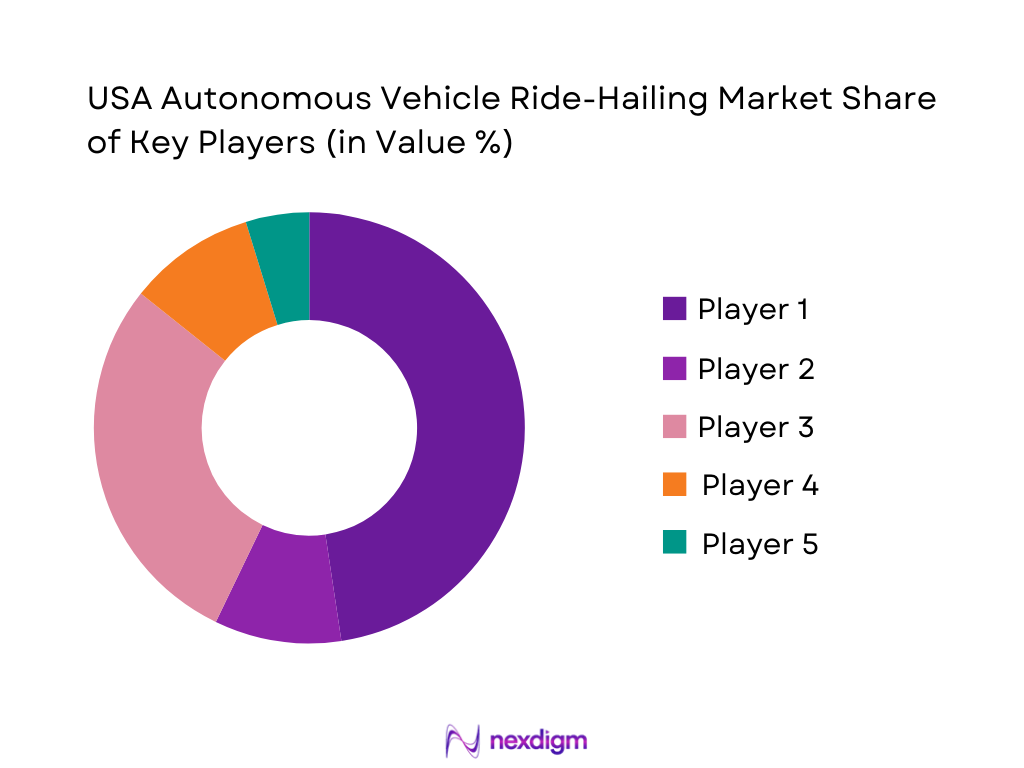
Competitive Landscape
The U.S. autonomous vehicle ride-hailing market is currently shaped by a small number of operators with real-world driverless deployments, alongside large platforms and tech stacks racing toward scalable unit economics. Competitive intensity is defined by regulatory permissions, safety performance, fleet scalability, and city expansion velocity, with consolidation pressures visible as some programs have been paused or de-funded while leaders expand into new metros.
| Company | Established | Headquarters | Operating Cities / Footprint | Service Model | Vehicle Strategy | Autonomy Stack Approach | Safety / Regulatory Posture | Platform / Partnerships |
| Waymo (Alphabet) | 2009 | Mountain View, CA | ~ | ~ | ~ | ~ | ~ | ~ |
| Zoox (Amazon) | 2014 | Foster City, CA | ~ | ~ | ~ | ~ | ~ | ~ |
| Tesla | 2003 | Austin, TX | ~ | ~ | ~ | ~ | ~ | ~ |
| Cruise (General Motors) | 2013 | San Francisco, CA | ~ | ~ | ~ | ~ | ~ | ~ |
| Uber | 2009 | San Francisco, CA | ~ | ~ | ~ | ~ | ~ | ~ |
USA Autonomous Vehicle Ride-Hailing Market Analysis
Growth Drivers
Urban congestion mitigation demand
U.S. road use remains extremely high, creating strong economic and political motivation to scale autonomous ride-hailing where it can substitute single-occupancy trips and reduce stop-and-go driving. Total travel on U.S. roads reached ~ billion vehicle miles in the latest full-year reading, up by ~ billion vehicle miles versus the prior year—an operating environment where even small reliability gains in dense corridors have outsized system impact. At the macro level, the U.S. economy produced USD ~ trillion of output (current dollars), supporting continued spending on mobility services and city-level modernization programs that help enable deployment (curb management, connected signals, lane reconfiguration).
The market pull is strongest in metro regions where travel demand is continuously “peaky,” and where ride-hailing already functions as a complement to rail/bus for first/last mile: robotaxi routing that avoids repeated deadheading and reduces dwell time at curbs becomes economically meaningful when billions of miles are being driven nationally.
Driver supply volatility and labor cost pressure
Autonomous ride-hailing directly addresses a structural constraint in conventional ride-hailing: the system’s capacity expands and contracts with driver availability, which is sensitive to labor market cycles, earnings volatility, and competing job options. The U.S. population base is ~ people, supporting very large urban labor markets and high trip volumes—but also sustaining persistent competition for shift-based work. In transportation and warehousing (a close proxy for broader mobility-labor wage conditions), average hourly earnings were about USD ~, highlighting a labor cost floor that influences platform incentives to pursue automation in high-utilization markets.
At the macro level, large-scale economic activity—again reflected in USD ~ trillion GDP—supports both demand for convenient on-demand travel and the capital formation required to build non-driver capacity. The operational implication for robotaxis is straightforward: in districts with predictable demand spikes (commutes, events, airports), capacity that is not limited by driver log-on behavior becomes a strategic advantage, especially when platforms need consistent supply to hit pickup-time SLAs..
Challenges
Permitting fragmentation and regulatory uncertainty
Autonomous ride-hailing in the U.S. is constrained by a patchwork of state and local permitting, operational requirements, and enforcement approaches. Even within a single leading state, the compliance architecture is multi-layered: California requires distinct permitting and reporting regimes, including public reporting of disengagement and collision events for permitted programs—adding operational governance overhead that varies significantly by jurisdiction. Permit-holder rosters and “approved areas of operation” are managed through state DMV processes, which underscores that expansion is not only an engineering exercise but also a jurisdiction-by-jurisdiction compliance program.
At a national level, NHTSA’s Standing General Order creates an additional compliance layer by requiring reporting of certain crashes involving automated driving systems; while this improves transparency, it also increases legal and operational exposure if incident classification, timeliness, or documentation are inconsistent. Regulatory uncertainty affects fleet planning directly: where rules differ, operators must customize remote assistance protocols, safety driver policies (if applicable), incident response workflows, and even customer UX.
Edge-case safety validation and incident response
Validating “edge cases” (rare, high-risk scenarios) is uniquely difficult because they occur infrequently yet can dominate safety outcomes and public perception. The U.S. safety baseline remains a major motivator but also a benchmark: the annual estimate of ~ traffic fatalities highlights the scale of harm on roads and the scrutiny any safety claims will face. While large-scale testing mileage helps, it does not automatically solve edge-case validation; it must be paired with rigorous incident response, root-cause analysis, and transparent remediation. California’s DMV reporting indicates over ~ miles logged under testing permits in a recent ~-month window, which is meaningful exposure but still a small fraction of total U.S. travel (~ billion vehicle miles), reinforcing why proving safety across all conditions remains challenging.
Nationally, NHTSA’s Standing General Order adds real-world crash reporting requirements for ADS-involved crashes, increasing the regulatory consequences of incidents and creating a paper trail that can rapidly shape policy, litigation, and operational permissions.
Opportunities
Twenty-four-by-seven premium autonomous corridors
Premium ~ autonomous corridors are an attractive growth path because they target the highest-value, highest-reliability use cases first—late-night downtown loops, airport-to-core routes, medical districts, and major entertainment zones—where conventional driver supply thins and pickup times become unreliable. The demand base is visible in national throughput indicators: TSA screened ~ passengers in the latest annual reading, and peak travel days have exceeded ~ screened passengers, creating repeatable arrival waves that benefit fleet-based dispatch and staging. Corridor opportunities also align with the documented scaling of enabling infrastructure: the DOE/NREL Station Locator snapshot recorded ~ EV charging ports in a recent quarterly view, supporting the charging reliability needed for multi-shift EV-first robotaxi operations in dense metros.
ADA-compliant and accessibility-focused robotaxi fleets
Accessibility-focused robotaxi fleets represent a strong growth opportunity because they address a persistent mobility gap with high social value and clear procurement, partnership pathways (health systems, municipalities, airports, paratransit complements). The addressable need is measurable using administrative counts: the Social Security Administration reports disabled workers and dependents receiving disability benefits, with disabled-worker beneficiary counts reported annually (including through ~)—a large population segment that can benefit from more predictable, step-free, assistance-aware mobility options.
From an operational standpoint, autonomy can enable standardized service features (consistent pickup alignment, wheelchair-capable vehicle dispatch, trained remote assistance workflows) that are hard to guarantee in conventional ride-hailing reliant on independent drivers.
Future Outlook
Over the next several years, the U.S. autonomous vehicle ride-hailing market is expected to expand from pilot density to multi-metro scaling, driven by deeper integration into mainstream ride-hailing apps, more consistent city/state operating frameworks, and improving fleet utilization economics. Competitive advantage will increasingly depend on repeatable launch playbooks (mapping → safety case → geofence operations → expansion), the ability to manage edge cases at scale, and trust-building through transparent incident response and safety validation. Expansion announcements by leading operators and new public pilot openings indicate the market is moving from “technology demonstration” toward “service operations,” though profitability and regulatory scrutiny will remain decisive constraints.
Major Players in the Market
- Waymo
- Zoox
- Tesla
- Uber
- Lyft
- Cruise
- Motional
- Aurora Innovation
- May Mobility
- Nuro
- Mobileye
- NVIDIA
- Aptiv
- Luminar
Key Target Audience
- Chief Strategy / Corporate Development Heads
- Product & Partnerships Heads
- Fleet Operations Heads
- Insurance & Risk Underwriting Heads
- OEM & Mobility Program Heads
- Airport Ground Transportation Authorities / Concession Heads
- Investments and venture capitalist firms
- Government and regulatory bodies
Research Methodology
Step 1: Identification of Key Variables
We construct an ecosystem map covering robotaxi operators, ride-hailing platforms, OEM partners, sensor/compute vendors, insurers, and regulators. Desk research compiles public deployment footprints, regulatory status, safety events, and partnership structures to define the variables that drive commercialization.
Step 2: Market Analysis and Construction
We build a market model using published market sizing sources, city-wise deployment activity, and service rollout pathways. We evaluate operational constraints (geofencing, ODD limits), utilization levers (coverage area, hours, dispatch efficiency), and cost structure drivers (fleet capex, remote ops, maintenance).
Step 3: Hypothesis Validation and Expert Consultation
We validate assumptions through structured expert interviews (operators, fleet managers, insurers, mobility platform partners). Discussions focus on unit economics, regulatory bottlenecks, safety operations, rider adoption, and scalability barriers across new metros.
Step 4: Research Synthesis and Final Output
We triangulate insights from operator announcements, credible news, and market sizing publications to finalize segment splits, competitive positioning, and outlook scenarios. Outputs are reviewed for internal consistency across policy, technology readiness, and commercialization pathways.
- Executive Summary
- Research Methodology (Market Definitions and Scope Boundaries, AV/ADS Level Mapping and ODD Framework, Data Triangulation and Market Sizing Approach, Fleet-Based Utilization Modeling, Primary Interviews Across Operators-Fleet Owners-Insurers-Regulators, Regulatory and Permitting Benchmarking, Competitive Intelligence and Partnership Tracking, Assumptions-Limitations-and Sensitivity Testing)
- Definition and Scope
- Autonomous Ride-Hailing Ecosystem Genesis
- Operational Design Domain Landscape
- Industry Value Chain and Responsibility Split
- Business Cycle and Adoption Flywheel

- Growth Drivers
Urban congestion mitigation demand
Driver supply volatility and labor cost pressure
Safety case maturity and autonomous disengagement reduction
Airport and tourism corridor demand
EV-first fleet economics and energy optimization - Challenges
Permitting fragmentation and regulatory uncertainty
Edge-case safety validation and incident response
Public trust, brand risk, and adoption barriers
High fleet capex and downtime sensitivity
Insurance underwriting and liability allocation - Opportunities
Twenty-four-by-seven premium autonomous corridors
ADA-compliant and accessibility-focused robotaxi fleets
B2B shuttle and corporate mobility convergence
Passenger-logistics platform reuse
Smart city and transit authority partnerships - Trends
Remote assistance center scaling
Sensor redundancy and compute optimization
Simulation-led validation and virtual testing
Map-light and AI-native autonomy approaches
Cybersecurity and privacy-by-design frameworks - Regulatory & Policy Landscape
- SWOT Analysis
- Stakeholder & Ecosystem Analysis
- Porter’s Five Forces Analysis
- By Value, 2019–2024
- By Trips and Ride Volume, 2019–2024
- By Revenue per Ride and Take-Rate Structure, 2019–2024
- Installed Base and Active Vehicles in Service, 2019–2024
- Vehicle-Miles Traveled and Utilization, 2019–2024
- By Fleet Type (in Value %)
Operator-Owned Fleets
OEM-Owned Fleets
Platform-Partner Fleets
Leased and Subscription Fleets
- By Application (in Value %)
Airport Transfers
CBD Point-to-Point Mobility
Suburban Connector Routes
Event and Entertainment District Mobility
First and Last Mile Transit Integration
- By Technology Architecture (in Value %)
Fully Driverless Robotaxi Systems
Hybrid Safety-Operator Systems
Remote-Assisted Autonomy Platforms
Simulation-First Autonomy Stacks
- By Connectivity Type (in Value %)
Cellular-Based V2N Connectivity
Multi-Network Redundant Connectivity
Edge-Cloud Hybrid Architectures
Low-Latency Remote Operations Connectivity
- By End-Use Industry (in Value %)
Urban Commuter Transportation
Tourism and Hospitality Mobility
Corporate and Enterprise Mobility
Campus and Institutional Transport
Accessibility and Special Mobility Services
- By Region (in Value %)
West Coast Urban Clusters
Sunbelt Expansion Markets
Midwest and Central Cities
Northeast Dense Metro Areas
Airport-Centric Operating Zones
- Market Share of Major Players
- Cross Comparison Parameters (ODD breadth and weather resilience, regulatory permits and operating authorities, fleet scale and vehicle platform strategy, safety case maturity and incident response capability, remote assistance model and intervention rate, sensor suite redundancy and compute stack, unit economics cost-per-mile drivers, strategic partnerships with ride-hailing platforms and airports)
- Competitive differentiation and moat assessment
- SWOT analysis of major players
- Pricing and monetization benchmarking
- Partnership and ecosystem mapping
- Detailed Company Profiles
Waymo
Zoox
Tesla Robotaxi
Motional
May Mobility
Avride
Nuro
Mobileye
Lyft
Uber
Cruise
Beep
Volkswagen Autonomous Mobility Initiatives
Pony.ai
- Demand hotspots and trip pattern dynamics
- User experience benchmarks and service reliability
- Trust drivers and adoption triggers
- Enterprise and institutional buyer requirements
- Decision-making and procurement processes
- By Value, 2025–2030
- By Trips and Ride Volume, 2025–2030
- By Revenue per Ride and Take-Rate Structure, 2025–2030
- Installed Base and Active Vehicles in Service, 2025–2030
- Vehicle-Miles Traveled and Utilization, 2025–2030


 Request a Sample
 Ask for Customization
 Get a Quote
 Enquire Now