 Download PDF
Market Overview
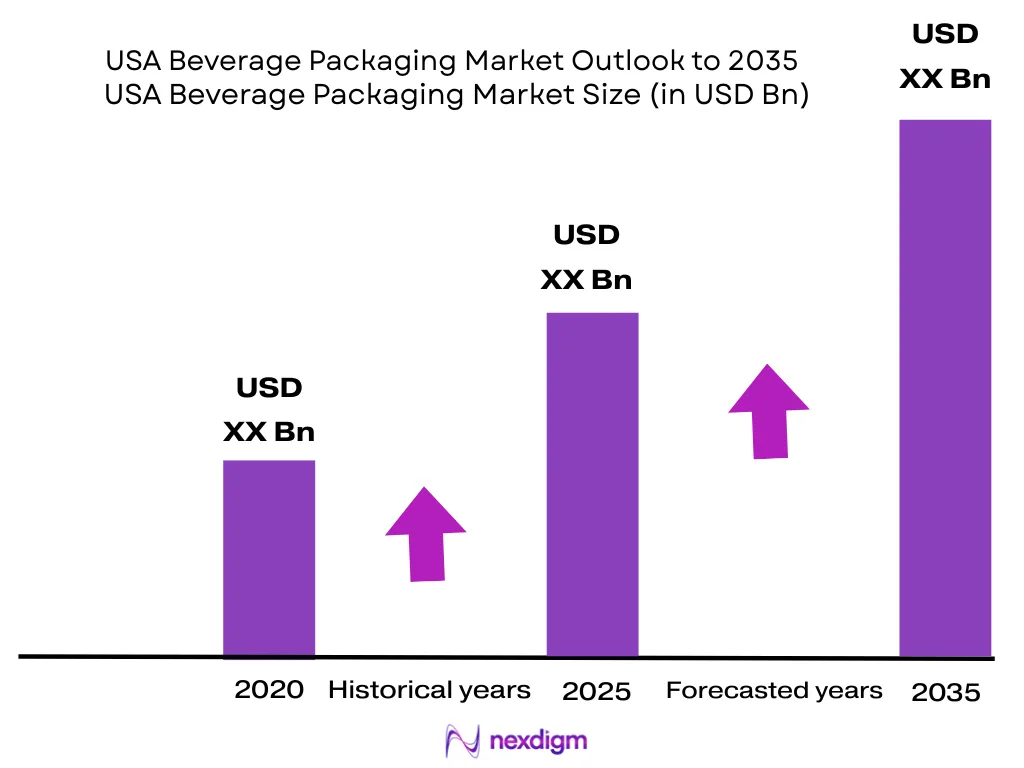
The USA Beverage Packaging Market is valued at approximately USD ~ billion, based on historical container shipments, beverage filling volumes, and packaging-company revenues, and is forecast to expand at a CAGR of % during 2026–2035. The national population increased from 336.8 million to 340.1 million, while current-dollar GDP moved from approximately USD 27.94 trillion to above USD 29 trillion, supporting demand across bottled water, soft drinks, energy drinks, beer, ready-to-drink beverages, dairy, juice, wine, and spirits. California, Texas, Georgia, Pennsylvania, Ohio, Michigan, Illinois, Colorado, New York, and Florida dominate the USA Beverage Packaging Market. California combines major beverage demand, wineries, bottlers, recycling requirements, and an established deposit system. Texas and Georgia support beverage manufacturing and national logistics. Pennsylvania, Ohio, Michigan, and Illinois contain metal, glass, plastics, paperboard, and filling operations. Colorado supports major can suppliers and brewing activity, while New York and Florida provide dense retail, hospitality, and distribution demand.
Market Segmentation
By Packaging Material
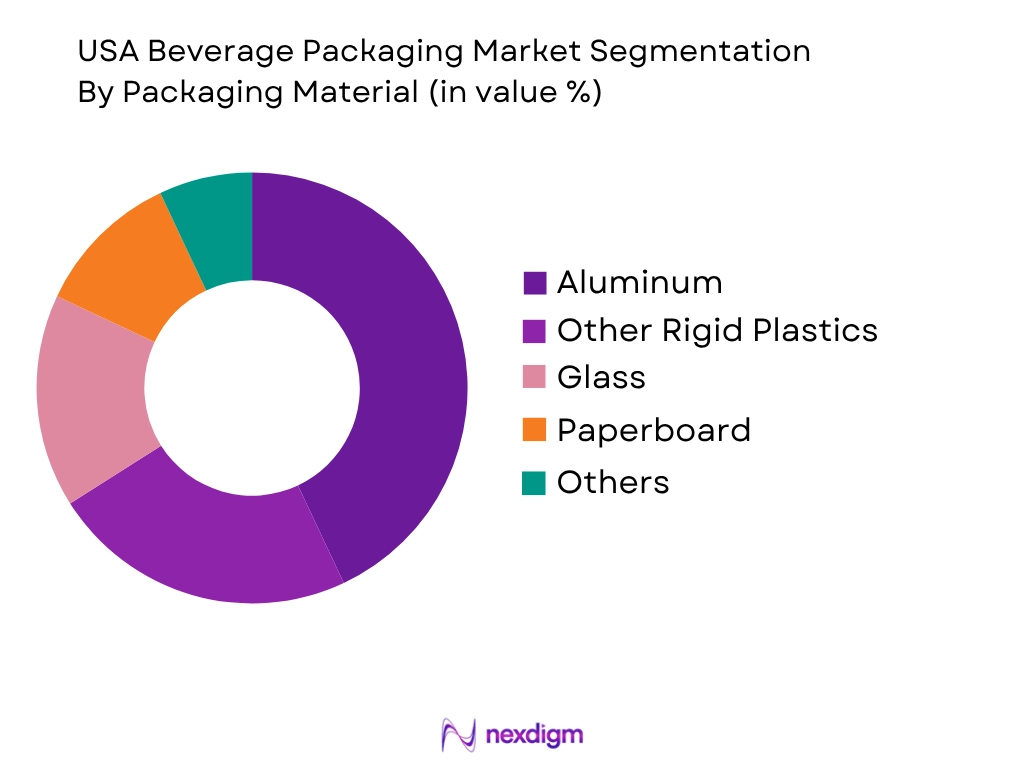
The USA Beverage Packaging Market is segmented into aluminum and steel, PET and other rigid plastics, glass, paperboard beverage cartons, and flexible or composite materials. Metal packaging holds the dominant position because aluminum cans are extensively used for carbonated soft drinks, beer, energy drinks, hard seltzers, sparkling water, ready-to-drink cocktails, and functional beverages. Cans support high-speed filling, efficient palletization, rapid chilling, full-surface decoration, and multiple pack sizes. Crown reported global beverage-can shipments of approximately 82 billion units, while Ball manufactures more than 107 billion recyclable cans annually across its global platform, illustrating the industrial scale supporting this format. PET remains essential for bottled water, carbonated beverages, juices, sports drinks, dairy products, and family-size packs because it combines transparency, resealability, low weight, and broad filling-line compatibility. Glass maintains a strong role in beer, wine, spirits, premium water, and specialty beverages, where product presentation, flavour protection, and returnable-container potential remain important.
By Beverage Category
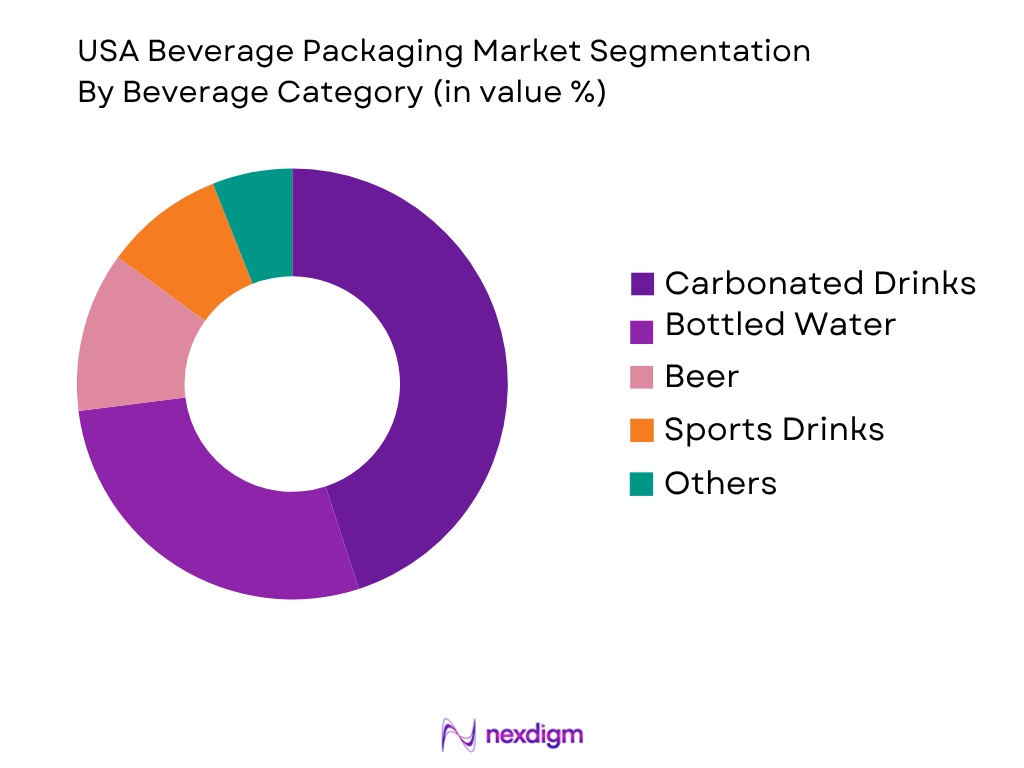
The USA Beverage Packaging Market is segmented into carbonated soft drinks, bottled water, beer and malt beverages, energy and sports drinks, juice and ready-to-drink tea or coffee, dairy and plant-based beverages, wine and spirits, ready-to-drink alcohol, and functional beverages. Carbonated soft drinks hold the dominant position because national beverage companies distribute substantial volumes through supermarkets, convenience stores, restaurants, vending machines, entertainment venues, and foodservice systems. The category uses aluminum cans, single-serve PET bottles, family-size bottles, fountain bag-in-box systems, paperboard multipacks, corrugated cases, labels, and closures. Bottled water also represents a major packaging application because it uses lightweight PET, recycled-content bottles, large refillable containers, glass, cartons, and increasingly aluminum formats. Beer and ready-to-drink alcohol support can demand, while premium wine and spirits sustain decorated glass bottles, specialty closures, labels, and gift cartons. Growth in energy drinks and functional beverages is supporting sleek and slim cans, shot bottles, resealable formats, and digitally printed packaging designed for smaller brands and rapid product launches.
Competitive Landscape
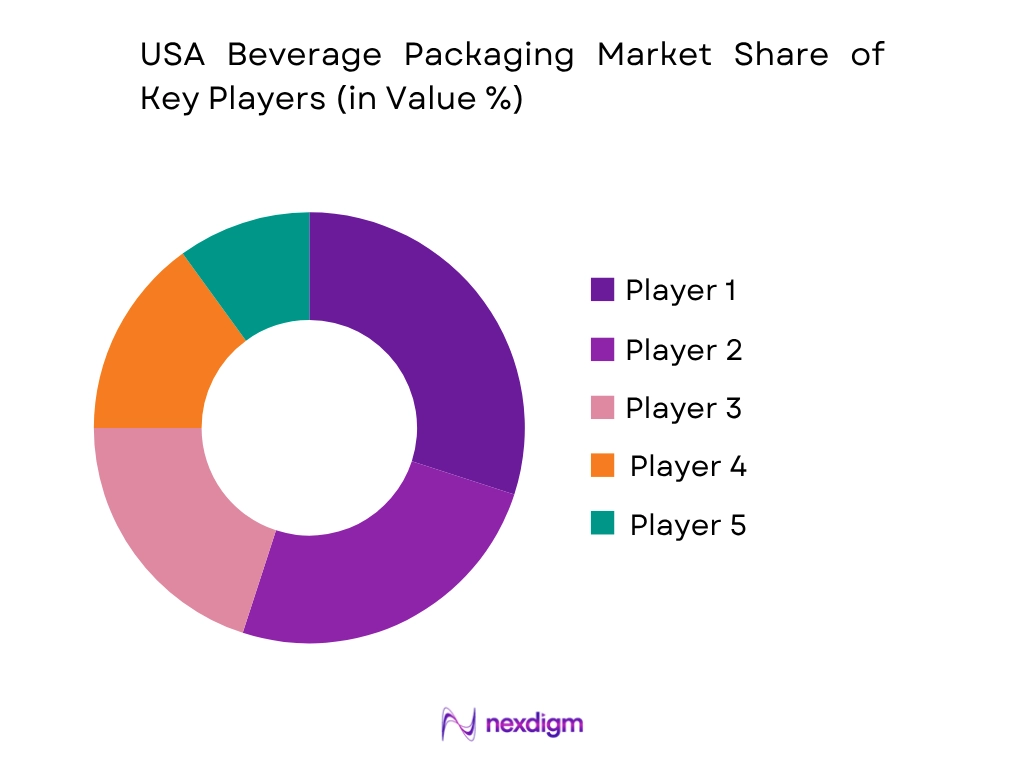
The USA Beverage Packaging Market is concentrated among major metal-can, PET-container, glass-bottle, paperboard-carton, closure, label, and flexible-packaging manufacturers. Ball, Crown, Ardagh Metal Packaging, O-I Glass, and Plastipak maintain significant influence through large manufacturing networks and long-term relationships with beverage fillers. Competition centres on regional capacity, container lightweighting, food-contact safety, recycled-material availability, decoration capability, filling-line performance, deposit-system compliance, and the ability to commercialize new formats quickly.
| Company | Establishment Year | Headquarters | Core Beverage Portfolio | Material Capability | Principal Beverage Applications | U.S. Manufacturing Footprint | Circularity Capability | Strategic Differentiation |
| Ball Corporation | 1880 | Westminster, Colorado | ~ | ~ | ~ | ~ | ~ | ~ |
| Crown Holdings | 1892 | Yardley, Pennsylvania | ~ | ~ | ~ | ~ | ~ | ~ |
| O-I Glass | 1903 | Perrysburg, Ohio | ~ | ~ | ~ | ~ | ~ | ~ |
| Plastipak Packaging | 1967 | Plymouth, Michigan | ~ | ~ | ~ | ~ | ~ | ~ |
| Graphic Packaging International | 1920 | Atlanta, Georgia | ~ | ~ | ~ | ~ | ~ | ~ |
USA Beverage Packaging Market Analysis
Growth Drivers
Large Packaged-Beverage Consumption and Distribution Base
The United States’ large consumer economy supports sustained demand for aluminum cans, PET bottles, glass containers, aseptic cartons, paperboard multipacks, closures, labels, corrugated cases, bag-in-box systems, and reusable beverage transport packaging. The U.S. population reached 340.1 million people in 2024, compared with 336.8 million people in 2023, adding approximately 3.3 million consumers within one year. Current-dollar GDP reached an annualized level of USD 29.35 trillion in the third quarter of 2024, while real GDP expanded by 2.8 points during 2024. These macroeconomic conditions support beverage purchases through supermarkets, warehouse clubs, convenience stores, restaurants, vending machines, stadiums, hotels, airports, direct-to-consumer platforms, and institutional channels. Beverage packaging demand is diversified across carbonated soft drinks, bottled water, beer, energy drinks, ready-to-drink coffee, sports beverages, juice, dairy drinks, plant-based beverages, wine, spirits, hard seltzers, and functional products. Each category requires packaging tailored to carbonation pressure, oxygen exposure, light sensitivity, filling temperature, shelf life, reclosure, portability, and retail presentation. Aluminum cans benefit from high-speed filling, rapid chilling, efficient pallet density, and full-body decoration. PET bottles remain essential for water, soft drinks, sports beverages, and family-size products because they are lightweight, transparent, resealable, and compatible with extensive existing filling infrastructure. Glass remains important for beer, wine, spirits, and premium water, where product presentation and flavour protection influence package selection. The large U.S. population also enables national beverage companies to distribute multiple container sizes, including mini cans, standard single-serve packs, multi-serve bottles, variety packs, club-store cases, and foodservice containers. Population concentration around California, Texas, Florida, New York, Pennsylvania, Illinois, Ohio, Georgia, and other major markets allows packaging manufacturers to position plants near beverage fillers and distribution centres. This proximity reduces empty-container transportation and enables rapid technical support during filling-line trials or package conversions. Growth is therefore driven not merely by population expansion but by the combination of 340.1 million consumers, a USD 29.35 trillion economy, high retail penetration, and a beverage portfolio requiring multiple technically differentiated packaging systems. Sources: U.S. Census Bureau and U.S. Bureau of Economic Analysis.
Recycled-Content Mandates and Beverage-Container Regulation
State recycled-content mandates and deposit-return programs are accelerating packaging redesign, recycled-resin procurement, container registration, and closed-loop recovery partnerships. California requires covered plastic beverage containers to contain an average of at least 25 parts of post-consumer recycled plastic in every 100 parts of plastic from January 2025, increasing from the earlier requirement of 15 parts. Beverage manufacturers that fall below the applicable requirement can face an administrative penalty calculated at USD 0.20 per pound of recycled-content shortfall. This framework creates a direct operational requirement for beverage companies to secure food-grade recycled PET, document virgin and recycled resin use, coordinate with reclaimers, and redesign bottles so that they remain compatible with collection and reprocessing. California also expanded its beverage-container recycling program from January 2024 to include wine, distilled spirits, and premixed cocktails containing at least 7 parts of alcohol in every 100 parts of beverage. The expansion was expected to add approximately 1.1 billion wine and spirit containers to the deposit system each year. Refund values are set at USD 0.05 for eligible containers below 24 ounces, USD 0.10 for containers of 24 ounces or more, and USD 0.25 for eligible boxes, bladders, and pouches used for covered wine and distilled-spirit products. These rules influence glass bottles, PET containers, aluminum cans, cartons, and flexible formats. Manufacturers must evaluate deposit markings, label space, barcode management, state reporting, container material, and redemption compatibility. Regulation also encourages design changes such as clear PET, smaller sleeve coverage, wash-off adhesives, compatible closures, lighter glass, standardized aluminum can formats, and paperboard multipacks that avoid unnecessary mixed materials. National beverage brands face additional complexity because deposit systems, covered beverages, recycling symbols, recycled-content requirements, and extended producer responsibility rules differ between states. A container that complies in California may require separate registration, labelling, reporting, or redemption arrangements in Oregon, Michigan, New York, Maine, Connecticut, Vermont, Iowa, Massachusetts, or Hawaii. This regulatory fragmentation increases demand for packaging-data management, state-level compliance support, material traceability, and supplier documentation. The combination of a 25-part recycled-content requirement, USD 0.20-per-pound penalties, and approximately 1.1 billion newly covered containers demonstrates how state regulation is transforming sustainable packaging from a marketing preference into a measurable procurement, design, and reporting obligation. Sources: California Department of Resources Recycling and Recovery.
Market Challenges
Fragmented Collection Systems and Insufficient Recycling Infrastructure
The USA beverage packaging market is constrained by uneven collection access, differing state deposit systems, contamination in curbside recycling, and insufficient processing capacity for beverage-grade materials. Aluminum cans, PET bottles, glass containers, cartons, closures, labels, and secondary packaging enter a collection system divided among municipal curbside programs, retail redemption points, certified recycling centres, commercial collection contracts, event recovery programs, and deposit-return networks. Rules differ by state and municipality, meaning that the same beverage container may be deposit eligible in one market, curbside recyclable in another, and poorly recovered elsewhere. The U.S. Environmental Protection Agency estimated in 2025 that between USD 36.5 billion and USD 43.4 billion of investment would be required to modernize curbside collection, drop-off systems, material recovery facilities, packaging-specific recycling plants, composting facilities, anaerobic digestion, and related infrastructure. This range shows that discarded packaging volume alone does not guarantee reliable circular feedstock. Materials must be collected, separated, cleaned, processed, and connected to stable end markets. PET bottle bales may contain coloured resin, PVC, labels, closures, adhesives, food residue, moisture, and non-bottle packaging. Glass can be contaminated by ceramics, stones, metals, and mixed colours, while long transport distances can limit glass-to-glass recycling because glass is heavy and has relatively low value per unit of weight. Aluminum cans have strong scrap value, but cans lost to landfill or mixed waste cannot return to can-sheet production. Beverage cartons require hydrapulping facilities capable of separating paper fibers from polymer and aluminum barrier layers. Shrink sleeves, full-body labels, dark pigments, silicone components, multilayer bottles, and incompatible adhesives can also reduce sorting accuracy and recycled-material quality. California demonstrates the advantage of structured recovery but also the scale required: its deposit system had collected 491 billion beverage containers since 1988, including 19.5 billion containers in 2022, while the reported recycling rate before the wine and spirits expansion was 70 parts out of every 100. Replicating high-volume recovery nationwide would require redemption infrastructure, retailer participation, transportation, processing capacity, accurate container registration, and consumer convenience. The infrastructure challenge directly affects beverage manufacturers because recycled-content mandates increase demand for clean food-grade material even when collection systems remain uneven. Bottle manufacturers may have sufficient equipment to use recycled PET but still lack dependable feedstock. Glass furnaces may be capable of using cullet but cannot accept contaminated loads. Can makers depend on recovered aluminum flowing back into can-sheet supply. The EPA’s USD 36.5–43.4 billion infrastructure estimate therefore represents a major structural challenge for closed-loop beverage packaging. Sources: U.S. Environmental Protection Agency and California Department of Resources Recycling and Recovery.
Food-Contact Safety and Filling-Line Conversion Complexity
Beverage packaging must satisfy food-contact safety, mechanical performance, filling-line compatibility, distribution durability, shelf-life protection, and recycling requirements simultaneously. This technical combination creates a substantial barrier to rapid material substitution. A recycled PET bottle intended for water or carbonated beverages requires controlled feedstock, decontamination, extrusion, filtration, solid-state processing, chemistry testing, traceability, and validation for the intended food-contact conditions. The U.S. Food and Drug Administration maintains a formal review process for recycling technologies and publishes favourable opinions for specific post-consumer plastic processes, materials, and conditions of use. A favourable review of one PET or polypropylene process does not automatically authorize every recycled resin, source stream, or beverage application. Producers must demonstrate that contaminants have been reduced to appropriate levels and that the recycled material performs safely under its intended temperature, storage, and product-contact conditions. Technical conversion also affects manufacturing equipment. Switching from virgin PET to higher recycled-content PET can change bottle colour, haze, intrinsic viscosity, preform heating, stretch ratios, top-load performance, and blowing consistency. Lightweighting can reduce resin consumption but may cause panel deformation, cap leakage, poor grip strength, or pallet instability. Changing from a plastic bottle to an aluminum can requires new filling, seaming, inspection, conveyance, and secondary-packaging systems. Glass lightweighting must maintain pressure resistance, impact performance, dimensional accuracy, and compatibility with existing filling lines. Paperboard cartons require specialized forming, sealing, barrier, and aseptic systems. Flexible beverage pouches need reliable spout welding, puncture resistance, seal integrity, and product-compatible barrier layers. The scale of U.S. manufacturing amplifies the consequence of technical failure. Current-dollar GDP reached USD 29.35 trillion in the third quarter of 2024, while total manufactured-goods orders were approximately USD 578.5 billion in December 2024. Beverage operations form part of this high-throughput industrial system, where a container defect can interrupt filling lines, generate product waste, trigger recalls, or damage distribution efficiency. FDA requirements also extend beyond the main container resin to adhesives, coatings, colour additives, inks, closures, liners, and other food-contact components. In 2026, FDA stated that 9 phthalates remained authorized for specified food-contact applications, while colour additives continued to require prior approval for their listed uses. Packaging suppliers must therefore control the entire material structure rather than assess only the bottle, can, or carton body. Sustainable conversion requires packaging engineers, polymer scientists, regulatory specialists, line technicians, quality laboratories, migration expertise, and recycling-design capability. Smaller beverage brands frequently depend on co-packers and packaging suppliers for these services. The principal challenge is ensuring that a package is simultaneously safe, manufacturable, durable, commercially scalable, and realistically recoverable. Sources: U.S. Food and Drug Administration, U.S. Census Bureau, and U.S. Bureau of Economic Analysis.
Market Opportunities
Beverage-Grade Recycled PET and Closed-Loop Bottle Systems
The expansion of state recycled-content requirements creates a significant opportunity for food-grade recycled PET production, deposit-linked bottle collection, automated sorting, digital traceability, and bottle-to-bottle supply agreements. California’s requirement that covered plastic beverage containers contain at least 25 parts of recycled plastic in every 100 parts from January 2025 creates immediate demand for qualified post-consumer resin. The administrative penalty of USD 0.20 per pound of shortfall further strengthens the incentive for beverage companies to secure reliable recycled-material contracts instead of depending entirely on spot availability. California’s deposit program also provides a large container stream, and the inclusion of wine and distilled-spirit packaging from January 2024 was expected to add approximately 1.1 billion containers annually. Although many of those containers are glass, aluminum, cartons, or pouches, the broader system expansion supports collection infrastructure, consumer participation, retailer redemption, and material tracking that can benefit PET recovery. Future growth can be built on present operating data without relying on speculative forecasts. The U.S. population of 340.1 million people creates recurring consumption of bottled water, soft drinks, sports beverages, juice, ready-to-drink tea, dairy drinks, and functional beverages. This large base provides sufficient bottle throughput to support regional sorting and decontamination assets when beverage brands commit to long-term offtake. Technology providers can install near-infrared sorting, artificial-intelligence inspection, robotic separation, label-removal systems, hot washing, melt filtration, solid-state polycondensation, and contaminant testing. Packaging manufacturers can improve recovery yields through clear bottle bodies, compatible polyethylene or polypropylene closures, smaller labels, washable inks, wash-off adhesives, and avoidance of PVC or problematic pigments. Digital platforms can record the manufacturer, resin composition, package weight, collection location, bale supplier, recycler input, pellet output, bottle producer, and final beverage application. The FDA’s public database of favourable opinions for recycled-plastic processes provides a regulatory pathway for companies developing food-contact recycled materials. It identifies the polymer, recycling method, date, and conditions of use associated with each reviewed process. Closed-loop systems can connect beverage brands, retailers, deposit operators, municipal programs, reclaimers, preform manufacturers, bottle blowers, and contract fillers. Regional systems are particularly attractive because transporting empty bottles and lightweight bales across long distances reduces logistics efficiency. Locating reclaimers near high-population beverage markets and filling clusters can improve supply reliability. The opportunity extends beyond compliance: consistent beverage-grade rPET can support transparent bottles, sustainability claims, lower virgin-resin dependence, and stronger material traceability. Current requirements of 25 parts recycled content, a USD 0.20-per-pound penalty, and a national consumer base of 340.1 million people provide a measurable foundation for future bottle-to-bottle investment. Sources: California Department of Resources Recycling and Recovery, U.S. Census Bureau, and U.S. Food and Drug Administration.
Specialty Aluminum Formats, Digital Decoration, and Deposit-Compatible Packaging
The continued diversification of energy drinks, functional beverages, hard seltzers, ready-to-drink cocktails, sparkling water, canned wine, cold-brew coffee, and non-alcoholic products creates an opportunity for specialty aluminum cans, digital printing, shorter production runs, lightweight multipacks, and deposit-compatible container systems. Aluminum cans are suited to these categories because they provide carbonation resistance, complete light protection, rapid chilling, strong pallet density, and a large printable surface. The U.S. population reached 340.1 million people in 2024, while the national economy produced an annualized USD 29.35 trillion in current-dollar output during the third quarter. These figures indicate a consumer and manufacturing base capable of supporting numerous beverage categories, regional brands, limited editions, private labels, seasonal launches, and direct-to-consumer variety packs. Conventional printed cans typically require larger production commitments and longer artwork lead times. Digital printing, shrink sleeving, and pressure-sensitive labelling enable emerging brands and co-packers to launch smaller batches, test regional demand, and revise artwork more quickly. Specialty formats include sleek cans, slim cans, stubby cans, resealable aluminum bottles, aluminum cups, and small shot containers. Each format can be matched to a specific consumption occasion, including convenience retail, gyms, sporting events, hotels, airlines, festivals, bars, and e-commerce subscriptions. Deposit-return expansion provides an additional growth route. California’s program added wine, distilled spirits, and premixed cocktails from January 2024, with approximately 1.1 billion additional containers expected to become eligible each year. Refund values include USD 0.05, USD 0.10, and USD 0.25, depending on container size and format. Packaging suppliers that provide accurate deposit markings, scannable barcodes, material identification, and redemption-compatible designs can support beverage brands entering these categories. Aluminum also has an established closed-loop route because used beverage cans can be sorted, remelted, and returned to can-sheet production. However, future growth requires coordination among can makers, beverage brands, rolling mills, recyclers, deposit operators, and retailers. Secondary packaging presents a related opportunity. Paperboard clip carriers, basket carriers, wraparound cartons, and corrugated trays can replace selected plastic rings or shrink film while maintaining carrying strength and retail presentation. Digital decoration can also reduce obsolete inventory when products or regulations change. The opportunity is therefore broader than selling more standard cans. It includes specialty can manufacturing, small-run decoration, mobile canning, contract filling, container registration, deposit compliance, paperboard multipacks, automated inspection, and recovery partnerships. Current population, GDP, and deposit-program expansion provide the operating base for future investment without requiring speculative market-volume projections. Sources: U.S. Census Bureau, U.S. Bureau of Economic Analysis, and California Department of Resources Recycling and Recovery.
Future Outlook
The USA Beverage Packaging Market is expected to expand through 2035 as beverage diversification, convenience consumption, recycled-content requirements, deposit-return systems, direct-to-consumer distribution, and packaging lightweighting alter container demand. Aluminum cans, food-grade rPET bottles, lightweight glass, paperboard multipacks, aseptic cartons, and specialized flexible formats will remain the principal areas of developmen. Aluminum beverage cans will retain a strong market position because they suit carbonated products, energy drinks, beer, hard seltzers, water, and ready-to-drink cocktails. Suppliers are expanding specialty can geometries, digital printing, direct decoration, textured finishes, and smaller production runs. This is particularly important for emerging beverage brands that require packaging differentiation without committing to the volumes associated with traditional printed-can programs.
Major Players
- Ball Corporation
- Crown Holdings
- Ardagh Metal Packaging
- O-I Glass
- Plastipak Packaging
- Graham Packaging
- Amcor
- Silgan Holdings
- Berry Global
- Graphic Packaging International
- Smurfit Westrock
- Tetra Pak
- SIG
- Closure Systems International
- Sonoco Products Company
Key Target Audience
- Beverage-container and packaging-material manufacturers
- Soft-drink, water, beer, wine, spirits, dairy, juice, and functional-beverage producers
- Contract beverage packagers and filling companies
- Supermarkets, convenience retailers, club stores, and foodservice distributors
- Packaging recyclers, resin reclaimers, deposit-system operators, and material recovery companies
- Investments and venture capitalist firms
- Private-equity and strategic packaging investors
- Government and regulatory bodies
Research Methodology
Step 1: Identification of Key Variables
The initial phase constructs an ecosystem map covering raw-material producers, can manufacturers, bottle and preform companies, glass producers, carton suppliers, closure manufacturers, beverage fillers, co-packers, distributors, retailers, deposit operators, and recyclers. Critical variables include container units, beverage volume, package weight, material type, recycled content, filling technology, pack size, state regulation, and recovery pathway.
Step 2: Market Analysis and Construction
Historical information is compiled by material, container format, beverage category, pack size, closure type, filling process, distribution channel, and region. Bottom-up analysis evaluates plant capacity, shipments, beverage filling volume, package units, material tonnage, and company revenue. Top-down analysis reviews beverage production, population, consumer expenditure, retail sales, packaging imports, and recycling activity.
Step 3: Hypothesis Validation and Expert Consultation
Market hypotheses are validated through computer-assisted telephone interviews with beverage-packaging manufacturers, beverage companies, contract fillers, resin producers, metal suppliers, glass manufacturers, retailers, recyclers, deposit-system participants, and regulatory professionals. Interviews assess capacity utilization, container qualification, recycled-material availability, customer switching, filling-line performance, regulatory exposure, and product-launch activity.
Step 4: Research Synthesis and Final Output
Supply-side and demand-side findings are triangulated to reconcile packaging production, beverage filling, imports, recycled-feedstock supply, and customer procurement. Segment shares and forecasts are tested against unit shipments, container weights, plant expansions, state requirements, beverage-category trends, company disclosures, and primary-industry feedback.

- Executive Summary
- Research Methodology (Market Definitions and Assumptions, Beverage Packaging Inclusion and Exclusion Criteria, Abbreviations, Market Sizing Approach, Top-Down Analysis, Bottom-Up Analysis, Beverage Filling Volume Model, Container Unit Conversion Model, Material Tonnage Assessment, Demand-Side Assessment, Supply-Side Assessment, Packaging Plant Capacity Assessment, Primary Industry Interviews, Data Triangulation, State Regulatory Scenario Modelling, Forecasting Framework, Limitations and Future Conclusions)

- Definition and Scope
- Market Evolution and Industry Genesis
- Evolution of Beverage Container Materials
- Transition from Returnable Glass to Single-Use Packaging
- Expansion of Aluminum Beverage Cans
- Development of PET Beverage Bottles

- Growth Drivers (Single-Serve Beverage Demand, Aluminum Can Adoption, Functional Beverage Launches, Ready-to-Drink Alcohol Growth, Bottled-Water Consumption, Premium Beverage Packaging, E-Commerce and Convenience Retail)
- Market Challenges (Aluminum and Resin Volatility, Glass Freight Intensity, Recycled PET Availability, Filling-Line Conversion Requirements, State Regulatory Fragmentation, Deposit-System Complexity and Flexible-Packaging Recovery)
- Market Opportunities (Food-Grade rPET, Lightweight Glass, Digital Can Printing, Fiber-Based Multipacks, Refillable Beverage Systems, Deposit-Compatible Containers, Smart Closures and High-Barrier Cartons)
- Market Trends (Can Premiumization, Sleek and Slim Formats, Lightweight PET, Recycled Content, Carton Multipacks, Clip-Style Carriers, Direct-to-Consumer Variety Packs, Reusable Kegs and Packaging Carbon Disclosure)
- SWOT Analysis
- Porter’s Five Forces Analysis
- PESTLE Analysis

- By Market Value (2020-2025)
- By Beverage Container Units (2020-2025)
- By Packaged Beverage Volume (2020-2025)

- By Packaging Material (In Value %)
Aluminum
Steel and Tinplate
PET
HDPE
Polypropylene
Glass
Paperboard
Aseptic Carton Material - By Beverage Category (In Value %)
Carbonated Soft Drinks
Bottled Water
Enhanced and Flavoured Water
Energy Drinks
Sports Drinks
Fruit Juices
Juice Drinks and Nectars - By Distribution Channel (In Value %)
Supermarkets and Hypermarkets
Mass Merchandisers
Club Stores and Warehouse Retailers
Convenience Stores
Drugstores and Pharmacies
Liquor Stores
Natural and Specialty Retailers - By Region (In Value %)
Northeast
Midwest
South
West

- Market Share of Major Players
- Cross Comparison Parameters (Beverage Container Material and Format Breadth, Annual Beverage Container and Closure Manufacturing Capacity, U.S. Plant Footprint and Proximity to Filling Clusters, Recycled Content and Closed-Loop Material Capability, Filling-Line Compatibility and High-Speed Technical Support, Beverage Category and Pack-Size Coverage, Deposit-Return and State Regulatory Compliance Support, Lightweighting and New-Format Commercialization Capability)
- SWOT Analysis of Major Players
- Detailed Profiles of Major Companies
Ball Corporation
Crown Holdings
Ardagh Metal Packaging
O-I Glass
Plastipak Packaging
Graham Packaging
Amcor
Silgan Holdings
erry Global
Graphic Packaging International
Smurfit Westrock
Tetra Pak
SIG
Closure Systems International
Sonoco Products Company

- Carbonated Soft Drink Producer Analysis
- Bottled-Water Producer Analysis
- Energy and Sports Drink Producer Analysis
- Juice and Beverage Processor Analysis
- Dairy and Plant-Based Beverage Producer Analysis
- Brewer Analysis

- By Market Value (2026-2035)
- By Beverage Container Units (2026-2035)
- By Packaged Beverage Volume (2026-2035)


 Request a Sample
 Ask for Customization
 Get a Quote
 Enquire Now