
 Download PDF
 Download PDF
Market Overview
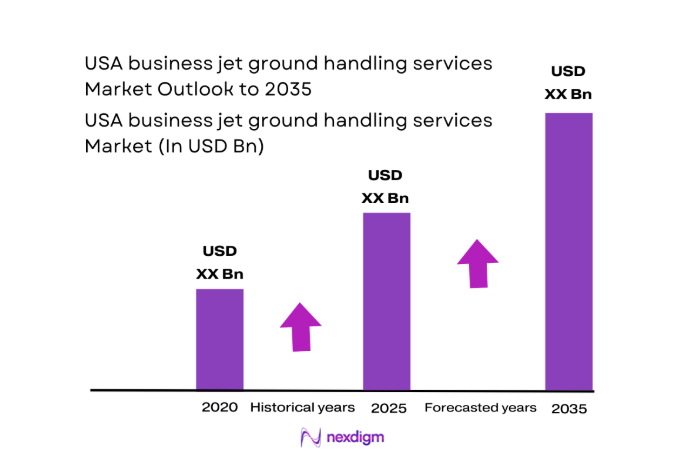
The USA business jet ground handling services market current size stands at around USD ~ million, supported by approximately ~ active business jets and ~ annual flight movements across major hubs. Operational demand intensity increased across ~ airports, with ~ percent concentration in high-density metropolitan corridors. Service utilization frequency averaged ~ turns per aircraft annually, reflecting stable charter and fractional activity levels. Infrastructure investments at ~ locations improved turnaround efficiency, while staffing levels across handlers exceeded ~ personnel nationwide.
The market is dominated by regions with dense corporate headquarters, strong charter networks, and mature airport infrastructure ecosystems. The Northeast and West Coast benefit from high business travel intensity, premium FBO penetration, and policy support for business aviation. Southern hubs show strong demand due to tax-friendly environments and fleet basing preferences. Midwest locations contribute through manufacturing-linked corporate travel and centralized geographic connectivity supporting cross-country operations.
Market Segmentation
By Fleet Type
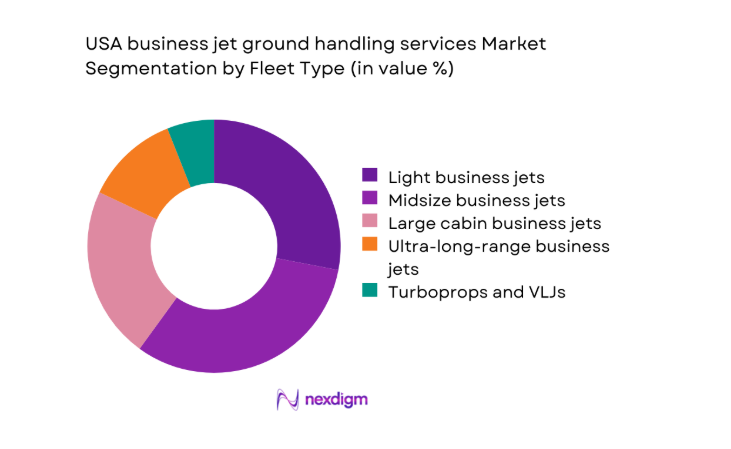
Light and midsize business jets dominate ground handling demand due to higher movement frequency and broader airport accessibility. These fleets typically operate shorter missions with faster turnaround requirements, increasing handling touchpoints per aircraft. Fractional operators heavily deploy midsize fleets, reinforcing consistent service demand across secondary airports. Large and ultra-long-range jets contribute higher service value per visit but lower overall volume. Turboprops and very light jets maintain relevance in regional connectivity and owner-operated missions. Fleet mix stability during 2024 reflects balanced corporate and charter utilization patterns.
By Application
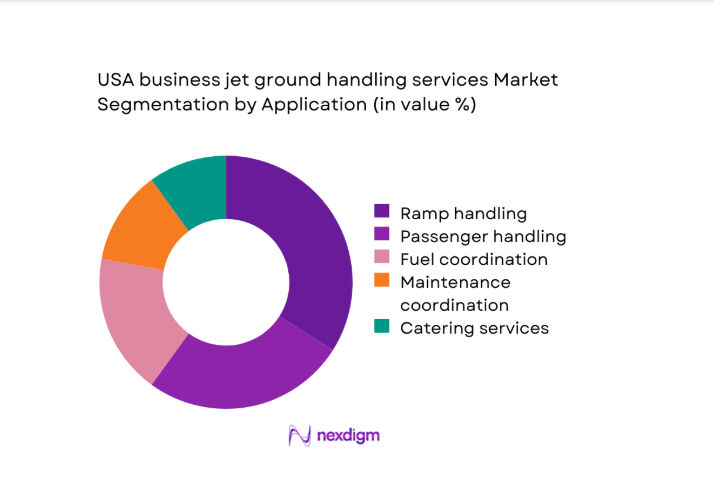
Ramp handling and passenger services account for the largest application share due to mandatory operational requirements per movement. Fuel coordination remains a critical revenue-linked activity tied to flight frequency and aircraft size. Concierge and cabin services gain traction among premium charter and UHNW users seeking differentiated experiences. Maintenance coordination supports operational continuity, particularly for fractional fleets. Catering services show moderate growth linked to longer mission profiles. Application demand patterns in 2024 reflect rising service bundling preferences among operators.
Competitive Landscape
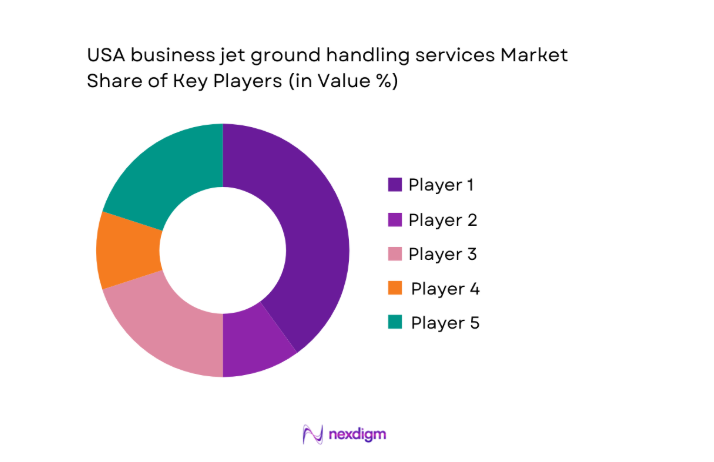
The competitive landscape is moderately consolidated, with large FBO networks coexisting alongside regional and airport-specific operators. Scale, geographic coverage, and service consistency define competitive differentiation, while premium experience and operational reliability remain core positioning factors.
| Company Name | Establishment Year | Headquarters | Formulation Depth | Distribution Reach | Regulatory Readiness | Service Capability | Channel Strength | Pricing Flexibility |
| Signature Aviation | 1927 | United States | ~ | ~ | ~ | ~ | ~ | ~ |
| Atlantic Aviation | 1929 | United States | ~ | ~ | ~ | ~ | ~ | ~ |
| Jet Aviation | 1967 | United States | ~ | ~ | ~ | ~ | ~ | ~ |
| Universal Aviation | 1983 | United States | ~ | ~ | ~ | ~ | ~ | ~ |
| Million Air | 1984 | United States | ~ | ~ | ~ | ~ | ~ | ~ |
USA business jet ground handling services Market Analysis
Growth Drivers
Rising business jet flight activity and fleet utilization
Business jet movements increased steadily during 2024, driven by corporate scheduling flexibility and sustained charter demand across metropolitan airports. Fleet utilization intensity rose as operators optimized asset productivity, increasing ground handling interactions per aircraft movement. Higher dispatch reliability expectations elevated reliance on professional handling services across diverse airport categories. Seasonal traffic peaks intensified ramp and passenger service requirements, particularly at business-centric hubs nationwide. Operational complexity increased as mixed-use airports balanced commercial and business aviation flows simultaneously. Handling providers benefited from predictable service demand tied to repeat charter rotations. Utilization growth supported workforce stabilization across major handling locations. Increased international arrivals required enhanced coordination with customs and security authorities. Flight activity normalization after earlier disruptions reinforced baseline service volumes. Overall utilization trends strengthened recurring service engagement across handler portfolios.
Expansion of fractional ownership and charter operations
Fractional fleet growth during 2025 expanded standardized handling requirements across multiple airports simultaneously. Charter operators increased fleet sizes to meet flexible travel demand from corporate and private clients. Centralized fleet management models emphasized consistent ground service quality nationwide. Contractual service agreements increased volume stability for handling providers. Fractional programs favored airports with established FBO infrastructure and experienced handlers. Charter scheduling density amplified turnaround efficiency expectations. Operator expansion encouraged multi-location service partnerships. Demand diversification reduced reliance on owner-operated flight activity. Fleet expansion supported predictable handling demand across weekday and weekend cycles. These dynamics reinforced long-term service engagement across the ecosystem.
Challenges
High operating and labor costs at premium airports
Premium airports experienced rising labor intensity due to extended operating hours and service customization expectations. Skilled ground staff availability remained constrained during peak travel periods. Wage pressure increased operational strain for independent handlers. Compliance-driven training requirements elevated staffing complexity. Premium facilities demanded higher service standards without proportional efficiency gains. Cost absorption challenged smaller operators with limited scale advantages. Labor scheduling inefficiencies impacted turnaround predictability. Weather disruptions amplified overtime exposure at congested hubs. Cost pressures limited rapid geographic expansion strategies. Sustained cost management became a strategic priority.
Capacity constraints and limited apron space
Apron congestion increased as business jet traffic competed with commercial and cargo operations. Limited parking availability restricted simultaneous handling capacity during peak periods. Slot coordination complexities intensified at coastal metropolitan airports. Infrastructure expansion timelines lagged demand growth patterns. Temporary parking limitations affected charter scheduling reliability. Handling providers faced operational bottlenecks during high-traffic events. Remote parking increased service cycle times and staffing requirements. Ground movement coordination required enhanced airport collaboration mechanisms. Capacity constraints reduced service scalability at high-demand locations. Long-term infrastructure planning became increasingly critical.
Opportunities
Development of premium concierge-led service bundles
Premium travelers increasingly demanded personalized ground experiences beyond core operational handling. Concierge-led services enhanced differentiation for FBO-based operators. Bundled offerings increased service stickiness among repeat charter clients. High-touch passenger services supported premium pricing resilience. Customization opportunities expanded across catering, transport, and hospitality coordination. Operators leveraged concierge teams to strengthen brand loyalty. Service bundling reduced reliance on transactional handling revenue. Demand growth aligned with UHNW traveler expectations. Premium experiences elevated overall airport service perception. These bundles supported long-term client retention strategies.
Digitalization of ground handling coordination and billing
Digital platforms improved coordination between dispatchers, handlers, and flight crews. Automated billing reduced administrative delays and disputes. Real-time service tracking enhanced transparency for operators. Digital scheduling optimized staff allocation during demand fluctuations. Data integration supported performance benchmarking across locations. Technology adoption improved regulatory documentation accuracy. Digital tools reduced manual communication errors. Integrated platforms enabled scalable multi-airport operations. Adoption accelerated among fractional and charter operators. Digitalization strengthened operational resilience across the market.
Future Outlook
The market outlook through 2035 remains positive, supported by stable business aviation demand and service standardization. Infrastructure upgrades and digital adoption will shape competitive positioning. Regional airport development will redistribute handling demand geographically. Sustainability practices may influence future service models. Consolidation is expected to continue selectively.
Major Players
- Signature Aviation
- Atlantic Aviation
- Jet Aviation
- Universal Aviation
- Million Air
- Sheltair Aviation
- Ross Aviation
- Banyan Air Service
- Avflight
- TAC Air
- Wilson Air Center
- Clay Lacy Aviation
- Jet Center
- Menzies Aviation
- Swissport Executive Aviation
Key Target Audience
- Corporate flight departments
- Charter and fractional aircraft operators
- Fixed base operator management groups
- Airport authorities and operators
- Aircraft management companies
- Investments and venture capital firms
- Federal Aviation Administration
- Transportation Security Administration
Research Methodology
Step 1: Identification of Key Variables
Involved identifying key operational variables such as fleet activity, service frequency, and airport infrastructure characteristics across the United States.
Step 2: Market Analysis and Construction
Focused on constructing the market using service-level demand mapping, segmentation logic, and utilization-based modeling.
Step 3: Hypothesis Validation and Expert Consultation
Included hypothesis validation through consultations with airport operators, FBO managers, and fleet operations specialists.
Step 4: Research Synthesis and Final Output
Synthesized findings into a structured outlook, aligning assumptions, trends, and strategic implications.
- Executive Summary
- Research Methodology (Market Definitions and scope alignment for business jet ground handling services, Fleet-based and service-line taxonomy development across FBO and third-party handlers, Bottom-up market sizing using flight movement and service utilization metrics, Revenue attribution by handling package, fuel throughput, and ancillary service mix)
- Definition and Scope
- Market evolution
- Business aviation operating and service pathways
- FBO and third-party handling ecosystem structure
- Service supply chain and airport channel structure
- Regulatory and compliance environment

- Growth Drivers
Rising business jet flight activity and fleet utilization
Expansion of fractional ownership and charter operations
Growth of premium passenger experience expectations
Increasing congestion at major commercial hubs
Corporate focus on time efficiency and privacy
Recovery of business travel post-pandemic - Challenges
High operating and labor costs at premium airports
Capacity constraints and limited apron space
Regulatory compliance complexity across airports
Seasonal and cyclical demand volatility
Intense price competition among FBO operators
Infrastructure limitations at secondary airports - Opportunities
Development of premium concierge-led service bundles
Digitalization of ground handling coordination and billing
Expansion into underserved regional airports
Strategic partnerships with charter and fleet operators
Sustainable ground handling and low-emission GSE adoption
Value-added services beyond core handling - Trends
Consolidation among FBO and ground handling networks
Increased investment in luxury passenger facilities
Adoption of integrated flight support platforms
Focus on sustainability and SAF-related services
Customization of services for UHNW clientele
Rising importance of data-driven service optimization - Government Regulations
- SWOT Analysis
- Stakeholder and Ecosystem Analysis
- Porter’s Five Forces Analysis
- Competition Intensity and Ecosystem Mapping
- By Value, 2020–2025
- By Volume, 2020–2025
- By Installed Base or Active Systems or Platforms, 2020–2025
- By Average Selling Price or Revenue per Test or Unit Economics, 2020–2025
- By Fleet Type (in Value %)
Light business jets
Midsize business jets
Large cabin business jets
Ultra-long-range business jets
Turboprops and very light jets - By Application (in Value %)
Passenger handling and concierge
Ramp handling and ground support
Fueling coordination and supervision
Maintenance coordination
Catering and cabin services - By Technology Architecture (in Value %)
Manual and staff-intensive handling operations
Digitally enabled FBO management platforms
Integrated ground handling and flight support systems - By End-Use Industry (in Value %)
Corporate flight departments
Charter and fractional operators
Ultra-high-net-worth individuals
Government and special mission operators - By Connectivity Type (in Value %)
Standalone airport-based handling
Networked multi-airport FBO platforms
Integrated global flight support networks - By Region (in Value %)
Northeast
Southeast
Midwest
Southwest
West Coast
- Market structure and competitive positioning
Market share snapshot of major players - Cross Comparison Parameters (Service portfolio breadth, Geographic airport coverage, Fleet handling capability, Pricing and contract flexibility, Customer experience quality, Digital service integration, Sustainability initiatives, Brand reputation)
- SWOT Analysis of Key Players
- Pricing and Commercial Model Benchmarking
- Detailed Profiles of Major Companies
Signature Aviation
Atlantic Aviation
Jet Aviation
Universal Aviation
Menzies Aviation
Swissport Executive Aviation
Ross Aviation
Million Air
Sheltair Aviation
Clay Lacy Aviation
Banyan Air Service
Avflight
TAC Air
Jet Center
Wilson Air Center
- Demand and utilization drivers
- Procurement and airport contract dynamics
- Buying criteria and handler selection process
- Budget allocation and cost-control preferences
- Operational and regulatory risk considerations
- Post-service quality and reliability expectations
- By Value, 2026–2035
- By Volume, 2026–2035
- By Installed Base or Active Systems or Platforms, 2026–2035
- By Average Selling Price or Revenue per Test or Unit Economics, 2026–2035


 Request a Sample
 Ask for Customization
 Get a Quote
 Enquire Now