
 Download PDF
 Download PDF
Market Overview
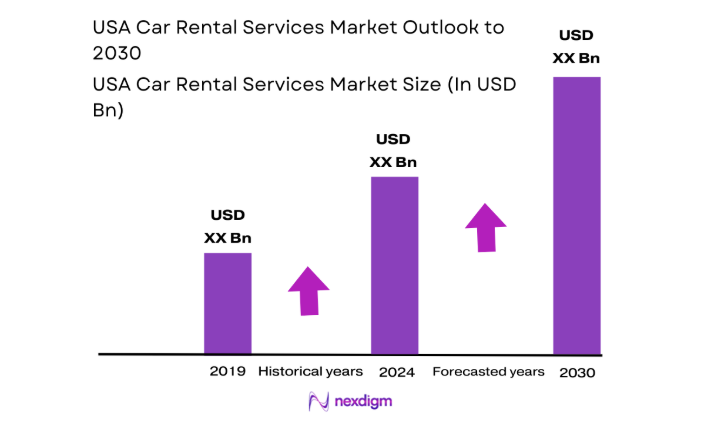
The USA Car Rental Services market current size stands at around USD ~ million, reflecting sustained demand for short-term mobility solutions across leisure, business travel, insurance replacement, and flexible workforce needs. Service penetration is supported by dense airport networks, high vehicle turnover cycles, and technology-enabled booking platforms. Fleet availability, branch density, and omnichannel access shape service accessibility, while operational scale underpins service consistency. Commercial partnerships and enterprise contracts further stabilize demand across diverse trip purposes and customer cohorts.
Demand concentration is highest in major air travel gateways and dense metropolitan corridors where multimodal connectivity supports short-duration rentals. Airport-linked clusters in coastal and Sun Belt metros benefit from tourism flows and convention traffic, while suburban nodes serve insurance replacement and temporary mobility needs. Mature ecosystems feature integrated fleet logistics, remarketing pipelines, and digital customer journeys. Policy environments favor standardized consumer protections, transparent pricing disclosures, and safety compliance, reinforcing trust and enabling sustained operational expansion across high-throughput locations.
Market Segmentation
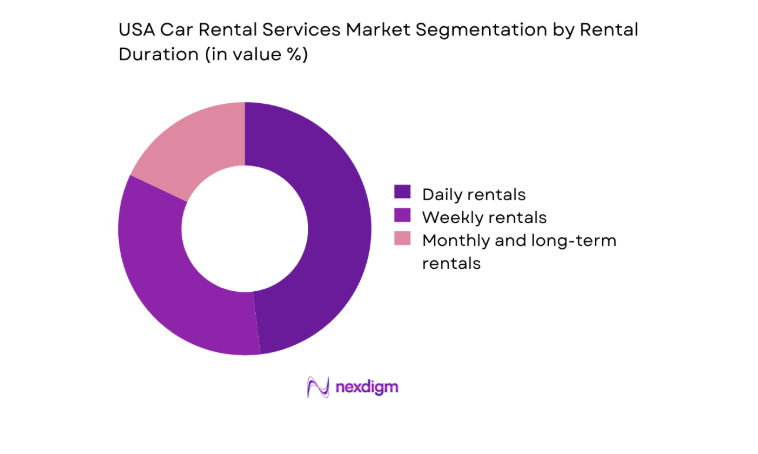
By Rental Duration
Short-duration rentals dominate due to high frequency leisure trips, project-based business travel, and insurance replacement cycles that prioritize flexible daily and weekly contracts. Operationally, daily and weekly tenures optimize fleet turns, raise utilization intensity, and align with airport-centric demand surges tied to flight schedules and event calendars. Monthly rentals remain relevant for extended assignments and transitional mobility needs, yet face substitution from subscriptions and ride-hailing. Branch networks increasingly tailor inventory mixes to peak travel windows, while dynamic pricing steers customers toward shorter tenures during capacity constraints, reinforcing short-duration dominance.
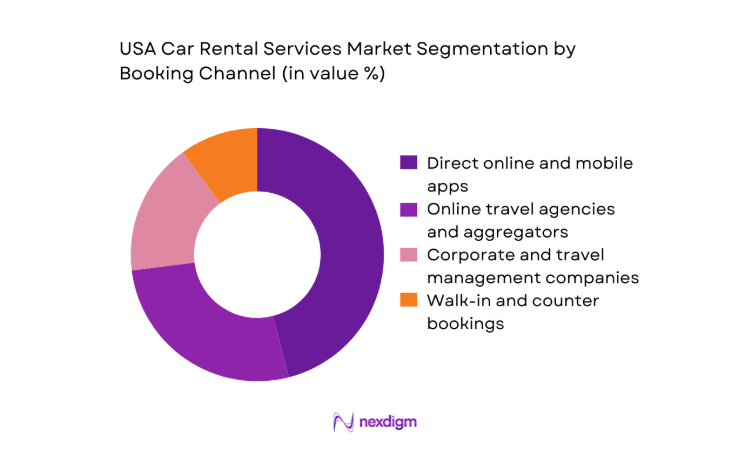
By Booking Channel
Direct digital channels lead as mobile-first journeys simplify reservations, identity verification, and contactless pickup, reducing friction at high-traffic nodes. Aggregators expand discovery for leisure travelers, but margin pressures incentivize operators to convert users to owned apps through loyalty and bundled add-ons. Corporate travel managers maintain negotiated portals for policy-compliant bookings, supporting predictable weekday demand. Counter walk-ins persist at smaller airports and neighborhood branches for insurance replacements and last-minute needs. Channel orchestration aligns marketing spend with conversion efficiency, while personalization and loyalty benefits accelerate migration toward direct bookings.
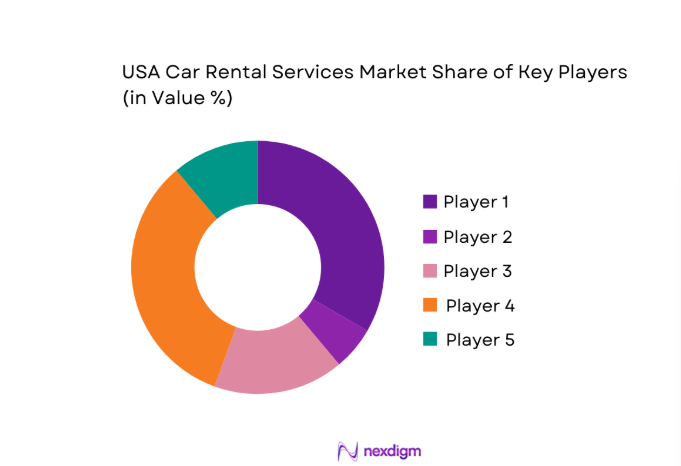
Competitive Landscape
The competitive environment features national scale operators with dense airport footprints and technology-enabled networks, complemented by regional specialists and peer-to-peer platforms. Differentiation centers on fleet breadth, digital experience, service reliability, and partnerships with airlines, insurers, and travel platforms.
| Company Name | Establishment Year | Headquarters | Formulation Depth | Distribution Reach | Regulatory Readiness | Service Capability | Channel Strength | Pricing Flexibility |
| Enterprise Holdings | 1957 | St. Louis, MO | ~ | ~ | ~ | ~ | ~ | ~ |
| Hertz Global Holdings | 1918 | Estero, FL | ~ | ~ | ~ | ~ | ~ | ~ |
| Avis Budget Group | 1946 | Parsippany, NJ | ~ | ~ | ~ | ~ | ~ | ~ |
| Sixt SE | 1912 | Pullach, Germany | ~ | ~ | ~ | ~ | ~ | ~ |
| Turo | 2009 | San Francisco, CA | ~ | ~ | ~ | ~ | ~ | ~ |
USA Car Rental Services Market Analysis
Growth Drivers
Rising domestic air travel and tourism recovery
U.S. air passenger throughput reached 840000000 in 2023, up from 780000000 in 2022, reflecting sustained leisure and business mobility. The Federal Aviation Administration recorded 16000 daily commercial flights in 2024, improving seat availability across hub airports that anchor rental demand. Hotel room nights in major gateways increased to 670000000 in 2024, reinforcing airport-linked rentals for short stays. Interstate highway vehicle miles traveled surpassed 3300000000000 in 2023, supporting off-airport branches near logistics corridors. Convention bookings rebounded across 25 primary metros in 2024, lifting weekday utilization. These indicators underpin consistent rental frequency without implying market size.
Growth in short-term mobility needs for urban and suburban travel
Urban employment centers recorded 120000000 daily commutes in 2024, with hybrid work elevating ad hoc mobility needs for project travel and temporary assignments. Suburban household vehicle replacement cycles tightened after 2022 supply constraints, raising interim rental reliance during maintenance events exceeding 11000000 service visits in 2024 across national service chains. Municipal curb management programs expanded across 45 cities in 2023, improving pickup access near transit hubs. Transit agencies reported 9400000000 unlinked passenger trips in 2023, amplifying first and last mile rentals near stations. These dynamics sustain short-duration demand across neighborhood branches and transit-adjacent locations.
Challenges
High fleet acquisition and financing costs amid volatile interest rates
Auto loan rates averaged 7 in 2023 and 8 in 2024, raising capital pressure on fleet refresh cycles. New vehicle production in North America reached 15700000 units in 2024, yet dealer inventories remained uneven across segments, constraining procurement timing. Used vehicle wholesale indices remained elevated through 2023, increasing remarketing risk at de-fleet intervals. Fleet maintenance visits exceeded 48000000 in 2024 across national service networks, intensifying downtime management. State-level titling backlogs in 12 jurisdictions extended vehicle onboarding by 14 days on average in 2023, reducing utilization windows and complicating seasonal capacity planning.
Used vehicle price volatility impacting fleet residual values
Wholesale auction volumes rose to 7400000 transactions in 2023, while monthly price indices fluctuated across 9 months, complicating depreciation planning. Repair severity rose with average claim parts counts reaching 12 in 2024, extending turn times for de-fleeted units. Logistics bottlenecks at 6 major ports in 2022–2023 delayed remarketing flows into secondary markets. State emissions inspection updates in 2024 across 5 states increased reconditioning requirements, adding processing steps before resale. These institutional and operational frictions elevate residual uncertainty and lengthen cash recovery cycles without referencing revenue or pricing outcomes.
Opportunities
Electrification of fleets supported by federal and state incentives
Public charging connectors exceeded 180000 in 2024, up from 140000 in 2023, improving network reliability near airports and urban cores. Federal programs funded 7500 corridor miles for charging deployment, expanding coverage along interstate routes used by renters. EV model availability increased with 28 new light-vehicle models introduced across 2022–2024, broadening fleet fit for leisure and corporate use cases. Utility time-of-use programs enrolled 120000 fleet charging points in 2024, enabling load management. Municipal zero-emission procurement mandates in 9 states created pilot demand at government-linked locations, supporting scalable fleet electrification pathways.
Partnerships with airlines, hotels, and mobility platforms
Airline loyalty ecosystems surpassed 200000000 enrolled members in 2024, enabling bundled mobility offers at booking. Hotel property management systems integrated with 42000 properties nationwide in 2023, improving cross-sell at check-in and digital confirmations. Travel super-app monthly active users exceeded 65000000 in 2024, creating discovery channels for rentals bundled with flights and stays. Airport concession programs expanded digital wayfinding across 31 hubs in 2023, streamlining curbside flows for partners. Data interoperability standards adopted by 14 major platforms in 2024 improve identity verification and pickup efficiency, lifting conversion across integrated journeys.
Future Outlook
Over the next several years, the sector will align fleet strategies with electrification pilots, airport digitization, and integrated travel ecosystems. Policy support for charging corridors and consumer protections will shape operating models, while channel shifts toward direct digital journeys continue. Secondary city expansion and transit-adjacent nodes will diversify demand. Partnerships across airlines, hotels, and insurers will deepen bundled mobility experiences, reinforcing utilization stability through seasonal cycles.
Major Players
- Enterprise Holdings
- Hertz Global Holdings
- Avis Budget Group
- National Car Rental
- Alamo Rent A Car
- Dollar Rent A Car
- Thrifty Car Rental
- Sixt SE
- Fox Rent A Car
- Advantage Rent A Car
- Payless Car Rental
- Silvercar
- Turo
- Zipcar
- Getaround
Key Target Audience
- Corporate travel managers and procurement teams
- Airline partners and airport concession authorities
- Hotel chains and hospitality groups
- Insurance carriers and claims administrators
- Fleet leasing and vehicle remarketing partners
- Mobility platform operators and travel marketplaces
- Investments and venture capital firms
- Government and regulatory bodies with agency names including the U.S. Department of Transportation and state Departments of Motor Vehicles
Research Methodology
Step 1: Identification of Key Variables
Key variables included fleet composition by powertrain, airport versus off-airport branch density, booking channel mix, utilization cycles, and operational readiness indicators. Data points were mapped to institutional transport metrics, travel infrastructure capacity, and regulatory compliance requirements. The scope aligned with service pathways and ecosystem dependencies across hubs and neighborhood nodes.
Step 2: Market Analysis and Construction
Analytical constructs integrated transport throughput indicators, charging network coverage, and municipal mobility policies. Demand drivers were triangulated using aviation activity, transit ridership, and highway usage metrics. Operational constraints were assessed through fleet lifecycle signals, titling workflows, and reconditioning frictions observed across jurisdictions.
Step 3: Hypothesis Validation and Expert Consultation
Hypotheses on channel migration, electrification feasibility, and airport digitization impacts were validated through expert consultations with operations leaders, infrastructure planners, and mobility platform architects. Feedback refined assumptions around curbside management, charging reliability, and identity verification workflows affecting pickup efficiency.
Step 4: Research Synthesis and Final Output
Findings were synthesized into scenario pathways linking policy support, infrastructure readiness, and ecosystem partnerships to operational outcomes. Cross-checks ensured alignment with institutional indicators and current operating conditions. Insights were structured to guide strategic prioritization across fleet strategy, channels, and partnerships.
- Executive Summary
- Research Methodology (Market Definitions and service taxonomy for short-term vehicle rentals, Fleet inventory audits and utilization rate benchmarking across rental operators, Primary interviews with airport and off-airport branch managers and fleet procurement heads, Transaction-level rental rate scraping and channel mix analysis across online travel agencies and direct apps, Telematics and fleet lifecycle cost modeling including depreciation and maintenance)
- Definition and Scope
- Market evolution
- Usage and customer journey pathways
- Ecosystem structure
- Channel and distribution structure
- Regulatory and compliance environment

- Growth Drivers
Rising domestic air travel and tourism recovery
Growth in short-term mobility needs for urban and suburban travel
Corporate travel rebound and project-based workforce mobility
Insurance replacement demand from accident repair cycles
Expanding app-based booking and contactless rental experiences
Fleet refresh cycles improving vehicle availability and customer satisfaction - Challenges
High fleet acquisition and financing costs amid volatile interest rates
Used vehicle price volatility impacting fleet residual values
Labor shortages at airport and branch operations
Rising insurance, maintenance, and damage recovery costs
Demand seasonality causing fleet utilization inefficiencies
Pressure on margins from price comparison platforms and discounting - Opportunities
Electrification of fleets supported by federal and state incentives
Partnerships with airlines, hotels, and mobility platforms
Subscription-based and flexible long-term rental products
Data-driven dynamic pricing and demand forecasting
Expansion in secondary cities and suburban mobility hubs
Ancillary revenue growth from protection plans and add-on services - Trends
Contactless pickup and digital key adoption
Integration with super-apps and travel platforms
Shift toward SUVs and crossovers in leisure travel
EV pilot programs at major airports and urban hubs
Telematics-enabled fleet management and damage detection
Bundled mobility offerings with insurance and roadside assistance - Government Regulations
- SWOT Analysis
- Stakeholder and Ecosystem Analysis
- Porter’s Five Forces Analysis
- Competition Intensity and Ecosystem Mapping
- By Value, 2019–2024
- By Volume, 2019–2024
- By Active Systems, 2019–2024
- By Revenue per Rental Day, 2019–2024
- By Rental Duration (in Value %)
Daily rentals
Weekly rentals
Monthly and long-term rentals - By Booking Channel (in Value %)
Direct online and mobile apps
Online travel agencies and aggregators
Corporate and travel management companies
Walk-in and counter bookings - By Location Type (in Value %)
Airport locations
Off-airport urban locations
Suburban and neighborhood branches - By Vehicle Type (in Value %)
Economy and compact cars
Midsize and full-size cars
SUVs and crossovers
Luxury and premium vehicles
Vans and specialty vehicles - By Customer Type (in Value %)
Leisure travelers
Business travelers
Corporate and government accounts
Ride-hailing and gig economy drivers
Insurance replacement customers - By Powertrain (in Value %)
Internal combustion engine vehicles
Hybrid vehicles
Battery electric vehicles
- Market structure and competitive positioning
Market share snapshot of major players - Cross Comparison Parameters (fleet size, airport footprint, average daily rate, digital booking penetration, EV fleet share, utilization rate, customer satisfaction score, ancillary revenue per rental)
- SWOT Analysis of Key Players
- Pricing and Commercial Model Benchmarking
- Detailed Profiles of Major Companies
Enterprise Holdings
Hertz Global Holdings
Avis Budget Group
National Car Rental
Alamo Rent A Car
Dollar Rent A Car
Thrifty Car Rental
Sixt SE
Fox Rent A Car
Advantage Rent A Car
Payless Car Rental
Silvercar
Turo
Zipcar
Getaround
- Demand and utilization drivers
- Procurement and tender dynamics
- Buying criteria and vendor selection
- Budget allocation and financing preferences
- Implementation barriers and risk factors
- Post-purchase service expectations
- By Value, 2025–2030
- By Volume, 2025–2030
- By Active Systems, 2025–2030
- By Revenue per Rental Day, 2025–2030


 Request a Sample
 Ask for Customization
 Get a Quote
 Enquire Now