
 Download PDF
 Download PDF
Market Overview
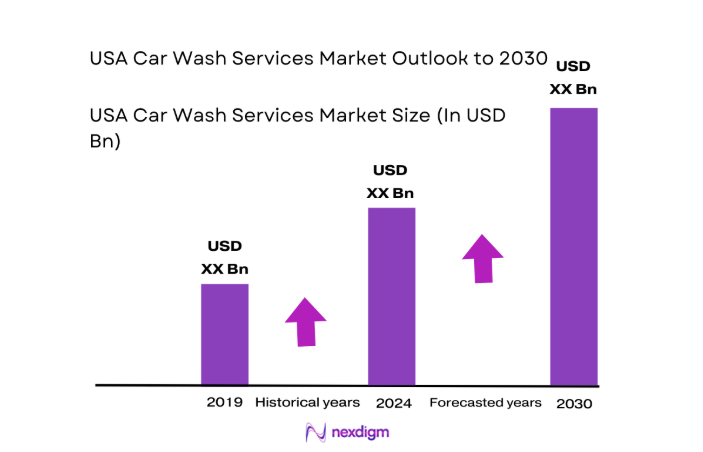
The USA Car Wash Services market current size stands at around USD ~ million, reflecting a mature service ecosystem shaped by dense urban corridors, high vehicle ownership, and frequent use of convenience-driven care formats. The market is supported by recurring service consumption, multi-site operators, and subscription-based models that stabilize demand cycles. Technology-led throughput optimization, automated tunnels, and water recycling systems continue to enhance service reliability and operational consistency across site networks nationwide.
Dominant activity concentrates in metro clusters across California, Texas, Florida, Arizona, and the Northeast corridor, supported by dense commuter flows, higher vehicle utilization intensity, and established retail real estate networks. These regions benefit from mature franchise ecosystems, advanced equipment suppliers, and favorable zoning pathways in designated commercial districts. Policy environments encouraging water reclamation and environmentally compliant detergents have further enabled operator scale-up, particularly in drought-prone and regulation-intensive states with developed infrastructure oversight.
Market Segmentation
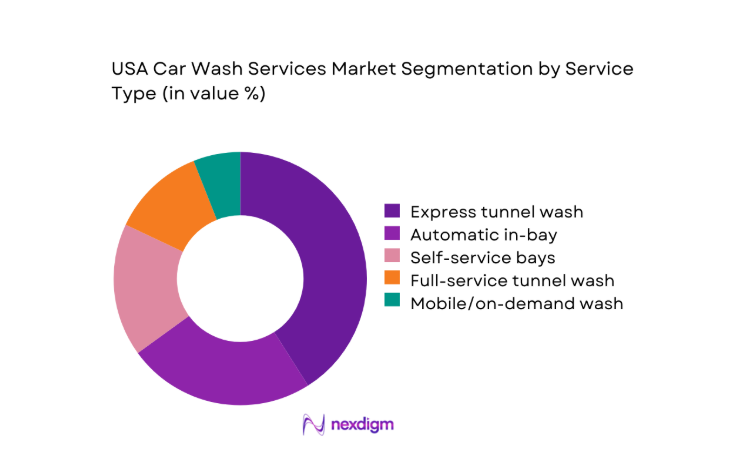
By Service Type
Express tunnel formats dominate due to high throughput, predictable cycle times, and compatibility with subscription programs that stabilize footfall. Self-service and in-bay automatics retain relevance in suburban trade areas with lower land costs and flexible operating hours. Full-service and detailing options concentrate in premium urban pockets, supported by higher willingness to pay for interior care and paint protection. Mobile services serve niche residential and fleet accounts where access and scheduling flexibility matter. Across formats, automation intensity and site footprint increasingly determine format viability and margin resilience amid labor constraints and permitting complexity in dense corridors.
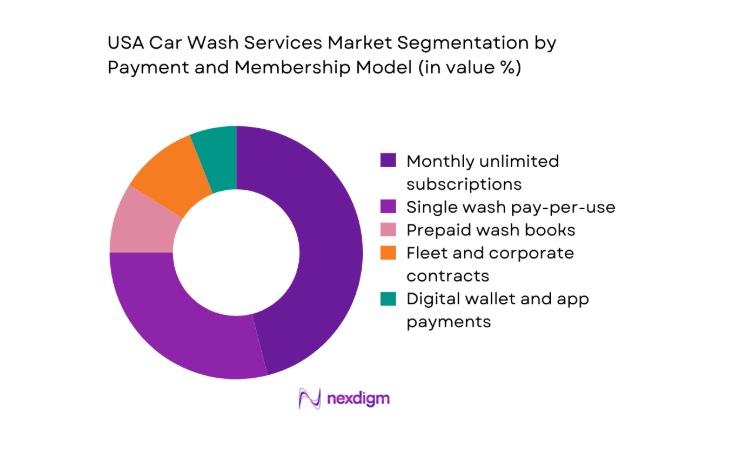
By Payment and Membership Model
Monthly unlimited subscriptions lead due to predictable recurring usage, customer lock-in, and data-driven retention mechanics. Single wash transactions remain material in tourist corridors and infrequent-use segments, while prepaid bundles support price-sensitive households. Fleet and corporate contracts are growing within last-mile delivery and shared mobility ecosystems, favoring centralized billing and service-level agreements. App-based wallets and license plate recognition streamline access, reduce queue friction, and enable targeted promotions. Operators increasingly optimize tiered plans to balance peak load management, wash frequency caps, and premium upsell attachment rates.
Competitive Landscape
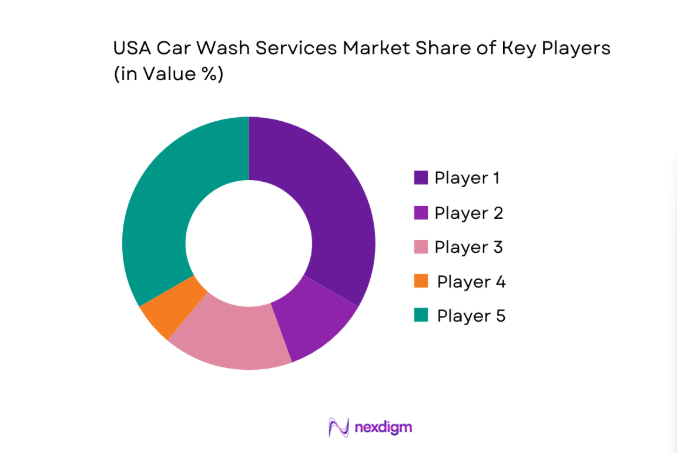
The competitive landscape features a mix of scaled multi-site operators and regionally dense networks focused on express tunnel formats, with competition driven by site density, subscription penetration, and operational automation. Differentiation centers on throughput efficiency, water stewardship compliance, and customer experience orchestration through digital touchpoints and loyalty mechanics.
| Company Name | Establishment Year | Headquarters | Formulation Depth | Distribution Reach | Regulatory Readiness | Service Capability | Channel Strength | Pricing Flexibility |
| Mister Car Wash | 1969 | Tucson, AZ | ~ | ~ | ~ | ~ | ~ | ~ |
| Take 5 Car Wash | 2014 | Atlanta, GA | ~ | ~ | ~ | ~ | ~ | ~ |
| Zips Car Wash | 2003 | Little Rock, AR | ~ | ~ | ~ | ~ | ~ | ~ |
| Tommy’s Express | 1969 | Holland, MI | ~ | ~ | ~ | ~ | ~ | ~ |
| Quick Quack Car Wash | 2004 | Roseville, CA | ~ | ~ | ~ | ~ | ~ | ~ |
USA Car Wash Services Market Analysis
Growth Drivers
Rising vehicle parc and urban density
Urban vehicle utilization intensity has increased across large metros, with registered light-duty vehicles exceeding ~ units in several states, while average daily vehicle miles traveled per capita rose from 29 in 2022 to 31 in 2024. Commuter congestion lengthened dwell times near retail corridors, supporting impulse service stops. Municipal parking enforcement expanded automated license plate systems across 120 cities in 2023, normalizing plate recognition integration at wash entries. New multifamily permits reached 471000 units in 2024, concentrating vehicles in dense clusters. These factors elevate wash frequency as residents face street parking exposure, dust accumulation, and seasonal debris, reinforcing demand for quick-turn services.
Time-constrained consumers favoring quick-service formats
Workforce participation exceeded 62 in 2024, while average weekly commuting hours increased from 4.6 in 2022 to 5.1 in 2024 across major metros. E-commerce parcel deliveries surpassed 22000000000 units in 2023, intensifying curbside congestion and surface contamination from road spray. Urban arterial speeds declined by 7 between 2022 and 2024, compressing discretionary time windows. Express tunnel dwell cycles under 3 minutes align with compressed schedules, encouraging habitual use. License plate recognition deployments across 3800 sites in 2024 reduced transaction friction, supporting higher throughput per hour and reinforcing quick-service preference during peak commuter windows.
Challenges
Water usage restrictions and drought-driven regulations
State-level drought emergency declarations covered 17 jurisdictions in 2023, triggering mandatory water-use curtailments for non-essential services in 9 states. Municipal utilities expanded tiered usage penalties across 142 cities in 2024, increasing compliance scrutiny. Average annual precipitation fell below long-term norms across Southwest basins in 2022 and 2023, constraining wash operations during peak summer months. New permitting cycles extended by 90 days in several counties due to water impact assessments. Operators face retrofitting requirements for reclamation systems meeting 70 reuse thresholds, raising approval complexity and extending time-to-open across arid regions.
High real estate and construction costs in urban corridors
Commercial land transactions in top metros recorded median price increases of 18 between 2022 and 2024, compressing site acquisition feasibility. Construction backlogs exceeded 9 months for specialty concrete and steel trades in 2023, delaying openings. Utility interconnection timelines averaged 120 days in dense corridors, pushing capital deployment windows. Zoning variance approvals declined by 11 approvals in 2024 as municipalities tightened site density caps near residential zones. Traffic impact assessments required in 64 jurisdictions added procedural steps. These constraints limit prime corridor access, raising competitive intensity for infill parcels and extending payback horizons.
Opportunities
White space expansion in underpenetrated suburban and exurban markets
County-level vehicle registrations in outer-ring suburbs increased by 6 between 2022 and 2024 as household formation shifted beyond urban cores. New single-family housing permits exceeded 700000 units in 2024, creating dispersed vehicle clusters underserved by automated wash capacity. Average drive times to nearest express tunnel exceed 14 minutes in 128 counties, signaling convenience gaps. State DOT interchange upgrades completed across 46 nodes in 2023 improved site accessibility. Retail pad vacancies rose by 3 in peripheral corridors, opening viable co-location opportunities with lower traffic conflicts and faster permitting cycles.
Upselling of premium protectants and ceramic coatings
Chemical treatment adoption expanded as consumer awareness rose through 41000 dealership service bays offering paint protection add-ons in 2024. Ultraviolet index averages increased across southern states in 2023, elevating concerns around clearcoat degradation. Average vehicle age exceeded 12.6 years in 2024, heightening maintenance focus to preserve resale condition. Operator throughput systems now enable dual-arch application cycles under 60 seconds, integrating premium tiers without slowing lanes. Detergent suppliers expanded biodegradable surfactant capacity across 5 domestic plants in 2023, supporting compliant premium service bundling across regulated jurisdictions.
Future Outlook
The market outlook through 2030 favors continued consolidation of express tunnel formats, deeper subscription penetration, and expanded water-reclamation compliance. Urban densification and exurban migration will rebalance site selection strategies, while digital access and automation will further streamline throughput. Policy tightening on water stewardship will accelerate retrofit cycles and favor operators with strong compliance playbooks.
Major Players
- Mister Car Wash
- Take 5 Car Wash
- Zips Car Wash
- Driven Brands Car Wash
- Super Star Car Wash
- Quick Quack Car Wash
- Tommy’s Express
- Delta Sonic Car Wash
- Wash Depot Holdings
- Spotless Brands
- Club Car Wash
- Speedwash
- Clean Express Auto Wash
- WhiteWater Express Car Wash
- Big Dan’s Car Wash
Key Target Audience
- Multi-site car wash operators and franchise networks
- Independent site owners and developers
- Fleet operators in logistics and last-mile delivery
- Rideshare and shared mobility fleet managers
- Automotive dealerships and service centers
- Commercial real estate owners and retail park developers
- Investments and venture capital firms
- Government and regulatory bodies with agency names such as state water resources departments and municipal planning authorities
Research Methodology
Step 1: Identification of Key Variables
Core variables were defined around service formats, site density, throughput capacity, water stewardship compliance, and digital access mechanisms. Operational constraints, zoning pathways, and utility interconnections were mapped to capture feasibility drivers. Demand signals were structured across commuter intensity, fleet utilization, and regional vehicle utilization patterns.
Step 2: Market Analysis and Construction
The market framework was constructed by aligning site typologies with corridor accessibility, permitting pathways, and technology adoption levels. Operational efficiency levers, reclamation compliance thresholds, and automation penetration were integrated to model service viability. Regional policy environments were layered to assess expansion friction across jurisdictions.
Step 3: Hypothesis Validation and Expert Consultation
Assumptions were validated through structured consultations with operators, equipment integrators, and municipal utility planners. Field observations of throughput cycles and access friction informed operational benchmarks. Regulatory interpretations were cross-checked with permitting officers to validate approval timelines and compliance thresholds.
Step 4: Research Synthesis and Final Output
Findings were synthesized into actionable insights linking demand concentration, format economics, and regulatory readiness. Scenario narratives were developed to reflect expansion constraints and technology-led differentiation pathways. The final output emphasizes decision-ready implications for site selection, compliance planning, and service mix optimization.
- Executive Summary
- Research Methodology (Market Definitions and service taxonomy for U.S. car wash formats, Primary interviews with multi-site operators and franchise networks, Point-of-sale transaction data aggregation from wash operators, Site-level capacity and throughput modeling by format, Geo-mapping of wash locations and trade area analysis, Pricing audits across metro and non-metro markets, Regulatory and zoning review at state and municipal levels)
- Definition and Scope
- Market evolution
- Usage and care pathways
- Ecosystem structure
- Channel structure
- Regulatory environment

- Growth Drivers
Rising vehicle parc and urban density
Time-constrained consumers favoring quick-service formats
Growth of subscription-based unlimited wash programs
Increased consumer focus on vehicle appearance and resale value
Expansion of private equity-backed multi-site operators
Adoption of water-recycling and eco-friendly systems enabling site approvals - Challenges
Water usage restrictions and drought-driven regulations
High real estate and construction costs in urban corridors
Labor shortages and rising wage pressures
Weather seasonality impacting demand volatility
Local zoning and permitting delays for new sites
Price sensitivity in low-income catchment areas - Opportunities
White space expansion in underpenetrated suburban and exurban markets
Upselling of premium protectants and ceramic coatings
B2B fleet wash contracts with delivery and rideshare operators
Digital customer engagement and loyalty via mobile apps
Co-location partnerships with retailers and convenience chains
Retrofit demand for water reclamation and energy-efficient equipment - Trends
Rapid growth of express tunnel and subscription models
Consolidation by private equity and regional chains
Increased automation and license plate recognition
Shift toward eco-friendly chemicals and water recycling
Dynamic pricing and promotional bundling
Data-driven site selection and performance analytics - Government Regulations
- SWOT Analysis
- Stakeholder and Ecosystem Analysis
- Porter’s Five Forces Analysis
- Competition Intensity and Ecosystem Mapping
- By Value, 2019–2024
- By Volume, 2019–2024
- By Active Systems, 2019–2024
- By Revenue per Wash, 2019–2024
- By Service Type (in Value %)
Self-service wash bays
Automatic in-bay
Express tunnel wash
Full-service tunnel wash
Detailing and premium services
Mobile/on-demand wash - By Payment and Membership Model (in Value %)
Single wash pay-per-use
Monthly unlimited subscriptions
Prepaid wash books
Fleet and corporate contracts
Digital wallet and app-based payments - By Location Type (in Value %)
Standalone car wash sites
Gas station and convenience store attached
Retail parking lot sites
Dealership and service center wash
Residential community wash facilities - By Vehicle Type Served (in Value %)
Passenger cars
SUVs and crossovers
Pickup trucks and vans
Commercial light vehicles
Ride-hailing and shared mobility fleets - By Geography (in Value %)
Northeast
Midwest
South
West
- Market structure and competitive positioning
Market share snapshot of major players - Cross Comparison Parameters (network scale and site count, geographic footprint, service format mix, subscription penetration, pricing tiers, technology adoption, water reclamation capability, EBITDA margin profile)
- SWOT Analysis of Key Players
- Pricing and Commercial Model Benchmarking
- Detailed Profiles of Major Companies
Mister Car Wash
Take 5 Car Wash
Zips Car Wash
Driven Brands Car Wash
Super Star Car Wash
Quick Quack Car Wash
Tommy’s Express
Delta Sonic Car Wash
Wash Depot Holdings
Spotless Brands
Club Car Wash
Speedway Express Car Wash
Clean Express Auto Wash
WhiteWater Express Car Wash
Big Dan’s Car Wash
- Demand and utilization drivers
- Procurement and tender dynamics
- Buying criteria and vendor selection
- Budget allocation and financing preferences
- Implementation barriers and risk factors
- Post-purchase service expectations
- By Value, 2025–2030
- By Volume, 2025–2030
- By Active Systems, 2025–2030
- By Revenue per Wash, 2025–2030


 Request a Sample
 Ask for Customization
 Get a Quote
 Enquire Now