
 Download PDF
 Download PDF
Market Overview
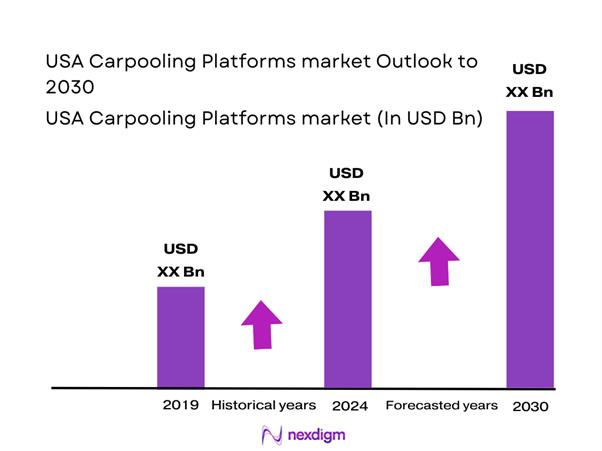
The USA Carpooling Platforms Market is valued at USD ~ billion. This scale is being driven by a practical “commute-cost hedge” use case (fuel + parking + toll avoidance), renewed employer commute management needs, and platform-led digitization (matchmaking, verification, payment rails, and commuter incentives). As a demand signal, the U.S. ride-sharing ecosystem also expanded from USD ~ billion to USD ~ billion in the most recent two-year window, reinforcing consumer normalization of shared trips and app-based mobility purchasing behavior.
In the USA, large metro job corridors dominate carpooling platform activity because they combine dense origin–destination overlap, high recurring commute volumes, and policy levers that reward higher vehicle occupancy (HOV/HOT access, TDM mandates, and employer trip-reduction programs). San Francisco Bay Area, Los Angeles, New York–New Jersey, Washington DC–Northern Virginia, Seattle, Chicago, Boston, and Austin consistently generate the highest “match liquidity” for carpools due to clustered offices, multi-employer campuses, and congestion pressure. The shutdown of Waze’s dedicated carpool service also highlighted how post-pandemic commute pattern shifts can re-route demand toward employer-led and commute-program platforms.
Market Segmentation
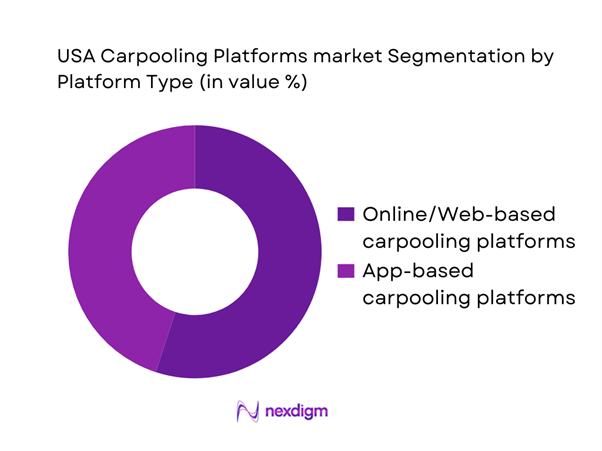
By Platform Type
USA carpooling platforms are segmented by platform type into Online/Web-based carpooling platforms and App-based carpooling platforms. Recently, online/web-based solutions have been reported as the dominant mode because they are deeply embedded in enterprise commute programs (single sign-on, benefits administration workflows, commuter policy compliance, reporting dashboards, and integration with parking/shuttle ecosystems). These platforms also better support regulated “program rules” (eligibility, incentive caps, verification) that employers and TDM agencies require. App-based platforms remain critical for consumer convenience, but enterprise procurement favors web-centric control layers that can standardize onboarding, security, and reporting across thousands of employees, which sustains the web-based lead.
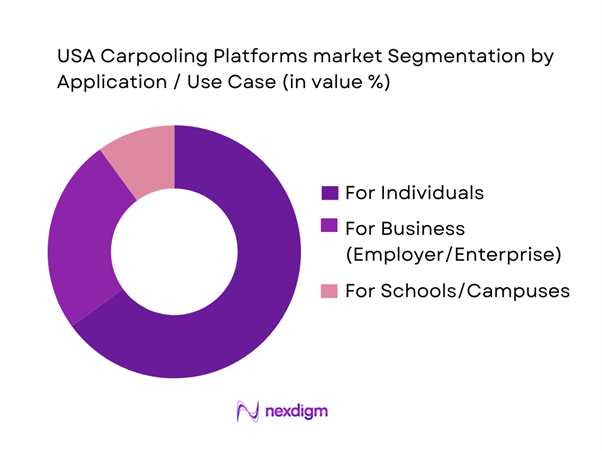
By Application / Use Case
USA carpooling platforms are segmented by application into For Individuals, For Business (Employer/Enterprise commute programs), and For Schools/Campuses. Individual commuter usage is dominant because it captures the largest base of repeat trips (daily commute and recurring personal travel), and it benefits from “immediate ROI” for users—lower per-trip cost, reduced parking burden, and predictable commute sharing. In parallel, the business segment is structurally important because it drives larger contract values and supports consistent demand pools, but adoption depends on employer policy (return-to-office cadence, incentive budgets, compliance needs). School/campus pooling remains smaller, as duty-of-care requirements, safeguarding, and administrative constraints slow scaling compared with general adult commuting.
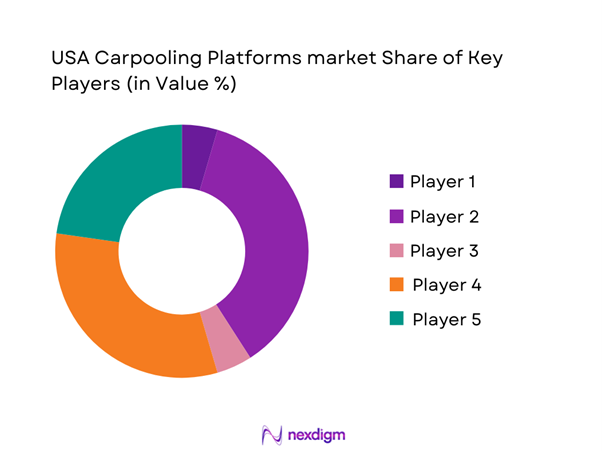
Competitive Landscape
The USA Carpooling Platforms market is moderately consolidated around enterprise commute management platforms and multi-modal mobility operators that can bundle carpooling with shuttles, vanpools, incentives, and compliance reporting. Providers that win enterprise accounts typically differentiate on match liquidity creation (closed communities), verification/safety tooling, incentive administration, and analytics—whereas consumer-oriented offerings compete on ease of matching, reliability, and convenience.
| Company | Est. Year | HQ | Primary Customer | Core Carpool Mode | Matching & Routing Layer | Trust & Safety Stack | Monetization Model | Integration Depth |
| Scoop (Scoop Commute) | 2011 | USA | ~ | ~ | ~ | ~ | ~ | ~ |
| RideAmigos (CommuteHub) | 2007 | USA | ~ | ~ | ~ | ~ | ~ | ~ |
| Via Transportation | 2012 | USA | ~ | ~ | ~ | ~ | ~ | ~ |
| Commute with Enterprise | 2019 | USA | ~ | ~ | ~ | ~ | ~ | ~ |
| TripShot | 2014 | USA | ~ | ~ | ~ | ~ | ~ | ~ |
USA Carpooling Platforms Market Analysis
Growth Drivers
Hybrid-work commute volatility
Hybrid work patterns have structurally increased day-to-day commute variability in the U.S., directly supporting carpooling platforms that enable flexible, non-fixed ride matching. According to the U.S. Bureau of Labor Statistics (BLS), ~ employed persons worked from home at least part of the time, while over ~ workers still commuted on-site regularly, creating fluctuating peak-day demand rather than stable five-day travel routines. The U.S. Census Bureau American Community Survey reports an average one-way commute time of ~ minutes, reinforcing the value of shared commuting on high-traffic days. This volatility benefits digital carpooling systems that can dynamically match riders based on daily attendance patterns rather than fixed schedules.
Parking cost inflation
Parking-related costs continue to rise due to urban land constraints and inflationary pressure on transportation services. The Bureau of Labor Statistics Consumer Price Index (CPI) for parking fees and tolls increased from an index level of ~ to ~ within the ~–~ period, indicating sustained upward pressure on commuter out-of-pocket expenses. Large employment hubs with limited parking supply intensify this burden for single-occupancy vehicle users. Carpooling platforms mitigate this by reducing the number of vehicles per workplace and enabling shared parking access. Employers increasingly promote carpooling as a parking demand management tool rather than expanding costly parking infrastructure.
Challenges
Match liquidity gaps
Carpooling platforms depend on sufficient spatial and temporal rider density to form viable matches. The U.S. Census Bureau shows that over ~ workers commute alone by car, while commute origins are increasingly dispersed due to suburban job growth. Low-density corridors lack overlapping schedules and destinations, reducing match probability. Without employer or campus anchoring, platforms struggle to maintain liquidity in such areas. This structural challenge limits scalability beyond major metros unless supported by policy-driven or employer-sponsored pooling frameworks that artificially concentrate demand.
Schedule mismatch issues
The variability of U.S. work schedules complicates recurring carpool arrangements. BLS Time Use Survey data indicates that workers’ start times span a wide distribution, with significant clusters before ~ a.m., between ~ a.m., and after ~ a.m. Additionally, the average weekly hours worked at main job stood above ~ hours, reflecting flexible scheduling across industries. These mismatches reduce compatibility for fixed carpools and increase cancellations. Platforms must continuously rematch riders, increasing operational complexity and reducing reliability perceptions among users.
Opportunities
Verified occupancy at scale
Verified occupancy systems represent a major structural opportunity. The Federal Highway Administration confirms increasing reliance on occupancy enforcement technologies across managed lanes. With over ~ managed-lane miles already operational, authorities require reliable proof of vehicle occupancy to grant toll exemptions. Carpooling platforms that integrate GPS, telematics, or app-based verification can support compliance without physical enforcement expansion. This creates a scalable role for digital platforms as verification intermediaries rather than simple matchmakers.
Toll and parking integrations
Integration with tolling and parking systems strengthens the functional value of carpooling platforms. The Federal Highway Administration and state DOTs report sustained investment in electronic toll collection and smart parking infrastructure. Meanwhile, BLS CPI data confirms persistent inflation in tolls and parking charges. Platforms that link verified carpools directly to toll exemptions or parking access can convert macro-level cost pressures into immediate user benefits. This integration shifts carpooling from a behavioral choice to a financially enforced mobility optimization tool.
Future Outlook
Over the next planning horizon, the USA Carpooling Platforms market is expected to expand as employers formalize commute benefit stacks, cities increase focus on congestion and emissions reduction, and platforms improve match reliability through better pooling algorithms, workplace/community clustering, and incentives. A major unlock will be deeper integration with parking management, transit passes, tolling/HOV compliance, and benefits administration, turning carpooling into an “always-on” commuter product instead of an occasional choice. The direction of return-to-office policies will remain a demand variable, but enterprise-led programs can stabilize utilization by seeding consistent rider pools.
Major Players
- Scoop
- RideAmigos
- Via Transportation
- Commute with Enterprise
- TripShot
- Uber
- Lyft
- BlaBlaCar
- Carma
- Zimride / Enterprise commute solutions
- Bridj
- moovel
- mytaxi
- Getaround
Key Target Audience
- Investments and venture capitalist firms
- Government and regulatory bodies
- Large employers and corporate real estate owners
- Transportation Demand Management program owners
- Mobility platform operators and MaaS aggregators
- Parking operators and curb management platforms
- Tolling / HOT lane concessionaires and managed lane operators
- Health systems and large shift-based employers
Research Methodology
Step 1: Identification of Key Variables
We construct an ecosystem map of the USA carpooling landscape covering consumer carpooling, employer/TDM programs, and multi-modal shared mobility. Secondary research is used to define variables such as trip purpose mix, liquidity drivers, monetization routes, and compliance requirements, along with platform feature benchmarks and procurement behavior.
Step 2: Market Analysis and Construction
We compile historical indicators on shared mobility adoption and commute program penetration, then structure a bottom-up model anchored on platform revenue streams (B2B program contracts + commuter transaction layers) and usage intensity (repeat commute behavior, corridor density, and program participation dynamics).
Step 3: Hypothesis Validation and Expert Consultation
We validate assumptions through CATIs with platform operators, employer commute managers, TDM agencies, and managed-lane stakeholders to confirm conversion funnels, incentives effectiveness, churn drivers, and corridor-specific adoption constraints impacting realized revenue.
Step 4: Research Synthesis and Final Output
We triangulate platform-level insights with employer policy structures and corridor-level mobility constraints to finalize segment positioning, competitive benchmarking, and actionable opportunity mapping, ensuring internal consistency between demand drivers, delivery capacity, and monetization feasibility.
- Executive Summary
- Research Methodology (market definitions & scope boundaries, inclusion/exclusion for carpooling platforms vs ride-hail shared vs vanpool/TDM, assumptions & normalization rules, data triangulation framework, primary interview design with platforms TMAs employers transit agencies toll operators, route-corridor sampling logic, pricing & incentive capture approach, risk & limitation statements, terminology & abbreviations)
- Definition and Scope
- Market Genesis and Evolution
- Business Model Map
- Demand Centers
- Ecosystem Stakeholders

- Growth Drivers
Hybrid-work commute volatility
Parking cost inflation
Express-lane pricing pressure
Employer ESG and Scope 3 commuting focus
Fuel price sensitivity and congestion reliability needs - Challenges
Match liquidity gaps
Schedule mismatch issues
Safety and trust barriers
Fraud risks in incentive programs
Insurance and liability ambiguity - Opportunities
Verified occupancy at scale
Toll and parking integrations
Campus electrified vanpool expansion
Multimodal wallets and mobility budgets
AI-based reliability scoring and analytics - Trends
Growth of closed-network platforms
Shift toward verified incentive payouts
Integration with commute benefits platforms
Re-emergence of dynamic carpooling
Digitization of curb and parking assets - Regulatory & Policy Landscape
- SWOT Analysis
- Stakeholder & Ecosystem Analysis
- Porter’s Five Forces Analysis
- Competitive Intensity & Ecosystem Mapping
- By Value, 2019–2024
- By Revenue, 2019–2024
- By Activity, 2019–2024
- By Fleet Type (in Value %)
Open peer-to-peer carpool marketplaces
Closed-network corporate carpool platforms
University and campus-based carpool networks
Multimodal commute platforms with carpool as a mode
Fleet-supported pooled commuting and vanpool platforms - By Application (in Value %)
Daily commuter carpooling
Hybrid-work flexible commuter pooling
Event-based carpooling
Airport and park-and-ride feeder pooling
Intercity and long-distance carpooling - By Technology Architecture (in Value %)
Planned and recurring matching systems
Dynamic and real-time matching systems
Guaranteed ride home enabled architectures
Driver rotation and shared-driving frameworks
Fleet-assisted pooled commute architectures - By Connectivity Type (in Value %)
Mobile app-based platforms
Web-based enterprise dashboards
API-integrated HR and benefits systems
Toll and parking system integrated platforms
Multimodal MaaS-integrated platforms - By End-Use Industry (in Value %)
Individual commuters
Corporate employers
Universities and educational campuses
Transportation management associations and MPOs
Public transit agencies - By Region (in Value %)
Mega-metro core regions
Sunbelt suburban metros
Express-lane dense regions
University-centric regions
Industrial and logistics corridors
- Cross Comparison Parameters (corridor liquidity index, verification capability and fraud controls, enterprise readiness and integrations, incentive engine sophistication, reliability toolkit and SLAs, safety and trust stack, analytics and ESG reporting depth, monetization model and unit economics levers)
- Pricing and Incentive Benchmarking
- Competitive SWOT Snapshots
- Partnership and Channel Ecosystem
- Company Profiles
Scoop
Carma
BlaBlaCar
Uber
Lyft
Via
Liftango
RideAmigos
RideShark
TripSpark RidePro
Metropia
Commute with Enterprise
myCommuteSolutions
ConnectSmart Mobility
- Commuter persona segmentation
- Employer buyer journey analysis
- Campus and public-sector procurement dynamics
- Participation drivers and adoption triggers
- Barriers and objections
- By Value, 2025–2030
- By Revenue, 2025–2030
- By Activity, 2025–2030


 Request a Sample
 Ask for Customization
 Get a Quote
 Enquire Now