
 Download PDF
 Download PDF
Market overview
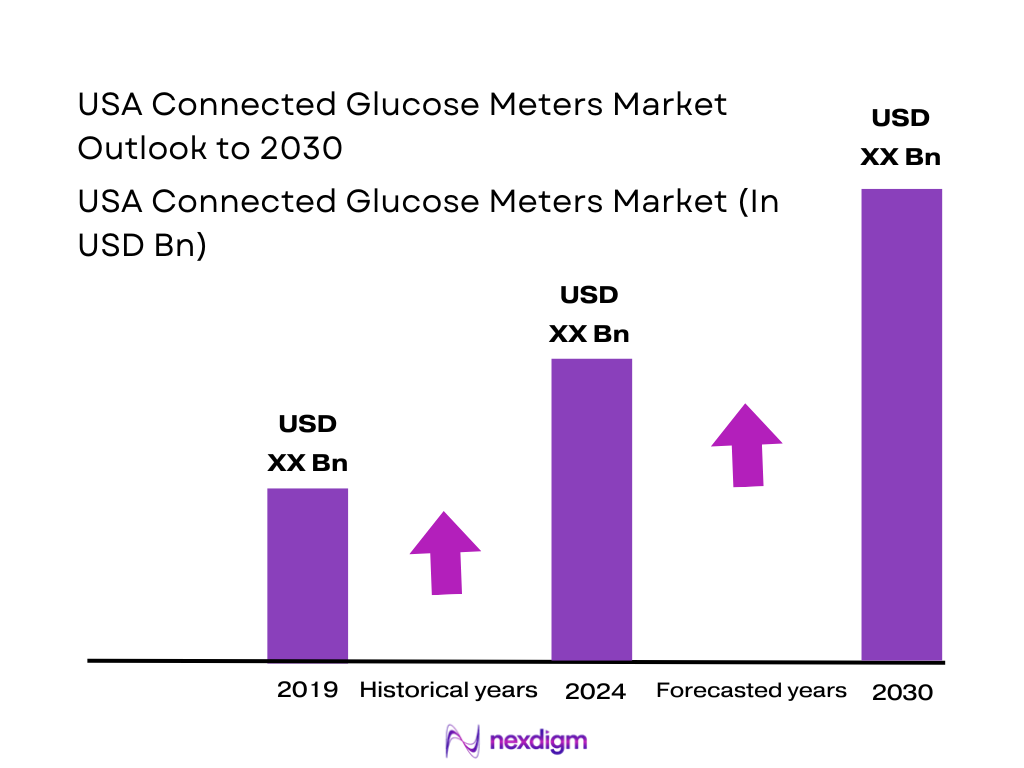
The USA connected glucose meters market is valued at USD ~ million in the latest year, up from USD ~ million in the prior year, reflecting a rising mix of smartphone-linked meters, reimbursed CGM growth, and recurring consumables demand. Momentum is reinforced by connected-care workflows, payer-backed remote monitoring, and pharmacy-first access models that reduce friction in refills and onboarding.
Demand concentration is highest in large U.S. metro corridors where dense diabetes care networks, endocrinology capacity, employer-sponsored coverage, and digital-health adoption are structurally stronger. Scale effects also come from national population growth to ~ million residents, plus accelerated aging—the 65+ population reaching ~ million (rising from the prior year)—which increases monitoring intensity and chronic-care utilization in major cities anchored by integrated delivery networks.
Market segmentation
By device category
The market is segmented by device category into self-monitoring blood glucose (SMBG) devices (including connected/smart meters and consumables) and continuous glucose monitoring (CGM) devices. In the latest year, SMBG remains the dominant revenue pool because it is still the default “first-line” monitoring tool in many primary-care pathways, supports broad OTC/pharmacy access, and drives repeat purchasing through strips and lancets. Even as CGM expands, SMBG holds structural advantages in affordability, familiarity, and suitability for intermittent testing needs.

By care setting
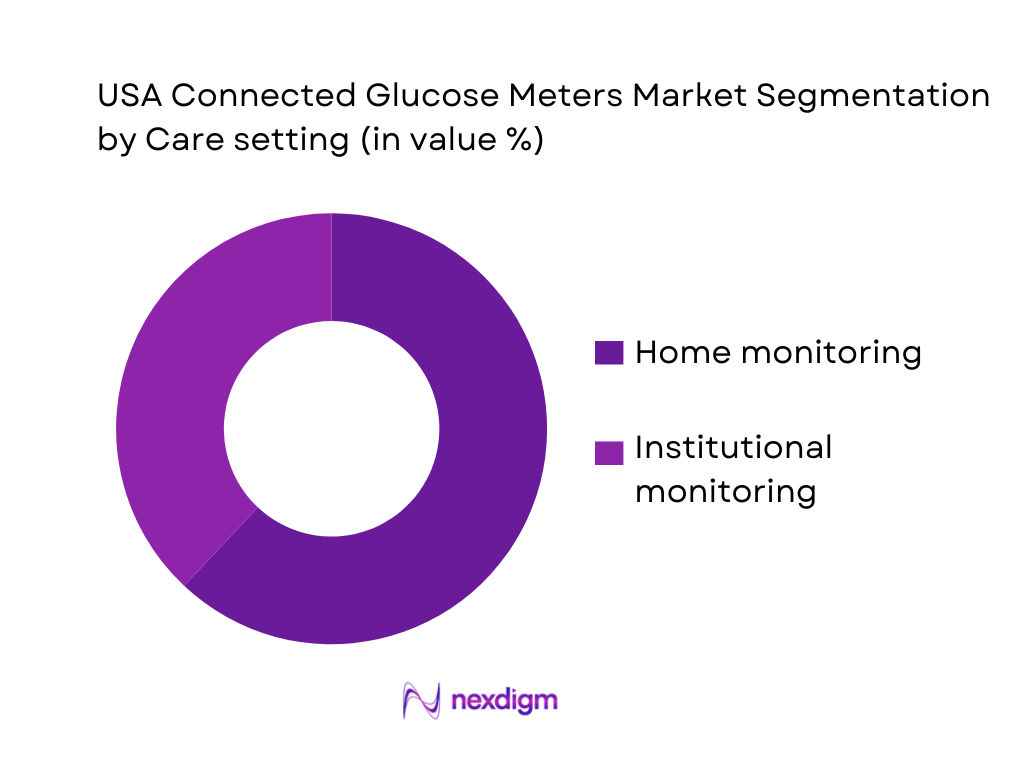
The market is segmented by care setting into home monitoring and institutional monitoring. Home monitoring dominates because diabetes management is increasingly executed outside acute settings: users test before meals, post-meal, during exercise, at work, and while traveling—contexts where a connected meter + app logbook provides immediate patterning and shareable reports. Home dominance is reinforced by subscription/refill behavior (strips and sensors), retailer and pharmacy-led onboarding, and virtual-care pathways that use device data to adjust therapy without frequent in-person visits.
Competitive landscape
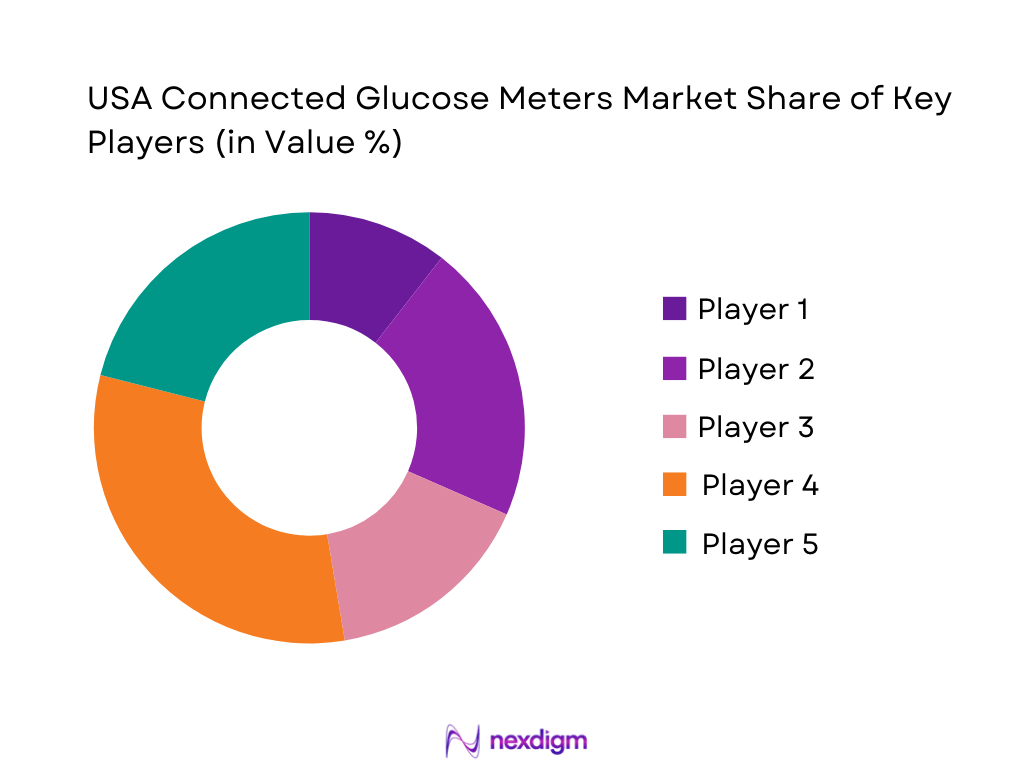
The USA market is shaped by a small set of scaled diabetes-device manufacturers and ecosystem players that control core hardware, strip/sensor supply, companion apps, and payer/channel access. Competition is increasingly ecosystem-led (meter/CGM + app + coaching + integrations), with differentiation shifting toward data usability, interoperability (APIs/EHR/RPM platforms), and pharmacy/DME execution.
| Company | Est. year | HQ | Primary glucose modality focus | Connectivity footprint | App / data ecosystem strength | Payer / channel execution | Integration readiness (RPM / EHR / APIs) | Enterprise programs (employers / IDNs) |
| Abbott | 1888 | USA | ~ | ~ | ~ | ~ | ~ | ~ |
| Dexcom | 1999 | USA | ~ | ~ | ~ | ~ | ~ | ~ |
| Roche Diabetes Care | 1896 | Switzerland | ~ | ~ | ~ | ~ | ~ | ~ |
| LifeScan (OneTouch) | 1986 | USA | ~ | ~ | ~ | ~ | ~ | ~ |
| Ascensia Diabetes Care | 2016 | Switzerland (operationally global) | ~ | ~ | ~ | ~ | ~ | ~ |
USA Connected Glucose Meters Market Dynamics
Growth Drivers
Medicare Part B diabetes supply coverage dynamics
Medicare’s reimbursement mechanics keep connected glucose meters tied to documentation, eligibility, and the economics of “covered supplies.” The standard Part B monthly premium is USD ~ and the annual deductible is USD ~, setting the out-of-pocket frame that beneficiaries and caregivers feel when they adopt meters, strips, and app-enabled workflows through DME/pharmacy channels. On the demand side, the diabetes base remains structurally large: ~ million people in the U.S. had diabetes and ~ million were age 65+, reinforcing sustained utilization for SMBG ecosystems even as CGM expands. In the broader macro backdrop, U.S. GDP is USD ~ trillion and population is ~, supporting large-scale payer/provider program deployment and device access infrastructure.
Payer push for outcomes-based diabetes programs
Commercial and public payers are increasingly structuring benefits around measurable adherence and utilization controls—an environment where connected meters fit “prove-it” models better than manual logs. A key market-specific lever is PBM control over medication access and formulary dynamics: the U.S. Federal Trade Commission’s PBM investigation and interim report highlights how PBMs can influence patient access and plan economics—indirectly tightening the pressure on diabetes programs to show outcomes per member. Meanwhile, insurance coverage scale is enormous: ~ million people had health insurance, and ~ million had private coverage, creating a massive addressable base for plan-sponsored diabetes programs that bundle strips/meters with digital engagement and nurse/coach touchpoints. Macros reinforce why the U.S. remains the highest-intensity market for contracted outcomes models at scale.
Challenges
Formularies & PBM leverage on strip choice
Connected meter adoption can be constrained by formularies that effectively dictate which strip ecosystems are financially viable for a member—creating friction when the “best UX” meter is not the “preferred” meter. The FTC’s interim PBM report emphasizes PBM market power and consolidation dynamics, based on an investigation of 6 major PBMs, and describes PBMs’ ability to shape access and network conditions—an environment that can indirectly steer strip/meter brand selection through coverage design and pharmacy contracting. This matters for connected meters because strip economics lock users into a device ecosystem; switching costs show up as re-training, new app onboarding, and disrupted historical trend data. Meanwhile, the insured base is massive, meaning formulary steering decisions can rapidly reshape channel demand at national scale—often faster than device vendors can reconfigure distribution and integration partnerships. Macros amplify how quickly PBM-driven “preferred lists” can ripple through retail pharmacies and employer plans.
DMEPOS documentation burden
For Medicare-relevant supply pathways, documentation requirements can become a gating factor—slowing fulfillment, increasing provider administrative load, and raising abandonment risk for connected meter onboarding. The cost isn’t just time: documentation and compliance overhead must be maintained across high- volume beneficiary populations, including ~ people covered by Medicare and ~ uninsured individuals who may shift between coverage types, complicating continuity of supply workflows. CMS policy materials and program guidance for chronic management and remote monitoring emphasize structured service periods, eligible services, and program rules, which operationally pushes provider groups and suppliers to invest in back-office processes rather than patient-facing experience. In a market of population ~ and GDP USD ~ trillion, the sheer scale of beneficiaries and claims volume makes “paperwork friction” a real adoption limiter—particularly for smaller clinics and independent pharmacies that lack dedicated compliance teams.
Opportunities
Cellular-first underserved cohorts
A high-upside pathway is “cellular-first” connected meters that work without requiring broadband, Wi-Fi, or complex smartphone setup—important for older adults, rural users, and vulnerable cohorts where onboarding friction kills sustained use. The U.S. population scale and the aging base reflected in Medicare coverage create a durable demand pool for simplified connectivity, caregiver sharing, and clinician visibility without heavy app dependency. Diabetes prevalence ensures that even niche underserved segments translate into meaningful unit volumes when payers and providers target avoidable complications and improve monitoring continuity. The cybersecurity landscape also increases demand for secure-by-design devices, which is an opportunity for vendors that can combine cellular simplicity with enterprise-grade controls. In a GDP USD ~ trillion market, scaled deployment through Medicare suppliers, MA plans, and Medicaid-managed programs becomes feasible when devices reduce setup burden and improve data reliability for care teams.
Pharmacy-to-program conversion
Retail pharmacy can be a conversion engine: meters and strips are frequently initiated at the pharmacy counter, and the next growth unlock is converting that transaction into an enrolled diabetes program (digital coaching, refill synchronization, adherence nudges, and clinician sharing). The addressable base is enormous— ~ people with employment-based coverage plus ~ with Medicare coverage creates multiple “covered lives” pathways where pharmacy engagement can trigger program enrollment under payer benefit designs. PBM influence (FTC interim report built on 6 PBM investigations) means pharmacy networks and benefit managers strongly shape what is dispensed; vendors that win preferred placement can attach program enrollment through QR onboarding, auto-fill, and data sharing consent flows at scale. With ~ insured individuals, even modest improvements in pharmacy-to-program conversion translate into large absolute participant counts—without relying on future-looking market size claims—supported by the U.S. macro base.
Future outlook
Over the next cycle, the USA connected glucose meters market is expected to grow on the back of expanding consumerization of chronic care, payer migration toward outcomes-based monitoring and virtual care, and deeper integration of glucose data into broader cardiometabolic platforms. The market’s headline growth is anchored by the broader U.S. blood glucose monitoring devices trajectory, which is projected to expand at a CAGR of 7.4 through the end of the forecast window. A parallel growth engine is CGM expansion (including OTC moves), which lifts the “connected” standard for all glucose monitoring workflows.
Major players
- Abbott
- Dexcom
- Roche Diabetes Care
- LifeScan
- Ascensia Diabetes Care
- Medtronic Diabetes
- Senseonics
- Ypsomed
- i-SENS
- AgaMatrix
- Tandem Diabetes Care
- Insulet
- Novo Nordisk
- Sanofi
Key target audience
- Device OEMs & strip/sensor manufacturers
- Retail pharmacy chains & pharmacy buying groups
- PBMs and health insurers
- Integrated Delivery Networks (IDNs) & hospital systems
- Diabetes clinics & large endocrinology groups
- Digital health / RPM platform operators
- Investments and venture capitalist firms
- Government and regulatory bodies
Research methodology
Step 1: Identification of Key Variables
We map the U.S. glucose monitoring ecosystem across manufacturers, pharmacies, DME distributors, payers, IDNs, and RPM platforms. Desk research consolidates device classes (smart BGMs vs CGM), reimbursement signals, connectivity standards, and channel mechanics that determine adoption velocity.
Step 2: Market Analysis and Construction
We compile historical revenue signals and triangulate category-level performance using published market databases, company disclosures, and channel indicators (pharmacy vs DME). The model is structured to separate SMBG recurring revenue (strips/lancets) from sensor-led CGM growth drivers.
Step 3: Hypothesis Validation and Expert Consultation
Hypotheses are validated via CATIs with stakeholders spanning manufacturers, diabetes educators, payer decision-makers, pharmacy category heads, and RPM operators. Interviews are used to validate pricing architecture (without disclosing confidential pricing), conversion funnels, and integration frictions.
Step 4: Research Synthesis and Final Output
We synthesize findings into a bottom-up market view, stress-test against category constraints (regulatory, recall risk, cybersecurity), and finalize a decision-ready output: segment attractiveness, competitor benchmarking, and actionable growth white spaces.
- Executive Summary
- Research Methodology (Market definitions & inclusions/exclusions, device taxonomy—BGM vs connected BGM vs program kits, assumptions, abbreviations, triangulation model, bottom-up shipment-to-strip conversion logic, top-down payer lives & utilization logic, primary interview plan—endocrinology/RPM/DME/PBMs, sensitivity analysis, limitations)
- Definition & scope
- Market genesis & adoption timeline
- Product architecture
- Data flow stack
- Value chain & profit pools

- Growth Drivers
Medicare Part B diabetes supply coverage dynamics
payer push for outcomes-based diabetes programs
RPM/CCM workflow pull
smartphone-led self-management
employer-sponsored chronic condition management - Challenges
formularies & PBM leverage on strip choice
DMEPOS documentation burden
app engagement drop-off
data silos/interoperability
cybersecurity and privacy compliance overhead
accuracy perception vs CGM - Opportunities
cellular-first underserved cohorts
pharmacy-to-program conversion
integrated insulin titration workflows
caregiver-mode & family sharing
multilingual UX - Trends
strip subscription bundles
OTA firmware updates
AI pattern insights
automated refill/fulfilment
smart reminders - Regulatory & Standards Landscape
- Technology Benchmarking
- Porter’s Five Forces
- SWOT Framework
- Competition Ecosystem Map
- By value, 2019-2024
- By volume, 2019-2024
- By ASP bands, 2019-2024
- By Utilization lens, 2019-2024
- By Connectivity Type (in Value %)
Bluetooth Smart
NFC tap-to-sync
cellular kits
dual-mode
hub/gateway-supported
- By Patient Therapy / Clinical Use (in Value %)
insulin-intensive
basal-only
non-insulin T2D
gestational
prediabetes/high-risk
- By Channel / Access Path (in Value %)
retail pharmacy
mail-order pharmacy
DMEPOS suppliers
employer/health-plan programs
direct-to-consumer e-commerce
- By Care Model / Program Layer (in Value %)
standalone meter+app
digital coaching bundles
RPM-enabled care teams
CCM/behavioral integration
integrated metabolic programs
- By End-Use Setting (in Value %)
home self-testing
clinic titration support
hospital discharge kits
community health/FQHC programs
long-term care
- By Data Ecosystem Compatibility (in Value %)
Apple Health/Google Fit sync
Glooko/Tidepool compatibility
EHR-export readiness
API availability
caregiver sharing
- By Product Tier / Proposition (in Value %)
premium accuracy & insights
mid-tier pharmacy staples
value meters
accessibility/talking meters
multi-parameter meters
- Market share benchmarking
- Cross Comparison Parameters (FDA clearance scope & labeling claims, Accuracy & standards performance, Connectivity reliability, App & analytics depth, Interoperability footprint, Reimbursement & channel strength, Fulfillment & strip economics, Cybersecurity & privacy readiness)
- Company SWOT
- Pricing & pack architecture
- Partnership map
- Detailed Profiles of Major Companies
LifeScan
Ascensia Diabetes Care
Roche Diabetes Care
Abbott Diabetes Care
Teladoc Health
AgaMatrix
ForaCare
Trividia Health / Nipro Diagnostics
DarioHealth
iHealth Labs
ACON Laboratories
Prodigy Diabetes Care
Medline / Private-label diabetes supplies ecosystem
Walmart / Retail private-label diabetes supplies ecosystem
- Persona segmentation
- Decision-making unit
- Patient journey mapping
- HCP workflow needs
- Procurement & contracting
- By value, 2025-2030
- By volume, 2025-2030
- By ASP bands, 2025-2030
- By Utilization lens, 2025-2030


 Request a Sample
 Ask for Customization
 Get a Quote
 Enquire Now