
 Download PDF
 Download PDF
Market Overview
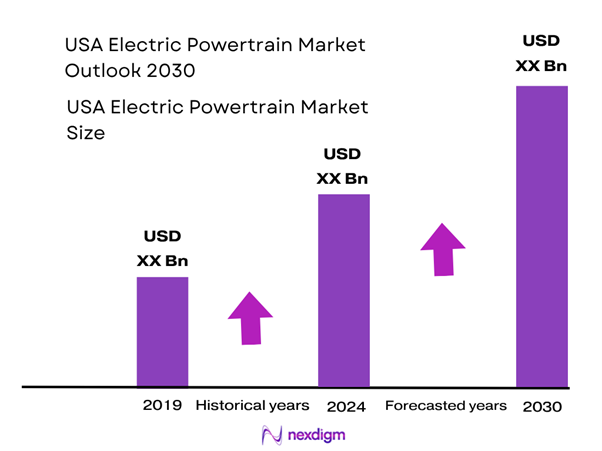
The USA electric powertrain market is valued at approximately USD ~ billion. This growth is being propelled by the steep up-take of electric vehicles (EVs), increasing regulatory pressure on internal combustion engine (ICE) powertrains, and accelerating cost declines in electric drive components (motors, inverters, battery systems). While the market is still relatively modest compared to global totals, 2023 marked a notable jump in EV adoption and component shipments, which is translating into downstream powertrain systems opportunities.
Major U.S. manufacturing hubs such as Detroit-Michigan, Texas, California and the Southeast (Georgia, Tennessee) dominate the market footprint. These regions benefit from strong OEM/EV manufacturer presence, favourable state policies for EV manufacturing, skilled automotive supply-chain infrastructure and proximity to battery and e-drive component plants. California remains particularly influential given its zero-emission vehicle (ZEV) mandates and high EV penetration, while Texas and Georgia are rising as commercial-vehicle electrification hubs and new battery plant locations.
Market Segmentation
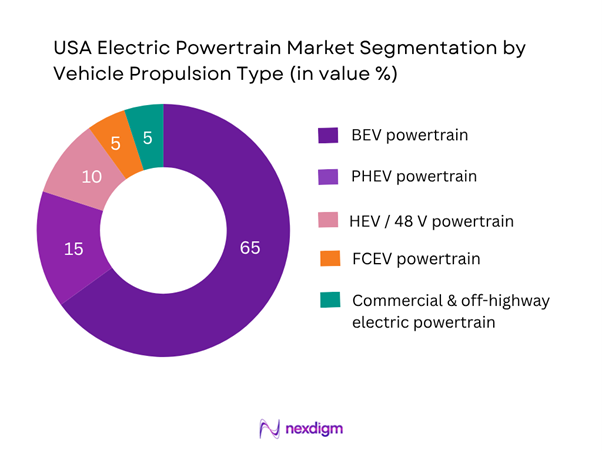
By Vehicle Propulsion Type
The BEV powertrain sub-segment holds the lion’s share in the USA because OEM electrification strategies are strongly skewed toward full battery-electric models. The policy push (federal tax credits, IRA localisation incentives), combined with consumer demand for zero tailpipe-emission vehicles, drives OEMs to integrate electric drive units rather than hybrid architectures. In addition, the powertrain cost curve for BEVs is declining sharply (battery system cost reductions, SiC inverter adoption, compact e-axle modules) which further reinforces the economics of BEV powertrains for the U.S. market. PHEV and HEV powertrains remain relevant, but their growth is slower as they occupy a transitional role. FCEV powertrains and commercial/off-highway segments currently represent smaller niches due to higher system cost, infrastructure constraints (hydrogen, high-voltage, heavy duty) and fewer models today, hence they capture smaller shares of the powertrain budget.
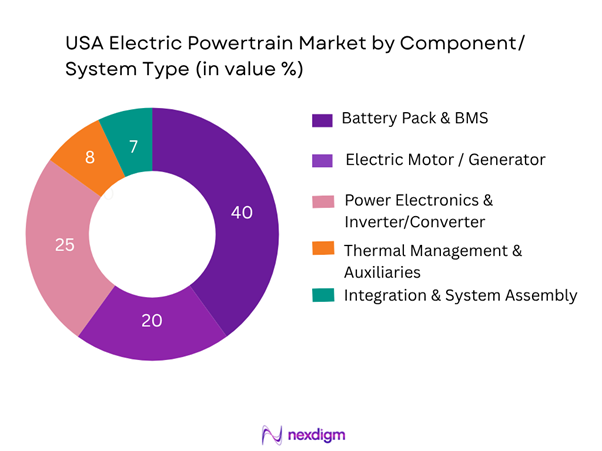
By Component/System Type
The battery pack & BMS sub-segment leads because the cell-to-pack system remains the largest single cost driver in electric powertrains and commands significant value share in the system bill-of-materials (BOM). As OEMs scale EV production in the U.S., the local sourcing of battery systems is rising, making this module a central focus of domestic powertrain manufacturing. Moreover, system performance (energy density, thermal management, charging speed) is critical — so the battery subsystem receives the highest investment and value share. The motor and power electronics follow, but as OEMs integrate and modularise e-axle modules and higher-voltage architectures (800 V+), their relative share grows over time though from a lower base today.
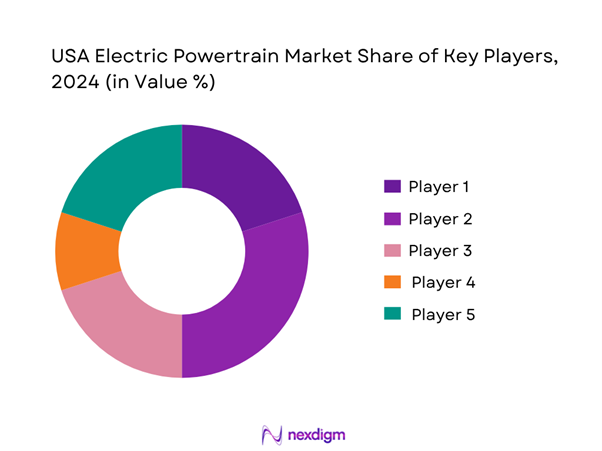
Competitive Landscape
The U.S. electric powertrain market features a combination of global Tier-1 suppliers, major OEM captive units and specialised electric drive specialists. The competitive environment is moderately consolidated but shifting rapidly due to emerging e-drive architectures and new entrants.The competitive landscape in the U.S. is dominated by a few key suppliers that hold substantial contracts for e-drives, inverter systems, battery module integration and powertrain assembly. These players benefit from long-standing relationships with OEMs, scale in component manufacturing, and evolving capabilities in system integration (e-axles etc.). At the same time new entrants and regionalised battery integrators are increasing competitive pressure, highlighting the strategic importance of localisation, cost control and platform flexibility.
| Company | Establishment Year | Headquarters | U.S. Manufacturing Footprint | Core Powertrain Offering | Recent Strategic Move | Key Strength |
| BorgWarner Inc. | 1928 | Auburn Hills, Michigan, USA | – | – | – | – |
| Magna International Inc. | 1957 | Aurora, Ontario, Canada (North America HQ) | – | – | – | – |
| Robert Bosch GmbH | 1886 | Stuttgart, Germany | – | – | – | – |
| ZF Friedrichshafen AG | 1915 | Friedrichshafen, Germany | – | – | – | – |
| Dana Incorporated | 1904 | Maumee, Ohio, USA | – | – | – |
USA Electric Powertrain Market Analysis
Growth Drivers
Vehicle electrification targets & zero-emission mandates
The U.S. federal government agencies have set major electrification ambitions: for example, in the current fiscal year 26 federal agencies plan to acquire approximately 9,500 zero-emission vehicles and install about 8,500 EV charging ports. These mandates create strong downstream demand for electric drive systems and powertrains because each zero-emission vehicle must be supported by e-drivetrain hardware instead of conventional ICE systems. The modulated requirement for charging infrastructure likewise increases the need for adapted high-voltage architectures and associated powertrain components. By aligning regulatory procurement with electrified vehicle adoption, the powertrain segment is structurally supported by large institutional demand flows.
Cost decline in EV powertrain components (battery, SiC, integration)
In the U.S., the battery manufacturing pipeline is accelerating, with reported plans for more than 1,100 GWh per year of battery-cell manufacturing capacity across North America. cell production ramps, the economies of scale in battery packs, power electronics (such as SiC inverters) and integrated e-axle assemblies bring down the cost per unit of electric powertrain hardware. This cost decline lowers the barrier to adoption for OEMs and supports wider deployment of electric powertrains in both passenger and commercial segments. The improved cost structure helps suppliers and OEMs choose electric powertrains over ICE or hybrid alternatives, increasing system volumes.
Market Challenges
Supply-chain constraints (rare earths, SiC, battery raw materials)
The U.S. remains heavily dependent on imported rare-earth compounds: in 2024 imports of certain rare-earth compounds (HS 284690) were valued at USD 151.08 million, with over 74 % sourced from China. For EV powertrains, rare earths (in permanent magnets for motors) and wide-band gap semiconductors (SiC / GaN) are critical. These dependencies create risk exposure to geopolitical or trade disruptions, which could bottleneck motor or inverter supply. Thus, the powertrain market must contend with raw materials volatility, supply-chain resilience and localisation constraints, which may slow or raise cost of powertrain module production in the U.S.
Infrastructure limitations (charging, grid, high-voltage safety)
While electrification is accelerating, the supporting infrastructure is lagging: for instance, battery-storage capacity in the U.S. grew by 10.4 GW in 2024, reaching over 26 GW in total. However, only about 2 % of the U.S. utility-scale electricity-generating capacity was battery storage as of 2024. The transition to high-voltage (800 V+) powertrains requires upgraded grid, charging network robustness and safety infrastructure. The slower pace of public charging and high-voltage enablement creates constraints for OEMs deploying advanced electric powertrain architectures, potentially delaying full commercialisation or raising cost/risk for system suppliers.
Opportunities
High-voltage architectures & system integration (800 V+ platforms)
The next generation of electric vehicles in the U.S. is trending toward high-voltage (800 V and beyond) platforms, enabling faster charging, reduced wiring weight, and improved system-level efficiency. Although specific U.S. powertrain-system volumes are not publicly broken out, the global battery manufacturing capacity figure of over 200 GWh in 2024 in the U.S. suggests scale for advanced system adoption. Suppliers who can provide integrated e-axle modules, high-voltage inverters, thermal management optimized for 800 V systems, and software-enabled powertrain controls stand to capture disproportionate value as OEMs shift architecture. This presents a growth vector for U.S. powertrain component and module suppliers moving beyond commodity motors/inverters.
Commercial vehicle electrification (heavy truck, bus) and new use-cases
Electric powertrain demand is expanding beyond passenger vehicles into light-commercial, medium and heavy-duty segments (buses, vocational trucks). The U.S. battery supply-chain developments — e.g., EV-battery manufacturing pipeline >1,100 GWh/year across North America. For powertrain systems suppliers, this opens new high-value applications (higher torque, durability, integration into commercial powertrains) and shifting business models (fleet retrofit, modular drive systems). As OEMs target heavy-duty electric adoption, powertrain suppliers who can adapt to these specialized vehicle classes will benefit.
Future Outlook
Over the coming years the U.S. electric powertrain market is expected to exhibit strong growth driven by accelerating EV deployment, localisation of supply chains and technological shifts toward higher-voltage architectures and modular e-drives. As OEMs transition vehicle platforms to 400-800 V and beyond, demand for next-gen motor/inverter systems and integrated assemblies will spike. Furthermore, commercial vehicle electrification (light truck, heavy duty vocational) will open new powertrain segments. The policy environment — especially the U.S. federal incentives, state ZEV mandates and localisation subsidies — will amplify investment in domestic manufacturing. Challenges such as raw-material supply constraints, battery cost decline ceilings, and grid/charging infrastructure bottlenecks remain, but the long-term trajectory is favourable for powertrain subsystem suppliers.
Major Players
- BorgWarner Inc.
- Magna International Inc.
- Robert Bosch GmbH
- ZF Friedrichshafen AG
- Dana Incorporated
- Hitachi Astemo Ltd.
- Valeo SA
- Nidec Corporation
- Sigma Powertrain Inc.
- Eaton Corporation plc
- GKN Automotive
- Mitsubishi Electric Corporation
- Hyundai Mobis (EV powertrain unit)
- Aisin Seiki Co., Ltd.
- Cummins Inc.
Key Target Audience
- OEM powertrain / vehicle platform management teams
- Tier-1 electric drive system suppliers
- Aftermarket & retrofit powertrain system providers
- Investments and venture capitalist firms (investing in EV powertrain technology)
- Battery and e-drive component manufacturers (looking to enter U.S. powertrain assembly)
- Government and regulatory bodies (U.S. DOE, U.S. EPA, State ZEV offices)
- Commercial fleet operators (transitioning to electrified powertrains)
- Heavy duty truck/chassis integrators (electrification programme leads)
Research Methodology
Step 1: Identification of Key Variables
The initial phase involves mapping the U.S. electric powertrain ecosystem, covering key stakeholders (OEMs, Tier-1 suppliers, battery/e-drive component makers), system types (BEV, PHEV, HEV, FCEV, commercial), and geographic clusters. Secondary desk research (industry reports, databases, company filings) was used to identify critical variables and define the scope.
Step 2: Market Analysis and Construction
Historical and current market data (2023-24) were collected and analysed across sub-segments (propulsion type, component type, vehicle class, voltage architecture). Where U.S.-specific data were limited, global benchmarks and regional proxies were used with appropriate adjustments. ASP trends, component cost curves and BOM breakdowns were reviewed to build volume and value estimates.
Step 3: Hypothesis Validation and Expert Consultation
A set of hypotheses on key growth drivers and constraints (localisation, infrastructure, supply-chain bottlenecks, high-voltage modules) were validated through discussions with OEM/ Tier-1 executives, powertrain system engineers and supply-chain analysts (via structured interviews and telephone consultations). Their operational/financial insights informed the model refinement.
Step 4: Research Synthesis and Final Output
The final stage involved triangulation of bottom-up component-level build-up, top-down market sizing and cross-check with publicly available databases. The result is a validated U.S. electric powertrain market outlook to 2030, with key trends, segmentation, competitive analysis and actionable insights.
- Executive Summary
- Research Methodology (Definitions & Assumptions, Abbreviations, Market Sizing Approach, Bottom-Up & Top-Down Validation, Primary Research Approach – OEMs / Tier-1 / Government Bodies, Limitations and Future Considerations)
- Definition and Scope of “Electric Powertrain” in the USA context
- Evolution and Genesis of the US electric propulsion ecosystem
- Timeline of Major Milestones (regulation, incentives, EV powertrain launches)
- Business & Value Chain Cycle – from raw materials → components → system integration → OEMs → aftermarket
- Supply Chain & Value-Chain Analysis (battery cell, motor, inverter, thermal module, e-axle, integration)
- Regional footprint in the US (key states, manufacturing clusters, import/export)
- Macro-economic, regulatory & policy landscape for electric powertrains

- Growth Drivers
Vehicle electrification targets & zero-emission mandates
Cost decline in EV powertrain components (battery, SiC, integration)
Domestic manufacturing push & localisation of battery/e-drive supply chain - Market Challenges
Supply-chain constraints (rare earths, SiC, battery raw materials)
Infrastructure limitations (charging, grid, high-voltage safety)
Competitive pressure from imports / global players; margin erosion - Opportunities
High-voltage architectures & system integration (800 V+ platforms)
Commercial vehicle electrification (heavy truck, bus) and new use-cases
Aftermarket retrofit and second‐life battery systems
Strategic M&A / JV models for North America supply chain localisation - Key Trends
Shift from discrete components to integrated e-axle / iDM modules
Increase of silicon-carbide (SiC) / wide-band-gap semiconductors in inverters
Software-defined powertrain platforms (OTA updates, predictive maintenance)
Lightweight materials and modular architectures for e-drives - Regulatory & Policy Framework
Federal incentives (IRA, tax credits), State-level ZEV mandates
Trade & import/export tariffs on EV components
Safety standards, e-drivetrain certifications, recycling & second-life regulation
Ecosystem & Stakeholder Mapping - Porter’s Five Forces Analysis
- SWOT Analysis
- By Value (USD million), 2019-2024
- By Volume (number of units / e-drives shipped) , 2019-2024
- By Average Selling Price (ASP) of powertrain systems (USD per unit) , 2019-2024
- By Vehicle Propulsion Type (Powertrain)
Battery Electric Vehicle (BEV) Powertrain
Plug-in Hybrid Electric Vehicle (PHEV) Powertrain
Hybrid Electric Vehicle (HEV) / 48 V MHEV Powertrain
Fuel Cell Electric Vehicle (FCEV) Powertrain
Commercial Vehicle / Off-Highway Powertrain (e-truck, e-bus, vocational) - By Component Type (Value %)
Battery Pack & Battery Management System (BMS)
Electric Motor / Generator (including e-axle)
Power Electronics & Inverter/Converter (including SiC modules)
Thermal Management & Auxiliary Systems
Integration & System Assembly (modules, e-drive units) - By Vehicle Class (Value / Volume %):
Passenger Cars
Light Commercial Vehicles (LCV)
Medium / Heavy Commercial Vehicles (M/HCV)
Off-Highway / Specialty Vehicles - By Sales Channel (Value %):
OEM-fitted Powertrain Systems
Aftermarket / Retrofit Powertrain Kits - By Voltage Architecture (Value %):
400 V Systems
400–800 V Systems
800 V / Next-Gen High-Voltage Architecture - By Region / State within USA (Value %):
West Coast (CA, OR, WA)
Midwest (MI, OH, IN)
South (TX, GA, TN)
Others (Emerging manufacturing hubs)
- Market Share of Major Players by Value / Volume (USA)
- Cross-Comparison Parameters – (Company Overview, Business Strategy, Recent Developments, Strengths, Weaknesses, Revenues, Revenue by Powertrain Type, R&D Spend, Manufacturing Footprint (USA & Localisation), Number of e-drive platforms supplied, Distribution/After-sales Network, Margins, Partnerships/Joint-Ventures, Unique Value Offering)
- SWOT Analysis of Major Players
- Pricing Analysis – Average Selling Price by SKU / Vehicle Class / Voltage Architecture
- Detailed Profiles of Major Companies
BorgWarner Inc. (USA)
Magna International Inc. (Canada/USA)
Continental AG
Robert Bosch GmbH
ZF Friedrichshafen AG
Dana Incorporated
Hitachi Astemo Ltd.
Marelli Holdings Co., Ltd.
Valeo SA
Nidec Corporation
Sigma Powertrain Inc.
Eaton Corporation plc
GKN Automotive
Magneti Marelli
Cummins Inc.
- Demand and Utilisation by OEMs (passenger, commercial, off-highway)
- Purchasing Behaviour, Budget Allocation & Procurement Strategies (Tier-1 & OEMs)
- Technology Adoption Curve and Time-to-Market Lead-Times
- Pain-Points and Needs (range anxiety, cost parity, integration complexity)
- Decision-Making Process (OEM sourcing strategy, Tier-1 partnerships, localisation)
- Forecast Scenarios – Base‐case, Accelerated and Delayed Adoption
- By Value (USD million), 2025-2030
- By Volume (Units / e-drives), 2025-2030
- By Average Selling Price (ASP) Trends, 2025-2030


 Request a Sample
 Ask for Customization
 Get a Quote
 Enquire Now